How Liquidity Zones Can Change the Way You Trade

JustWolves is an educational platform and is not a SEBI-registered investment advisor. Trading financial instruments involves significant risk of loss and may not be suitable for all investors. Past performance is not indicative of future results. Read our full disclaimer →
In this article · 9 sections
Every stop-loss you place is someone else's entry. That's the game — and once you understand it, you'll never look at a chart the same way.
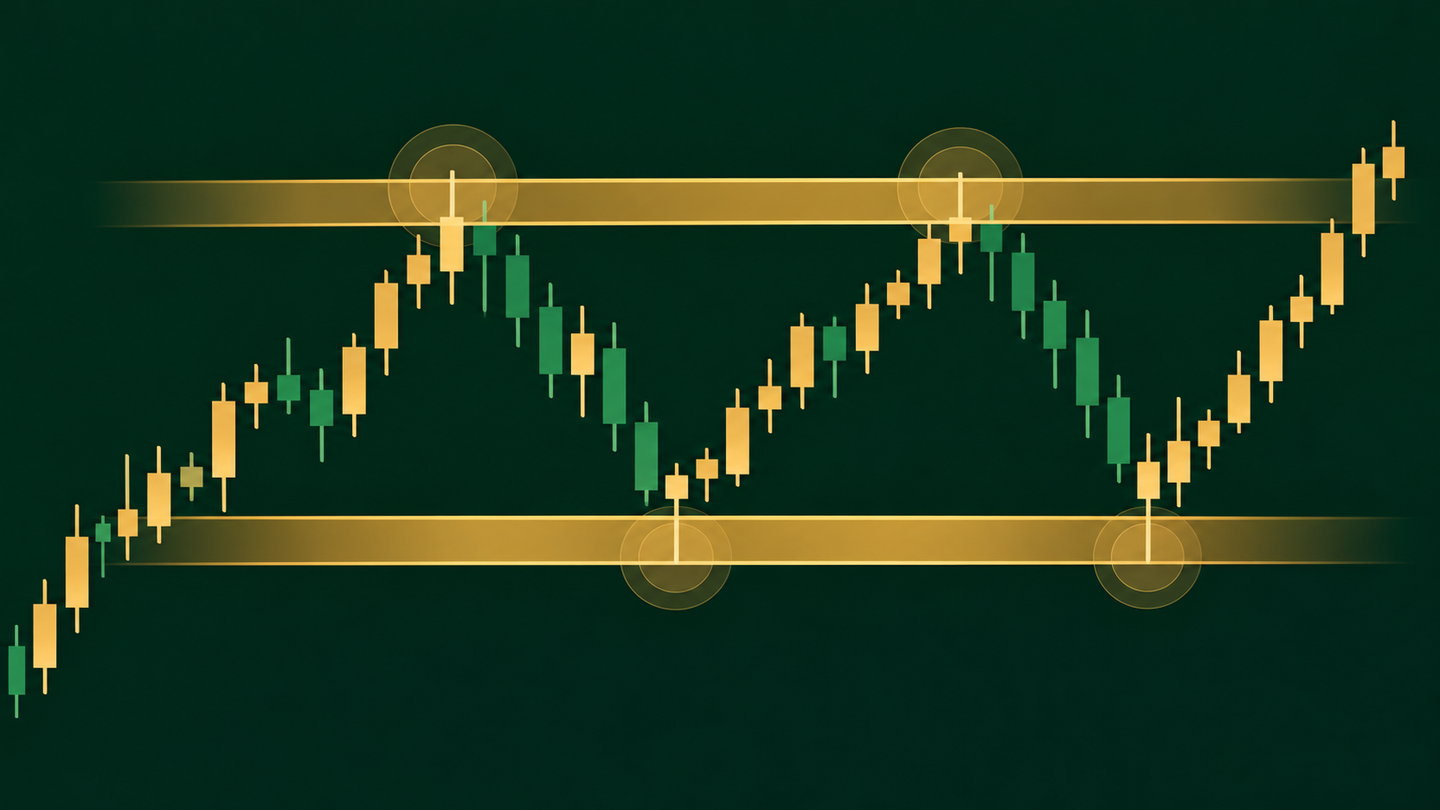
This guide explains what liquidity actually is, where it collects on a chart, how to tell a liquidity sweep from a genuine breakout, and a step-by-step way to trade sweeps with a defined stop and target. The examples are illustrations, not trade signals: the aim is to help you read price, not to promise outcomes.
What Is Liquidity?
In trading, liquidity simply means orders waiting to be filled. Every market has resting orders at different prices: limit orders from traders who want to buy lower or sell higher, and stop orders that turn into market orders once price reaches them. Where many of those orders cluster, a large participant — a bank, a fund, an institution — can buy or sell a big position without pushing price far against itself.
Retail traders create many of these clusters without realising it. Stop-losses tend to sit in the same obvious places — just below a swing low, just above a swing high, under a round number — because most traders learned the same rules from the same books and videos.
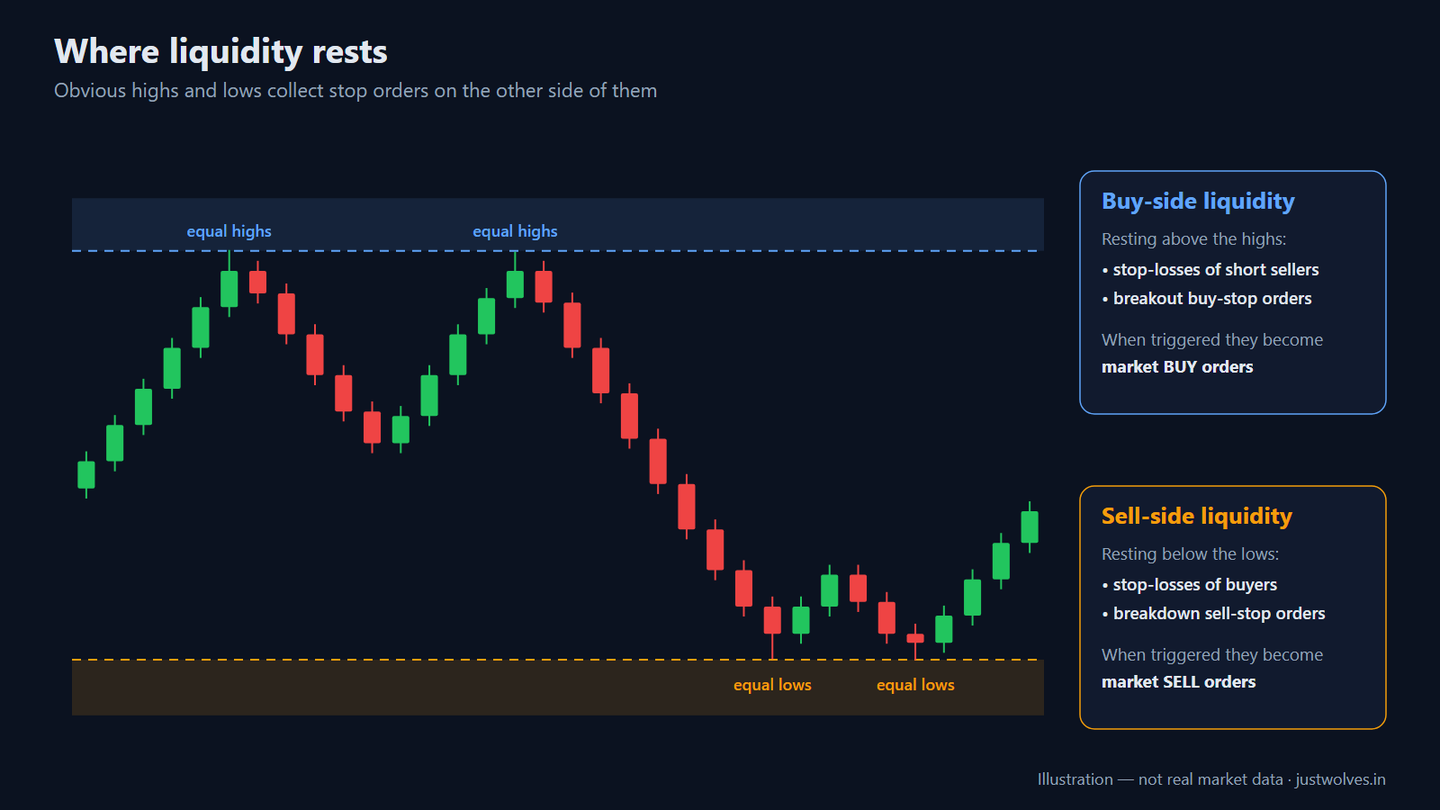
There are two sides to it. Buy-side liquidity sits above highs: the stop-losses of short sellers and the buy-stop orders of breakout traders. When price trades into it, those orders become market buys. Sell-side liquidity sits below lows: the stop-losses of buyers and the sell-stop orders of breakdown traders, which become market sells when they are triggered.
A large seller needs buyers on the other side of the trade. A pool of buy-side liquidity provides exactly that, which is why price often pushes through an obvious high, fills those orders, and then turns lower.
Where Does Liquidity Sit?
The most common liquidity pools form in predictable places, because so many traders use the same reference points:
Common Liquidity Pools
- Equal highs and equal lows — two or more touches at the same price are the most obvious stop clusters
- The previous day's and previous week's high and low
- Session highs and lows, especially the Asian session range before London opens
- Round numbers such as ₹500 on a stock, 25,000 on Nifty or 1.1000 on EUR/USD
- The most recent swing high or swing low on your trading timeframe
- Just beyond trendlines and channel edges, where stops sit behind the line
Not every level carries the same weight. A pool is stronger the more obvious it is: equal lows that have been tested three times, a previous-day high that every intraday trader can see, or a round number on a higher timeframe. A minor swing on a one-minute chart rarely holds enough orders to matter.
Sweep or Breakout? How to Tell Them Apart
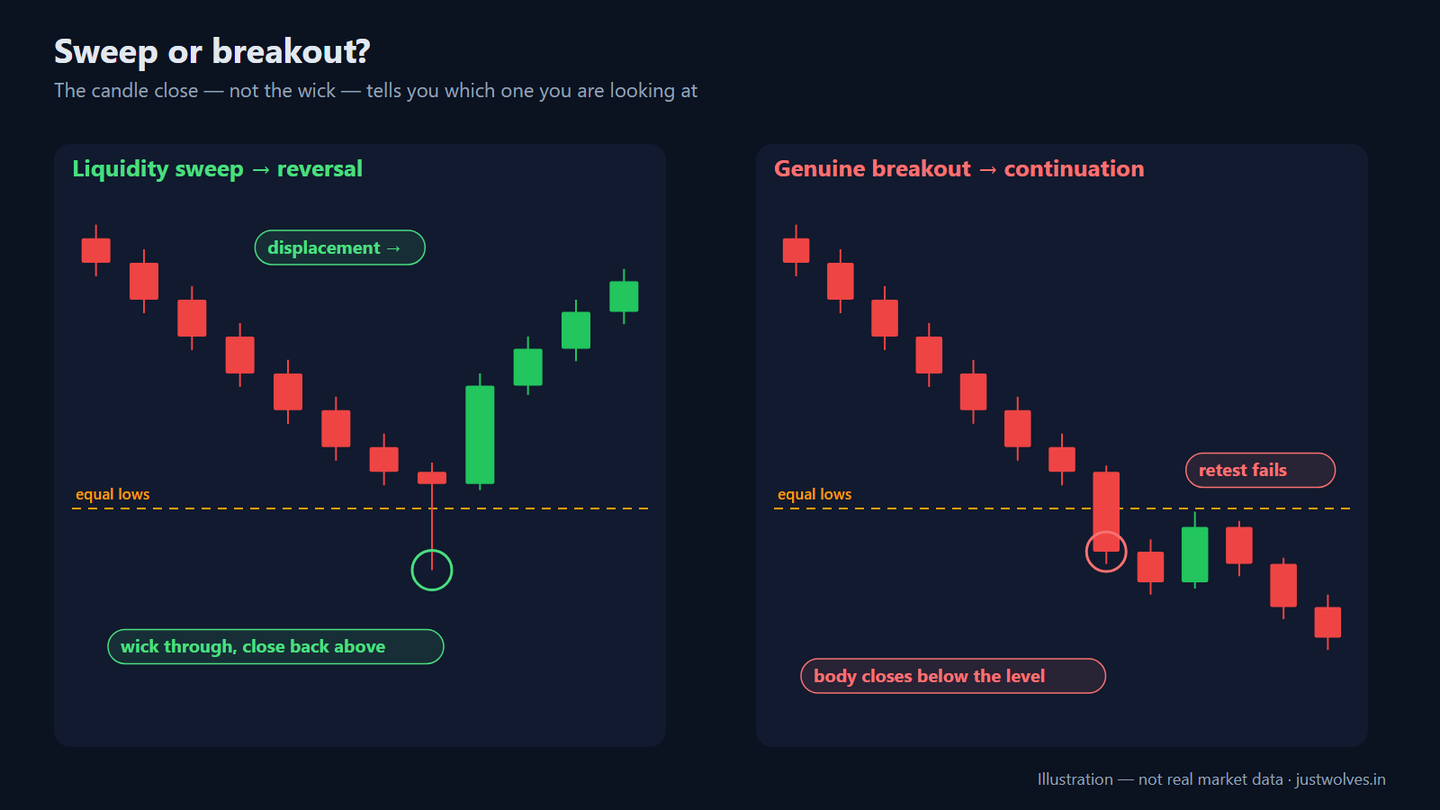
Price trading through a liquidity level can mean two very different things. In a sweep, price runs the stops, fills the orders resting there and quickly returns inside the range — the move through the level was the fuel for a reversal. In a genuine breakout, price moves through the level and keeps going, because there is real demand or supply beyond it.
The candle close is the most useful filter. A wick through the level that closes back inside suggests a sweep. A full candle body closing beyond the level, followed by a failed retest from the other side, suggests a breakout.
| Liquidity sweep | Genuine breakout | |
|---|---|---|
| Candle close | Back inside the range | Beyond the level |
| Speed | Quick rejection, often within one or two candles | Sustained move with follow-through |
| The broken level | Price moves away from it | Often retested and acts as new support or resistance |
| Next move | Displacement in the opposite direction | Continuation in the breakout direction |
| What to do | Wait for confirmation, then trade the reversal | Stand aside, or trade with the breakout |
How to Trade Liquidity Sweeps

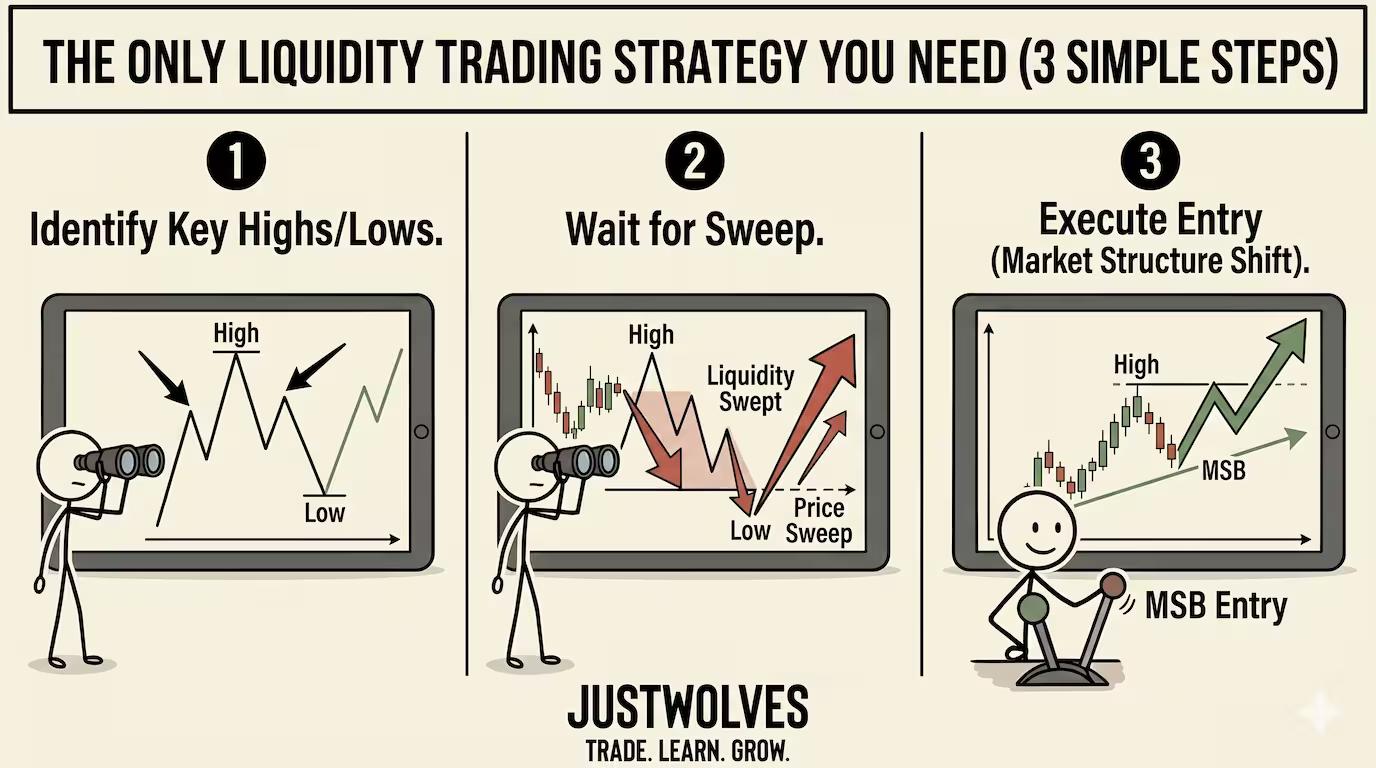
The idea is simple: let price sweep a liquidity pool, then enter in the opposite direction only after the market shows it has rejected the move. The order matters — the confirmation comes after the sweep, never before it.
The 3-Step Entry Process
Step 1: Start with the higher-timeframe bias
Check the daily or 4-hour trend first. A sweep of sell-side liquidity is most useful when the higher timeframe is bullish, and the other way round. Treat the higher timeframe as context: in our test below, the daily trend alone did not separate good sweeps from bad ones.
Step 2: Mark the liquidity pool
Identify equal highs, equal lows, the previous day's high or low, session extremes, or other obvious swing points on your chart.
Step 3: Wait for the sweep
Price must wick through the level and close back above/below it.
Tip: Do not enter during the sweep — wait for the close.
Step 4: Enter on confirmation
Look for a strong engulfing or displacement candle in the opposite direction after the sweep. Many traders then enter on a shallow retrace into that candle rather than chasing it.
Step 5: Place the stop beyond the sweep
Put your stop a few pips or points beyond the extreme of the sweep wick. If price returns there, the reversal idea is wrong and you want to be out.
Tip: Size the position from the stop distance — not the other way round.
Step 6: Target the opposite liquidity
A logical first target is the next pool on the other side, such as the opposite end of the range or the previous swing high. Take partial profit there if your plan allows it.
Worked Example: EUR/USD on the 15-Minute Chart
Here is how the steps fit together. The prices below are illustrative, chosen to make the arithmetic easy to follow; they are not a record of a real trade.
During the Asian session the pair ranges between 1.0850 and 1.0910. At the London open, price drops through the Asian low, trades down to 1.0838 and closes the 15-minute candle back above 1.0850, at 1.0856. The next candle is a strong bullish displacement candle, and on the retrace into it a buy order fills at 1.0860.
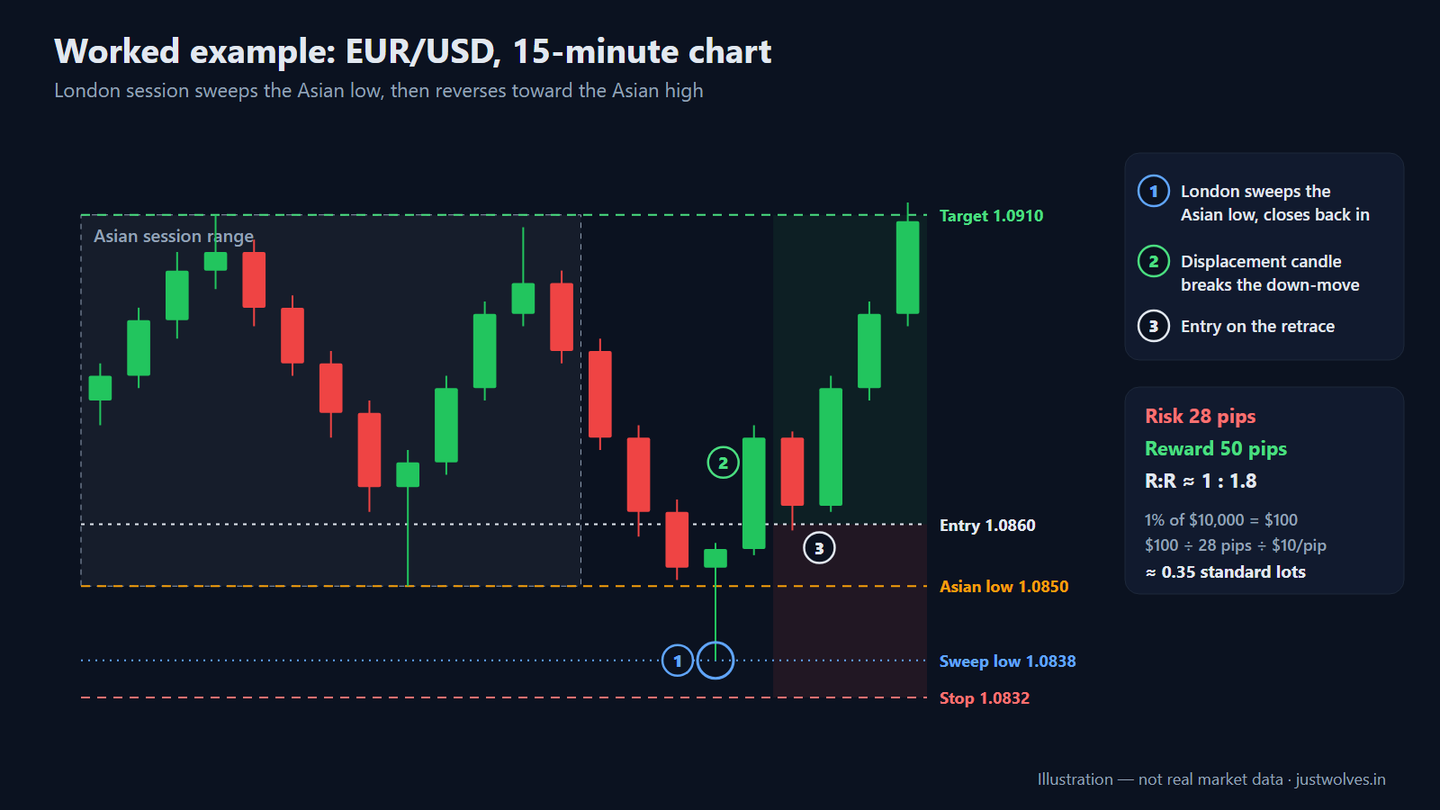
- Entry: 1.0860
- Stop-loss: 1.0832 (6 pips below the 1.0838 sweep low)
- Risk: 1.0860 − 1.0832 = 28 pips
- Target: 1.0910 (the Asian session high)
- Reward: 1.0910 − 1.0860 = 50 pips
- Risk-to-reward: 50 ÷ 28 ≈ 1 : 1.8
- Account: $10,000, risking 1% = $100
- Position size: $100 ÷ 28 pips ÷ $10 per pip per standard lot ≈ 0.36 → round down to 0.35 lots
If price had instead closed a full 15-minute candle back below 1.0850 and failed to reclaim it, the sweep would have turned into a breakdown. The setup would be invalid, and the stop at 1.0832 would limit the loss to roughly 1% of the account — before any slippage.
Real Prices: An Asian-Range Sweep on EUR/USD
The example above uses illustrative prices. The chart below shows the same idea on real EUR/USD prices from 13 November 2026, mirrored for a short: London sweeps the Asian high, the candle closes back inside, and price runs to the other side of the Asian range.
Real prices: London sweeps the Asian high on EUR/USD, 13 November 2026
Step 1 of 4
The Asian range
Between midnight and 07:00 UTC on 13 November 2026, EUR/USD trades from 1.10509 to 1.10705. The range high is printed by the last Asian candle, at 06:45.
- What to observe
- Buy-side liquidity rests above 1.10705; sell-side below 1.10509.
- Condition
- Wait for London.
Do Asian-Range Sweeps Work on Their Own? Our Test
JustWolves tested the simplest version of this guide's setup on real hourly prices for EUR/USD and GBP/USD from January 2024 to November 2026: more than 800 London sessions. The pool: the high and low of the Asian session, 00:00 to 07:00 UTC. The sweep: the first London candle (07:00 to 11:00 UTC) that traded beyond the Asian high or low and closed back inside. Entry: at that close, with the stop 2 pips beyond the sweep. Target: the other side of the Asian range, as in the worked example, or a fixed 2R. Trend: whether the previous day closed above or below its 20-day EMA. We did not add the displacement and retrace steps, which need judgment to define. Costs: 1 pip per round trip.
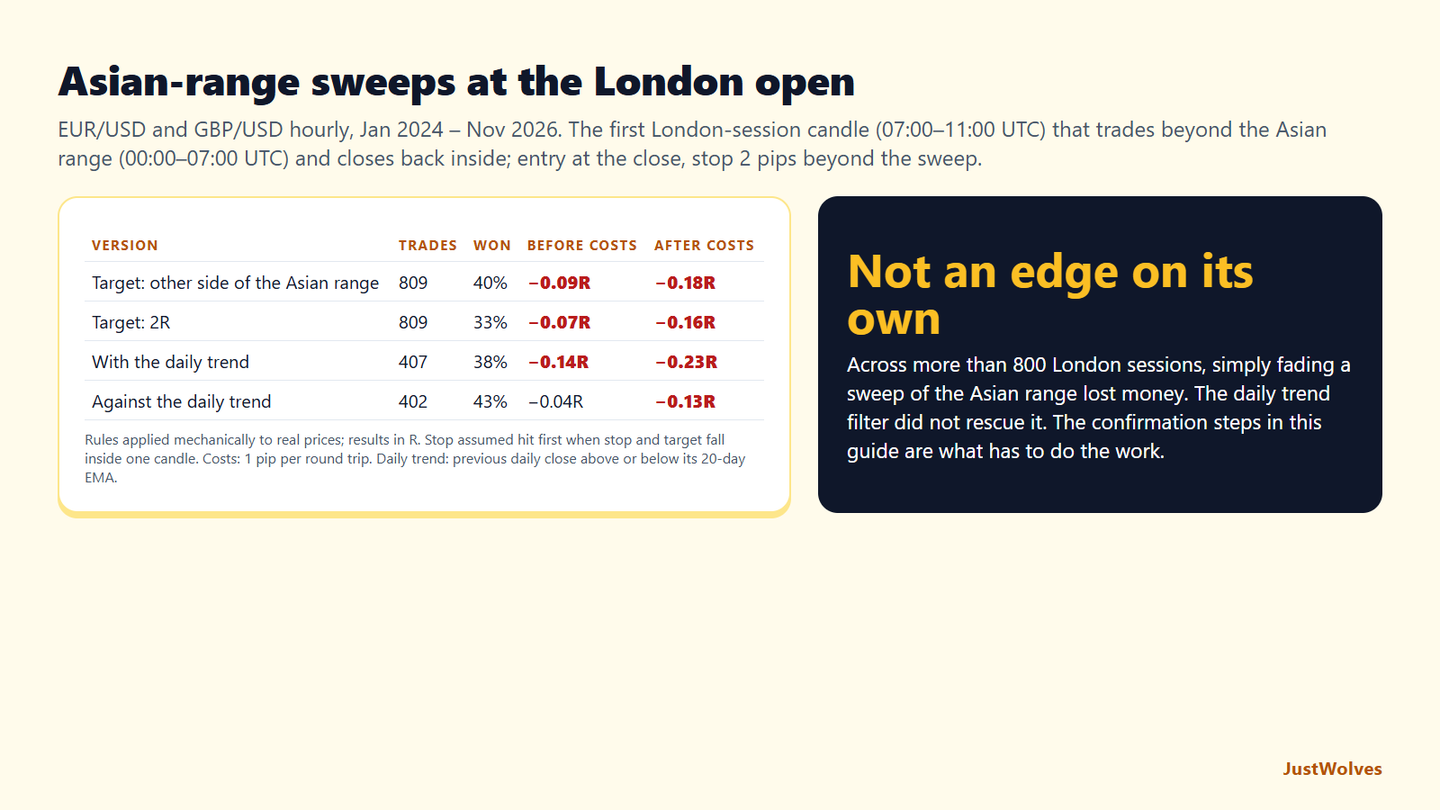
| Version | Trades | Won | Before costs | After costs |
|---|---|---|---|---|
| Target: other side of the Asian range | 809 | 40% | −0.09R | −0.18R |
| Target: 2R | 809 | 33% | −0.07R | −0.16R |
| With the daily trend | 407 | 38% | −0.14R | −0.23R |
| Against the daily trend | 402 | 43% | −0.04R | −0.13R |
The bare sweep was not an edge. Fading the first sweep of the Asian range lost about 0.1R per trade before costs, whichever target we used. Many London sweeps were the start of a real move, not the end of one: the candle closed back inside, then price broke out properly an hour or two later.
The daily trend did not rescue it. Sweeps in the direction of the daily trend did slightly worse than those against it. This guide's advice to start with the higher timeframe is sensible context, but on its own it did not separate good sweeps from bad ones.
Confirmation has to do the work. The guide's other steps, a strong displacement candle after the sweep and an entry on the retrace, are what a trader would rely on to filter out the sweeps that turn into breakouts. They are harder to define mechanically, which is why we left them out. Record them in your own trading journal and measure whether they improve on the numbers above.
Common Mistakes to Avoid
- Entering during the sweep. Catching the exact low is tempting, but until the candle closes you cannot tell a sweep from a breakout.
- Treating every wick as a sweep. Small wicks through minor levels happen all the time; focus on obvious, well-defined pools.
- Ignoring the higher timeframe. A sweep that fights a strong daily trend needs extra confirmation, although in our test the trend alone was not a reliable filter.
- Trading straight into news. High-impact releases can blow through several levels in seconds, with wide spreads and slippage.
- Putting the stop inside the sweep. If your stop sits where the next sweep will reach, you become the liquidity.
- Oversizing because the setup looks clean. Clean-looking setups still fail; keep the risk on each trade small and fixed.
Key Takeaways
What to Remember
- Stop-losses create liquidity — yours and everyone else's
- Large participants use these pools to fill orders, which is why price often runs an obvious level before reversing
- A wick through the level that closes back inside suggests a sweep; a body close beyond it suggests a breakout
- Always wait for displacement after the sweep before entering
- Put the stop beyond the sweep and size the position from that distance
- Use higher-timeframe bias as context, and check whether it actually improves your own results
Frequently Asked Questions
What is a liquidity zone in trading?
A liquidity zone is a price area where many orders are resting — mostly stop-losses and pending breakout orders. These zones usually sit just beyond obvious highs, lows and round numbers. When price reaches the zone, the orders are triggered, which gives large participants the volume they need to fill big positions.
Is a liquidity sweep the same as a stop hunt?
They describe the same price behaviour: price trades through a level where stops are clustered and then reverses. 'Stop hunt' suggests someone is deliberately targeting those stops; 'sweep' simply describes what happened. Either way, what matters for your trading is how price behaves after the level is taken.
Which timeframe is best for trading liquidity sweeps?
Many traders mark liquidity on a higher timeframe such as the daily or 4-hour chart, then look for the sweep and the confirmation on a lower timeframe such as the 15-minute or 5-minute chart. The idea works on any timeframe, but levels on higher timeframes usually hold more orders.
Do liquidity sweeps work on Nifty and Bank Nifty?
The same idea applies to any liquid market, including Nifty and Bank Nifty futures and options. Useful levels there include the previous day's high and low, the opening range, and round numbers such as 25,000 on Nifty. As with any setup, results vary and nothing is guaranteed.
Do Asian-range liquidity sweeps work at the London open?
Not on their own, in our test. On 809 real London sessions for EUR/USD and GBP/USD from January 2024 to November 2026, entering at the close of the first candle that swept the Asian high or low and closed back inside lost about 0.1R per trade before costs.
Topics