How to Value a Stock: P/E Ratios, DCF Analysis and the Margin of Safety

JustWolves is an educational platform and is not a SEBI-registered investment advisor. Trading financial instruments involves significant risk of loss and may not be suitable for all investors. Past performance is not indicative of future results. Read our full disclaimer →
In this article · 12 sections
Some Indian shares cost more than ₹1 lakh each; others trade below ₹50. Does that make the first expensive and the second cheap? No, and understanding why is the foundation of stock valuation. The price is what you pay; the value is what you receive. This guide walks through three methods for judging whether a stock is genuinely cheap or genuinely expensive before you commit a single rupee, with a worked example and a rupee DCF.
Why Stock Price Alone Tells You Nothing
A new sports car can be a bargain at its price; a broken bicycle at ₹500 is expensive. The number on a price tag only becomes meaningful when compared with what you receive in return. The same logic applies to every stock in the market.
Valuation is the attempt to measure the gap between the price the market charges today and the value the business will deliver over time: whether that value exceeds, matches or falls short of the price.
Investors use many yardsticks to estimate value. The most common is earnings. Just as a student weighing an expensive degree calculates how many years of extra salary will pay it back, a stock investor asks how quickly a company's earnings will repay the purchase price. That ratio is the foundation of relative valuation.
Valuation Multiples: The Right Yardstick

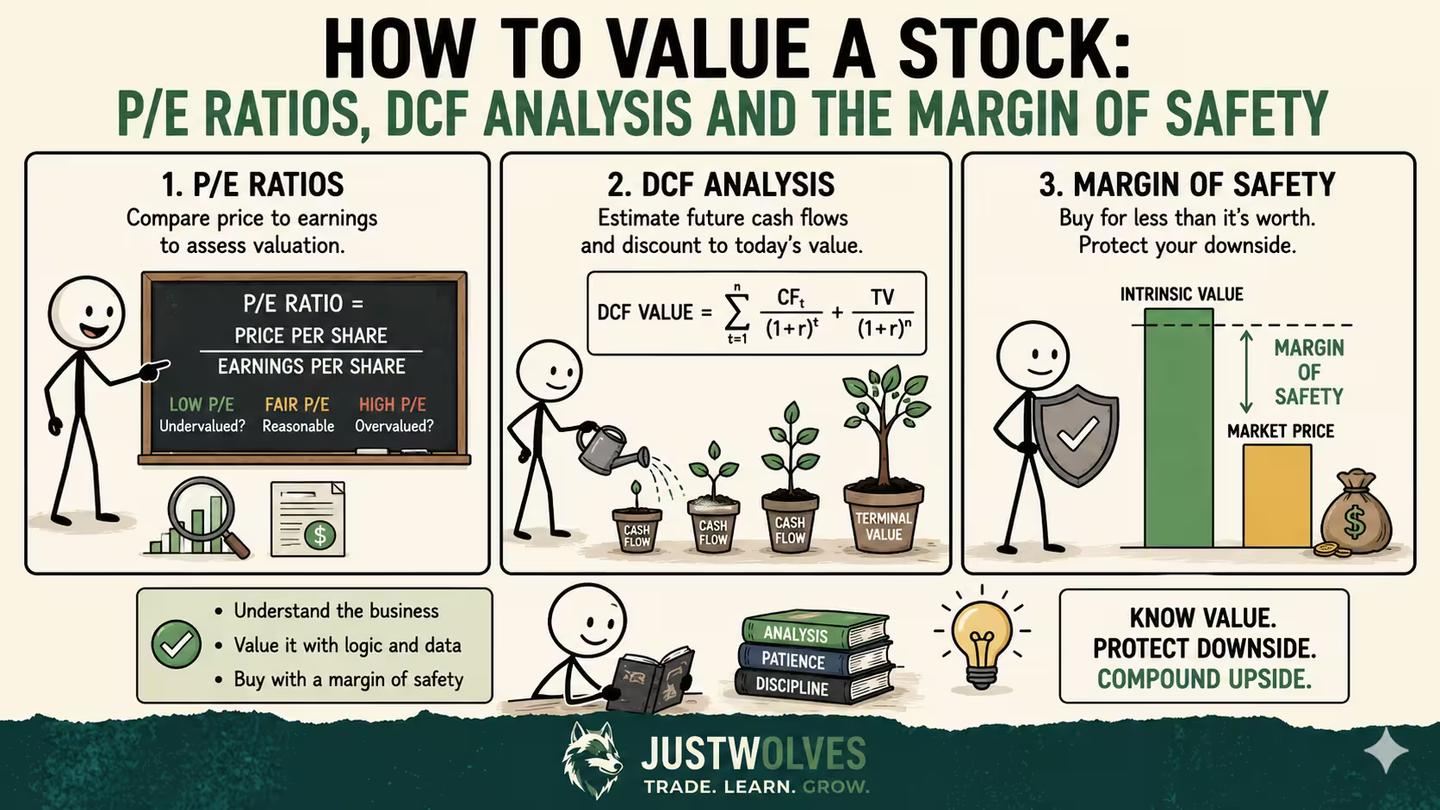
The most widely used valuation multiple is the price-to-earnings ratio — the P/E ratio. It measures how many years of current earnings you are paying for when you buy the stock today.
At a price of $72 per share and earnings of $2.50 per share, our example company's P/E is 72 ÷ 2.50 = 28.8. (Throughout this guide we use a large global beverage company with illustrative figures in US dollars.) An investor is paying 28.8 years of current annual earnings upfront. On its own, this number is neither cheap nor expensive — it only becomes meaningful in comparison.
That comparison is the core of relative valuation: compare the current P/E to the company's own historical average and to the P/E of comparable companies in the same industry. This two-part check tells you whether the market is pricing the stock above or below what has historically been fair value.
Trailing P/E vs Forward P/E
The standard P/E ratio uses the last twelve months of actual reported earnings — the trailing P/E. It describes the past, and you cannot pay bills with past performance.
The forward P/E divides the current price by analysts' consensus estimate for next year's earnings. For our example company, with earnings expected to grow, the forward P/E is lower than the trailing P/E — approximately 24.3 times. Forward P/E gives a better sense of what you are actually paying for, though it introduces forecast uncertainty.
For stable, slow-changing businesses, forward P/E is the more useful starting point. For cyclical or high-growth companies where analyst estimates are unreliable, trailing P/E or other multiples may be more robust.
Example Valuation Snapshot (Illustrative)
$72
Current share price (example)
28.8×
Trailing P/E — price ÷ last 12 months EPS of $2.50
24.3×
Forward P/E — price ÷ next-year analyst EPS estimate
23×
10-year historical median forward P/E for the company
21.3×
Beverage peer group average forward P/E
Historical Averages and Peer Comparison
Two benchmarks make the P/E ratio actionable: the company's own long-run average and the valuation of its direct competitors.
For this company over the past ten years, investors have typically paid around 23 times forward earnings. That is the historical anchor. A current forward P/E of 24.3 times sits above that anchor — the market is pricing the company slightly more expensively than usual, suggesting limited upside unless earnings grow faster than expected.
Peer comparison extends the analysis further. Its listed beverage competitors trade at an average forward P/E of 21.3 times. At 24.3 times, the company carries a premium over its peers. Were it repriced to match the peer average, the stock would fall approximately 12%.
The peer comparison can also surface better opportunities within the same industry. One smaller competitor in this example trades at a discount both to its own historical average and to the peer group median. If it reaches its historical valuation, it offers 18% upside. If it reaches the peer group average, the upside grows to 33%. The same research that benchmarks one stock frequently illuminates a more attractive alternative nearby.
The Margin of Safety: The Three Most Important Words in Investing
The margin of safety is one of the oldest ideas in value investing. It is straightforward: never buy a stock when its price equals your estimate of its intrinsic value. Buy only when there is a meaningful gap between what you pay and what the business is genuinely worth.
The reason is humility. Valuation is an imprecise art, the future is unpredictable, and investors make mistakes. The margin of safety exists to absorb those inevitable errors, so that being somewhat wrong does not mean losing money.
The required margin of safety should scale with your confidence in your assumptions. For simple, stable businesses you understand deeply, with long records of steady cash flows, a small cushion may be enough because your forecasts are more likely to hold. For businesses in rapidly changing industries, a large discount is needed, or the honest answer is to skip them altogether.
In practice: predictable businesses with durable competitive advantages need a 10–20% margin of safety. Uncertain, disruption-prone businesses should be bought only at a 30–50% discount to intrinsic value, or not at all.
The Limits of Relative Valuation
Relative valuation has a structural flaw: it assumes the comparison benchmarks are themselves rational. If an entire sector is overpriced, finding the "cheapest" stock still means buying an overpriced asset.
During the 2000 dot-com bubble, a software company at 100 times earnings was described as cheap because peers traded at 200 times. Both valuations were irrational. Three years later, the "cheap" stock had lost 90% of its value alongside the rest of the sector.
Relative valuation is a necessary first filter — it quickly identifies candidates that warrant deeper analysis. But it cannot stand alone. The next step is absolute valuation: determining what the business is actually worth in cash terms, independent of what the market is currently paying for anything in its category.
DCF Analysis: Three Questions Behind Every Valuation

Every valuation comes down to three questions about any investment: How much cash will I get? When will I get it? How certain am I?
These three questions are the basis of a discounted cash flow (DCF) analysis. A DCF can value a stock, a private business, a rental property, a bond or a lemonade stand. The logic is universal: the value of any investment today is the sum of all the cash it will generate in the future, adjusted for the time value of money.
Step 1: Free Cash Flow — How Much Cash Will You Get?
The DCF model uses free cash flow (FCF) rather than earnings. Free cash flow is the cash generated after funding all the investment needed to sustain and grow the business. The formula: FCF = Operating Cash Flow − Capital Expenditures.
Free cash flow is closer to the actual money available to shareholders than reported earnings, because it accounts for the real capital spending required to run the business. A company with strong earnings but heavy capital reinvestment requirements may produce far less actual cash than its income statement suggests.
To forecast future FCF, start with the historical record. For our example company, roughly $10 billion a year is a reasonable baseline under normal conditions. The growth rate applied should reflect both the company's own historical FCF growth and the expected expansion of its industry. For this company, historical FCF growth has been about 3.5% a year, and its industry is assumed to grow at about 6% a year. A 4% annual growth rate for the forecast is reasonable, yielding projected year-ten FCF of approximately $14.8 billion.
Step 2: The Discount Rate — When Will You Get It?
Money received today is worth more than money received next year. A 10% discount rate means you value next year's $100 at $90.91 today, because $90.91 invested now at 10% grows to exactly $100 in a year. The discount rate captures this time preference and the risk you are taking.
A practical approach: start with the long-term government bond yield as the risk-free base, and add a premium for the extra risk of owning a business. When bond yields are high, your discount rate rises with them; when they fall, so does the rate. A common rule of thumb for stable businesses is the bond yield plus about three percentage points, with more for riskier or less predictable companies.
Choose a rate high enough that a further one or two percentage point rise in interest rates would not leave you regretting what you paid.
A Simple Discount Rate Framework
Treasury + ~3%
Practical approximation of a discount rate — adjusts automatically as interest rates change
7.5% (example)
At current US 10-year yield of ~4.5%: 4.5% + 3% = 7.5% discount rate for a stable global consumer business
Step 3: Business Certainty — How Sure Are You?
The third question is the qualitative filter: how reliable is the business, and how resistant is it to competitive disruption?
A company that has sold a nearly identical product for more than a century, with steady distribution, consumer preference and brand loyalty, is far more predictable than most. An analysis written decades ago would still largely apply. That is what a DCF needs: not perfect prediction, but a business whose cash flows can be estimated with reasonable confidence over long periods.
Technology hardware, cyclical industries and businesses facing structural disruption carry far less certainty. For these, the forecast cash flows in a DCF are speculative, and the margin of safety must be proportionally larger.
Terminal Value: Exit Multiple vs Perpetuity Growth
A standard DCF forecasts detailed cash flows for years one through ten, then adds a terminal value — a single number representing all cash flows from year eleven onward. This is necessary because business value extends far beyond any ten-year window.
The exit multiple method asks: if the business were sold at the end of year ten, what multiple of that year's FCF would a buyer pay? For this company, the historical median price-to-FCF multiple is approximately 33 times. Applying this to projected year-ten FCF of $14.8 billion gives a terminal value of $488 billion.
The perpetuity growth method asks: what if the business continues growing at a modest rate forever? The formula: Terminal Value = FCF in year eleven ÷ (discount rate − perpetual growth rate). With 3% perpetual growth and a 7.5% discount rate, this produces a much lower terminal value — and a total DCF valuation of approximately $248 billion versus $320 billion using the exit multiple.
Neither method is definitively correct. Averaging both provides a more balanced estimate. When neither produces a compelling buy at a meaningful margin of safety, the conclusion is clear: the stock is not an obvious bargain at today's price.
A Full Worked DCF Example (Illustrative)
Combining all the inputs discussed above, here is a summary of the example DCF.
Example DCF Key Inputs
$10B
Estimated baseline free cash flow (current year)
4%
Annual FCF growth rate applied over years 1–10
$14.8B
Projected free cash flow in year 10
7.5%
Discount rate (US 10-year yield + 3%)
33×
Exit multiple — historical median price-to-FCF
3%
Perpetual growth rate used in terminal value
Using the exit multiple method, the DCF values the example company at about $320 billion. Using perpetuity growth, the value falls to about $248 billion. Averaging both methods puts intrinsic value at roughly $284 billion. If the company's market value were well above that, the stock would not offer a margin of safety: it would look fairly priced at best.
The arithmetic checks out: $10 billion growing 4% a year reaches about $14.8 billion in year ten. Discounted at 7.5%, the ten years of cash flows are worth about $84 billion today. A terminal value of 33 times year-ten cash flow, $488 billion, is worth about $237 billion today, for a total of about $320 billion. The perpetuity method's terminal value, $14.8 billion × 1.03 ÷ (0.075 − 0.03) ≈ $339 billion, is worth about $164 billion today, for a total of about $248 billion.
This is an illustration of the process, not a view on any company. The same framework applied to a stock trading at a large discount to its DCF value would reach a very different conclusion.
The Three-Method Stock Valuation Process
Relative Valuation — Is it cheap vs history and peers?
Calculate trailing and forward P/E. Compare to the company's own 5–10 year median and to direct competitors. This takes 15–30 minutes with free financial-data websites. It quickly filters out obviously expensive stocks and surfaces candidates worth deeper analysis.
Margin of Safety — Is the discount large enough?
Calibrate the required discount to the predictability of the business. Predictable moat businesses: 10–20% below intrinsic value may be sufficient. Uncertain, disruption-prone businesses: 30–50% below intrinsic value, or skip them entirely.
DCF Analysis — What is it actually worth in cash terms?
Estimate baseline FCF, apply a realistic growth rate, discount at treasury yield + 3%, calculate terminal value using both methods, and average the results. When relative valuation and DCF both point to a buy at an adequate margin of safety, the investment case is strongest.
The Same Method in Rupees: How Assumptions Move the Answer
The worked example above uses dollar figures and US bond yields. For an Indian company, both the growth and the discount rate are usually higher. Here is the same DCF method applied to an illustrative Indian company with ₹1,000 crore of free cash flow today. Cash flows grow at a chosen rate for ten years, then at 5% a year forever, and everything is discounted at a rate built the same way: an assumed 6.5% government bond yield plus a 4-point premium, or 10.5%, in the base case.
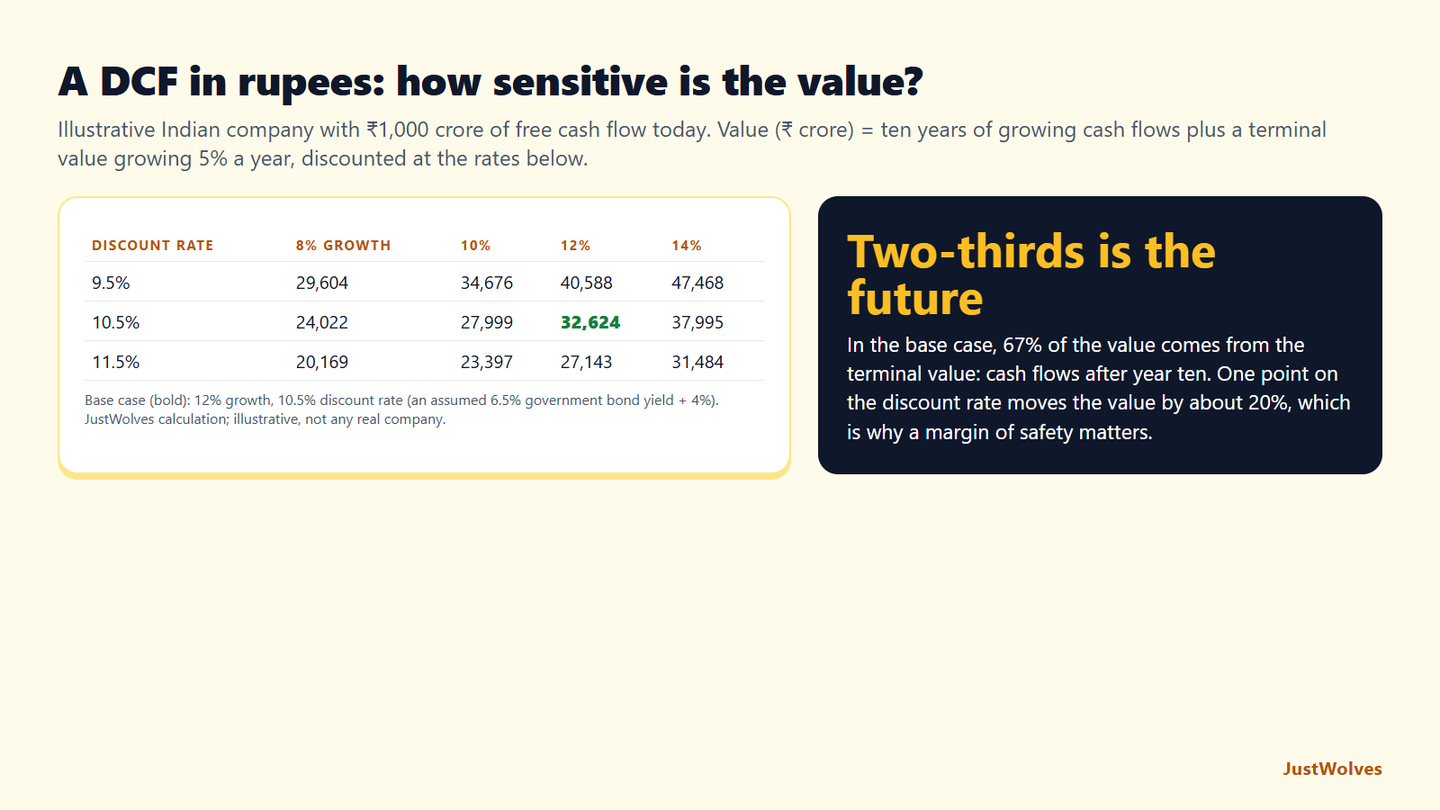
| Discount rate | 8% growth | 10% growth | 12% growth | 14% growth |
|---|---|---|---|---|
| 9.5% | 29,604 | 34,676 | 40,588 | 47,468 |
| 10.5% | 24,022 | 27,999 | 32,624 | 37,995 |
| 11.5% | 20,169 | 23,397 | 27,143 | 31,484 |
The base case is worth ₹32,624 crore. Ten years of growing cash flows contribute ₹10,778 crore of that, and the terminal value, everything after year ten, contributes ₹21,847 crore: two-thirds of the total. A DCF is mostly a bet on the distant future.
Small changes move the answer a lot. One percentage point on the discount rate moves the value by roughly 17–24%. Two points of growth move it by roughly 15%. Between the most cautious and most optimistic corners of this table, the value more than doubles, from ₹20,169 crore to ₹47,468 crore.
That is why the margin of safety exists. If a stock is only cheap under your most optimistic assumptions, it is not cheap. Look for a price that still makes sense with conservative growth and a higher discount rate, and you build in the cushion this guide describes.
Key Takeaways
How to Value a Stock — What to Remember
- Price alone tells you nothing — value is determined by the cash a business will generate relative to the price you pay today
- P/E ratio = price ÷ earnings: tells you how many years of current earnings you are paying for upfront
- Forward P/E uses next-year earnings estimates; more relevant than trailing P/E but dependent on forecast accuracy
- Compare current P/E to two benchmarks: the company's own 5–10 year historical median and the industry peer group average
- Peer comparisons often reveal more attractive investments in the same sector — always scan the full group
- Margin of safety is essential: buy at a meaningful discount to intrinsic value, not at it, because valuation is imprecise
- Required margin of safety scales with uncertainty — predictable businesses need less cushion; uncertain ones need more
- DCF valuation answers three questions: How much cash? When? How certain?
- Free cash flow = operating cash flow minus capex — harder to manipulate and more accurate than earnings for DCF
- Discount rate = 10-year government bond yield + ~3% (a practical rule of thumb)
- Terminal value: use both exit multiple and perpetuity growth, then average — neither alone is definitive
- When neither method produces a meaningful margin of safety, the stock is fairly priced or expensive — wait for a better entry price
Frequently Asked Questions
What is the simplest way to tell if a stock is cheap or expensive?
Compare the forward P/E ratio to two benchmarks: the company's own 5–10 year median forward P/E and the current median forward P/E of its direct competitors. If the stock's current forward P/E sits meaningfully below both benchmarks, it is at a relative discount. If it exceeds both, the market is pricing it expensively by historical and comparative standards. This two-benchmark check is the fastest first-pass filter — but always verify with a DCF before investing.
What is the difference between the P/E ratio and a DCF model?
The P/E ratio is a relative measure — it tells you whether a stock is cheap or expensive compared to other stocks or its own history. A DCF is an absolute measure — it estimates the actual cash value of the business independent of any market comparison. P/E is fast and useful for screening; DCF is slower but provides an independent intrinsic value estimate. The strongest investment cases are those where both methods point to the same conclusion.
What discount rate should I use in a DCF model?
A practical starting point is the current 10-year government bond yield plus approximately 3 percentage points. At a US 10-year yield of 4.5%, that gives a discount rate of 7.5%. This framework automatically adjusts as rates change — higher rates make equities less attractive, lower rates make them more so. For higher-risk or less predictable businesses, add an additional 2–5% risk premium on top.
How large should the margin of safety be?
For highly predictable, competitively protected businesses, experienced value investors may buy close to intrinsic value, though they prefer 20–30% below. For businesses in uncertain or rapidly changing industries, a 40–50% discount is more appropriate to compensate for the higher probability of forecast errors. If you cannot find a sufficient margin of safety at current prices, the correct action is simply to wait.
Why use free cash flow instead of earnings in a DCF?
Free cash flow (operating cash flow minus capital expenditures) reflects the cash actually available to shareholders after funding all reinvestment needs. Earnings can be shaped by accounting choices — depreciation methods, revenue recognition, non-cash charges — that diverge from real cash generation. Free cash flow is harder to manipulate and more directly represents what the business is delivering to its owners.
Can the DCF method be used for any stock?
DCF works best for mature businesses with relatively predictable cash flows — consumer staples, utilities, financial services, established industrials. It is less reliable for early-stage companies with no current cash flows, highly cyclical businesses where FCF swings wildly year to year, or companies in industries facing structural disruption where a 10-year forecast is essentially speculation. For those situations, sector-specific multiples, sum-of-the-parts analysis, or simply passing on the investment are more appropriate responses.
How sensitive is a DCF valuation to its assumptions?
Very. In our illustrative rupee DCF of a company with ₹1,000 crore of free cash flow, changing the discount rate by one percentage point moved the value by about 17–24%, and the value ranged from ₹20,169 crore to ₹47,468 crore across reasonable growth and discount assumptions. About two-thirds of the base-case value came from cash flows after year ten.
Topics