The Previous Candle High and Low Strategy: A Session Candle Model for NQ and Forex

JustWolves is an educational platform and is not a SEBI-registered investment advisor. Trading financial instruments involves significant risk of loss and may not be suitable for all investors. Past performance is not indicative of future results. Read our full disclaimer →
In this article · 12 sections
You’ve probably had this happen. You’re watching NQ during the New York open and you can see what’s coming. Price has just run above an obvious high and you’re fairly sure it’s going to reverse. You hover over the sell button and wait for one more candle. Then another. By the time you click, the move is half over, and your stop goes on the first bounce.
The trader in this story can read the market. What they don’t have is a rule that says this candle, this level, this trigger, act now. Seeing the trade and executing it are two different skills, and the second depends almost entirely on how clear your plan is.
The previous candle high and low strategy is built to give you that clarity. You don’t try to interpret every tick. You focus on a small number of timed session candles in London and New York and ask one question: what did the next candle do with the previous candle’s high or low? The answer gives you a bias. Lower timeframes then give you a precise, low-risk entry.
Start With Key Levels, Not Candles
The session candle model doesn’t work in isolation. Before any session starts, you should already have your intraday key levels on the chart: the previous day’s high and low, clear swing highs and lows, and unfilled imbalances on higher timeframes. If you need a refresher, read our higher timeframe trading framework.
These levels tell you where price is likely to react. The session candles tell you when to pay attention and in which direction. A previous-candle sweep that happens right into a higher-timeframe level is far more meaningful than one in the middle of nowhere.
The Session Candles to Watch (IST Timings)
The method only trades London and New York, the two sessions with the most institutional volume. Within them, it only looks at specific 1-hour and 4-hour candles. The source material gives these times in Indian Standard Time:
| Session & market | Candle | Summer (late March – early November) | Winter (November – March) |
|---|---|---|---|
| London (forex) | 1-hour | 12:30 PM and 1:30 PM | 1:30 PM and 2:30 PM |
| London (forex) | 4-hour | 2:30 PM | 3:30 PM |
| New York (forex) | 1-hour | 5:30 PM and 6:30 PM | 6:30 PM and 7:30 PM |
| New York (forex) | 4-hour | 6:30 PM | 7:30 PM |
| New York (indices, e.g. NQ) | 1-hour and 4-hour | 6:30 PM | 7:30 PM |
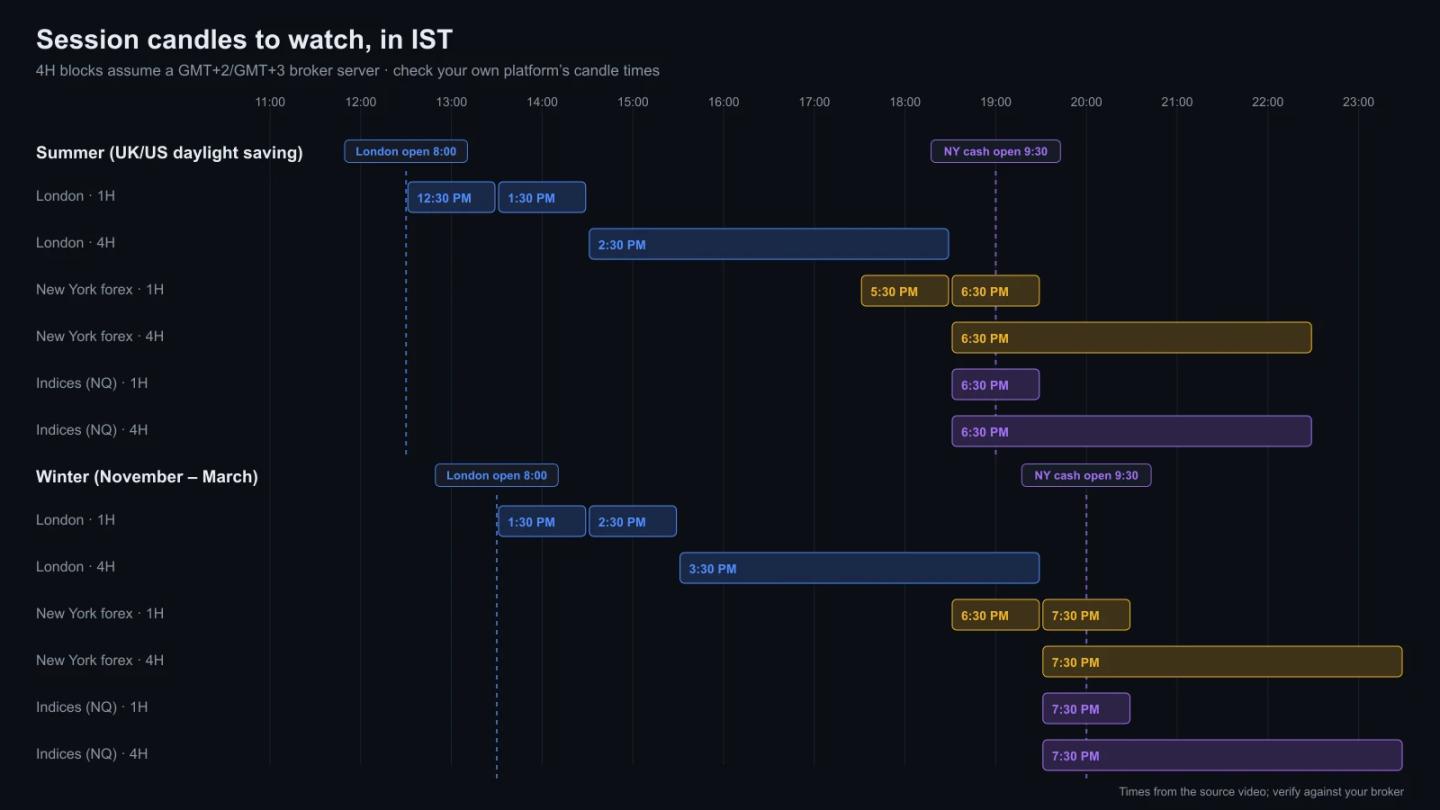
The 12:30 PM summer candle lines up with 8:00 AM in London, when the London session begins. For indices, the 6:30 PM candle contains the 9:30 AM New York cash-equity open, which is the start of the “AM session” that matters most for NQ.
Why the times move in November and March
India doesn’t use daylight saving time, but the UK and the US do. When they set their clocks back for winter, every session candle arrives one hour later on an Indian clock.
The two countries don’t change on the same day. The UK changes on the last Sunday of March and of October. The US changes on the second Sunday of March and the first Sunday of November. For a week or two around each change, London and New York are out of step. During those weeks, check each session separately.
Check your platform’s clock
The 4-hour times in the table assume a broker whose server runs on GMT+2 in winter and GMT+3 in summer, which is common among retail trading platforms. A chart set to UTC draws 4-hour candles from different start times, so the highs and lows will differ. Hover over the latest 4-hour candle on your own chart and confirm it opens when the table says it should. If it doesn’t, adjust your time zone or rebuild the table for your platform.
The Core Rule: Close Beyond or Sweep and Return?
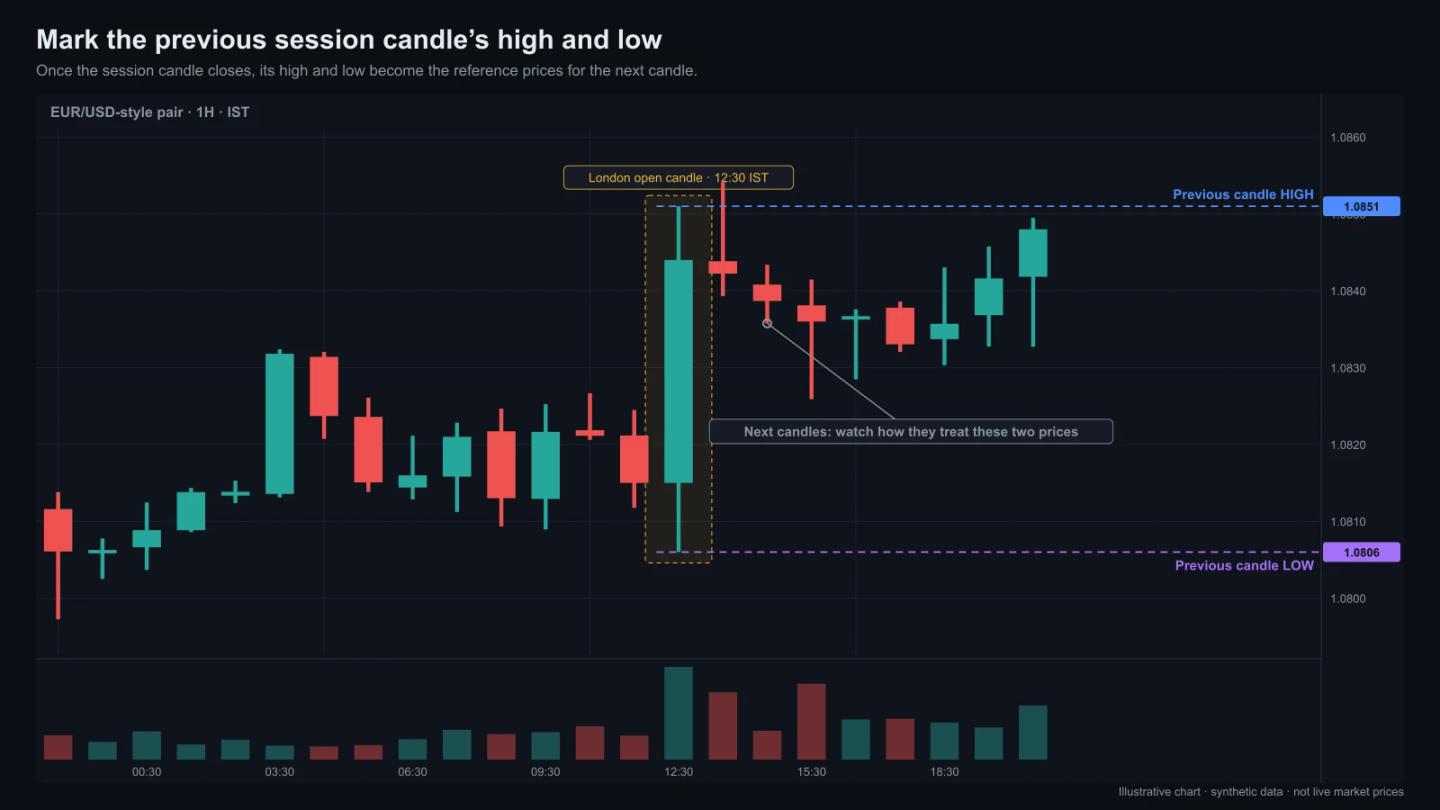
Once a session candle has closed, mark its high and low. When the next candle forms, it’ll usually interact with one of those two prices. How the body of that candle closes relative to the level is the centre of the whole method.
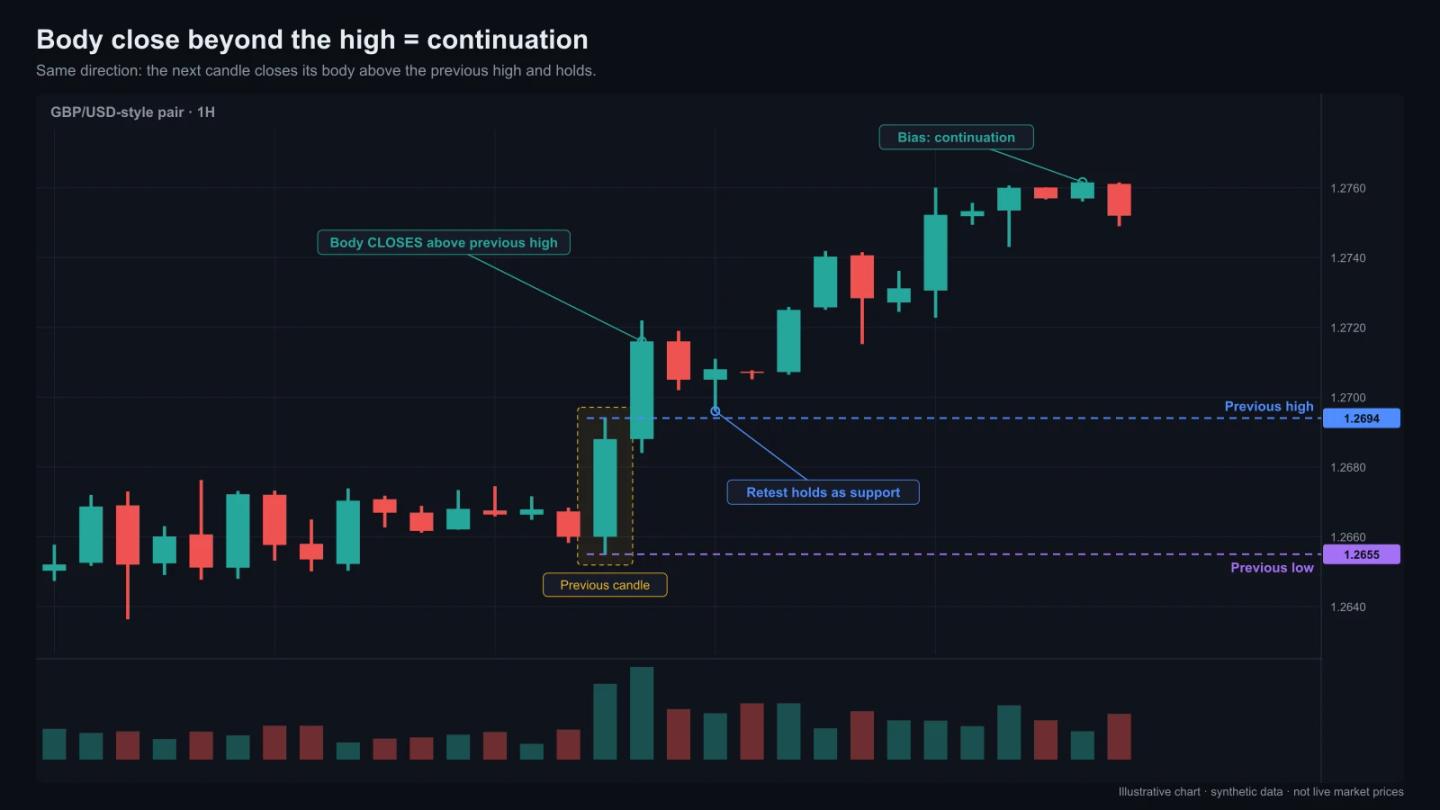
Same direction: body closes beyond, so expect continuation
Suppose the previous candle was bullish, and the next candle pushes above its high and closes its body above that high. Buyers have been accepted at higher prices, so the bias is continuation. You look for longs on pullbacks, and the old high often acts as support.
The same logic works in reverse for a bearish candle that closes below the previous low.
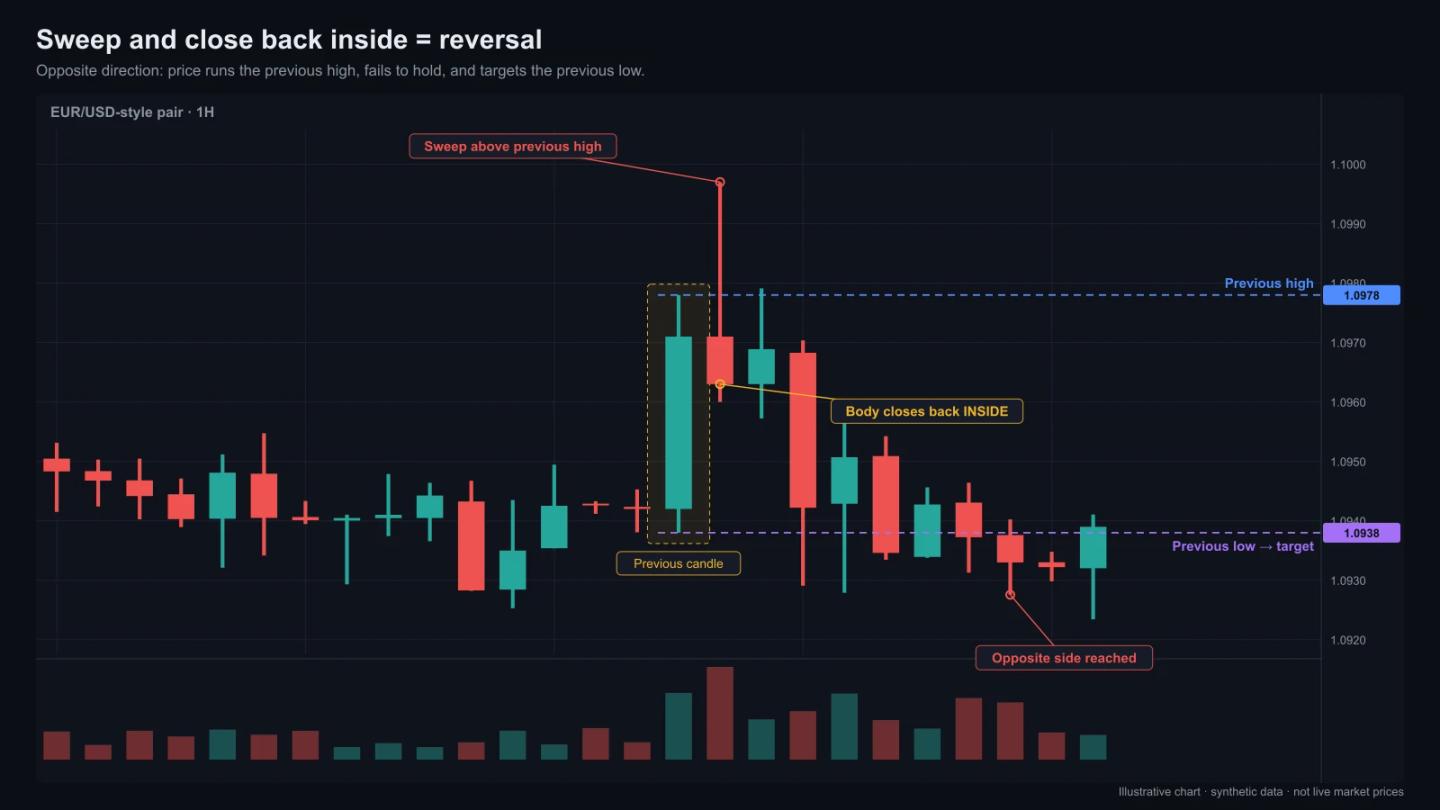
Opposite direction: sweep and close back inside, so expect a reversal
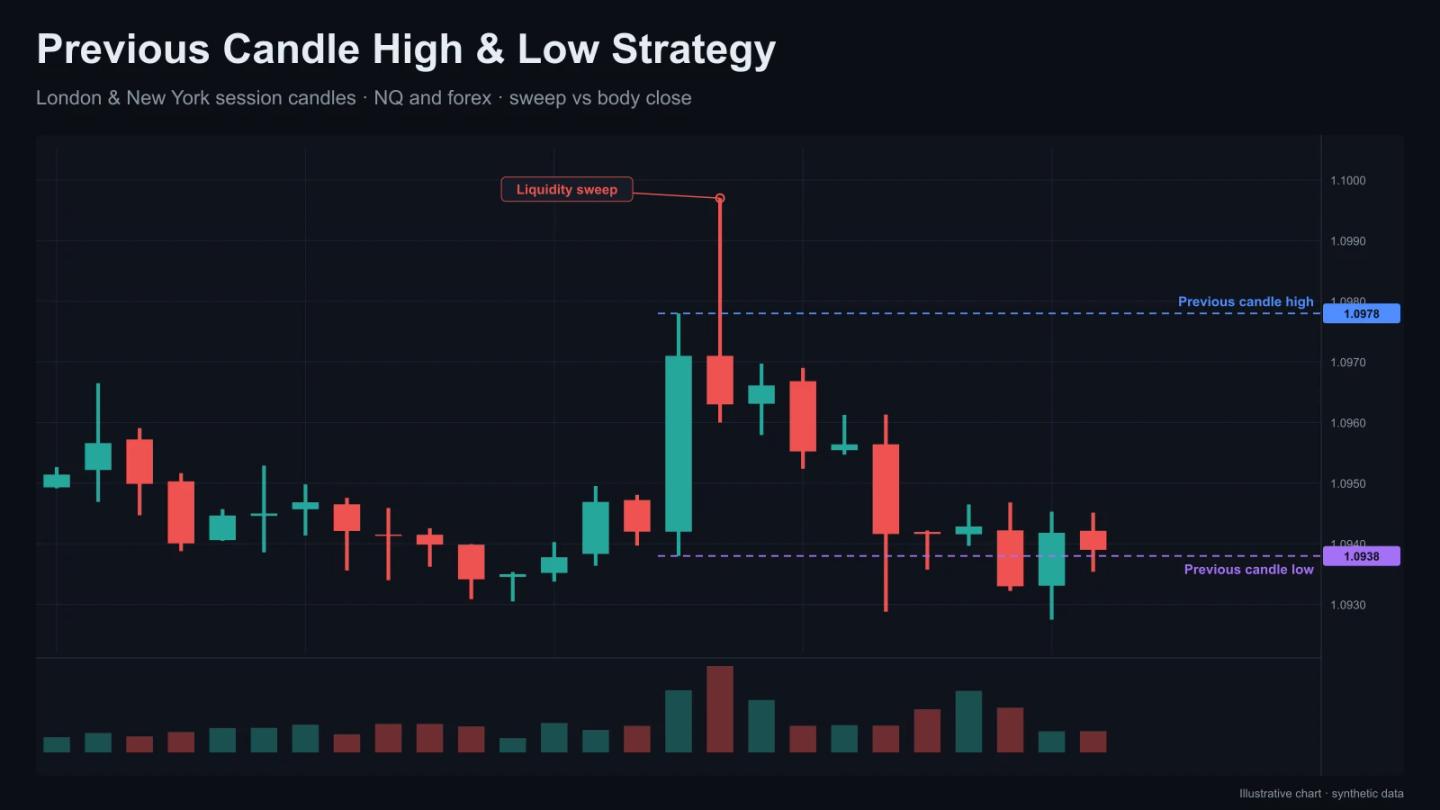
Now suppose the next candle trades above the previous high but closes its body back below it, often leaving a long upper wick. The move above the high triggered stop orders and breakout buys, then failed. That’s a liquidity sweep, and the bias flips to the opposite side. The natural target becomes the other end of the previous candle’s range, its low.
In the creator’s words, the previous candle is “used to sweep”. The sweep tells you who got trapped, and the close tells you which way the next move is likely to go.
No interaction, no trade
If the next candle stays inside the previous range without touching either extreme, there’s no bias yet. Waiting is part of the strategy.
Using the 4-hour candle as the bigger filter
The source video walks through an example around the 2:30 PM IST 4-hour candle near the London session. When that 4-hour candle gives a bullish bias, the 1-hour candles that follow are traded only in the same direction. Shorts against that bias are ignored. The 4-hour candle sets the day’s direction, and the 1-hour session candles give the timing.
Real Prices: Closes Beyond and Sweeps on NQ
The walkthrough in this article is hypothetical. The chart below shows the core rule on real NASDAQ 100 futures hourly candles from 12 to 14 November 2026: two closes beyond the previous candle with opposite results, and a sweep-and-return at the US open followed by a sharp fall.
Real prices: closes beyond and sweeps of the previous candle on NASDAQ 100 futures, 12–14 November 2026
Step 1 of 4
A close beyond: continuation
On 12 November 2026 the 19:30 IST candle closes at 28,359, above the previous candle's high of 28,242.5. The next candle extends to 28,542: continuation, as this article's core rule expects.
- What to observe
- Close beyond the previous high: bias continues.
- Condition
- One example of the rule working.
From Bias to Entry: The 1H → 15M → 1M Stack
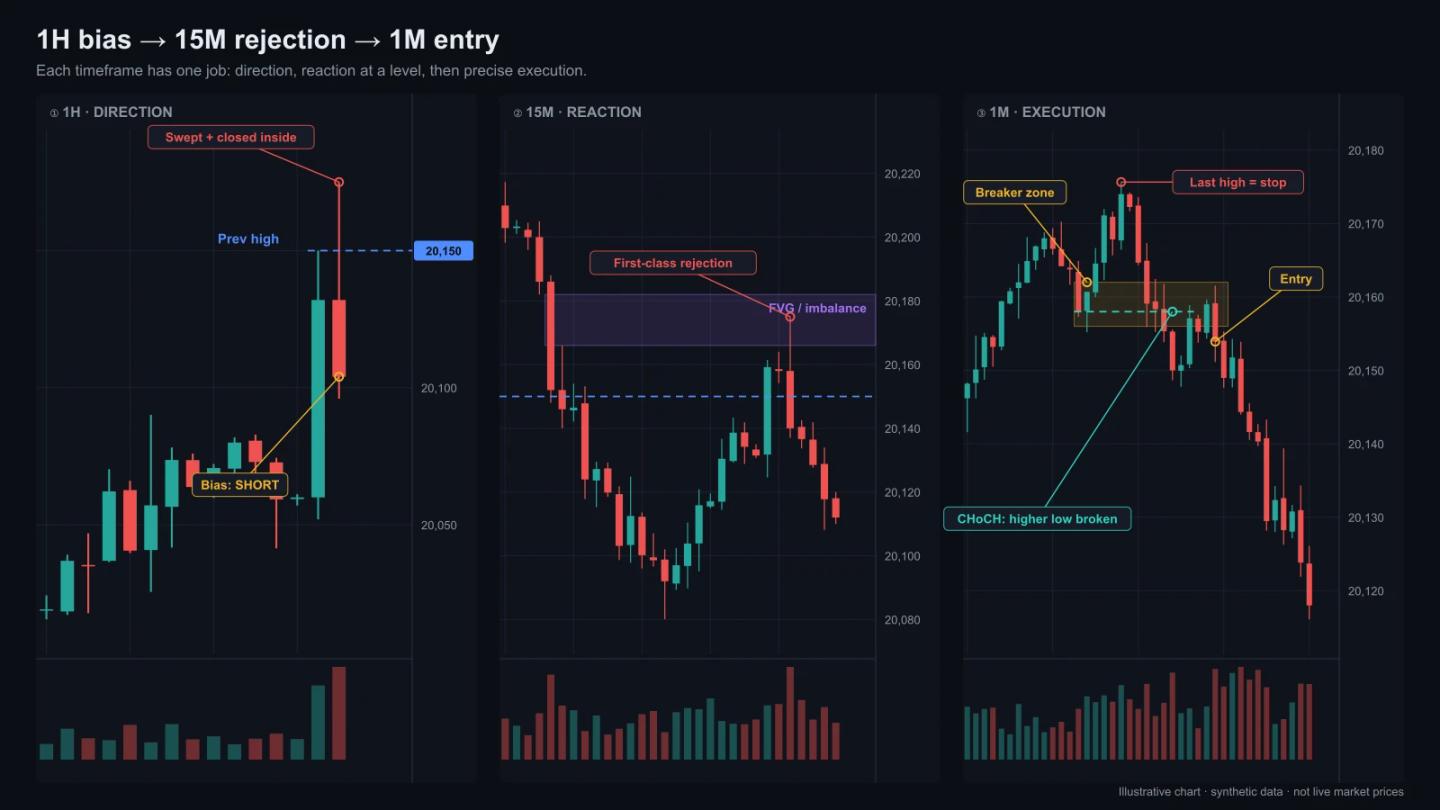
A bias tells you which direction to trade. It doesn’t tell you where to enter. The model drills down through three timeframes, and each one has a specific job.
Step 1: 1-hour (or 4-hour) bias
Apply the close-or-sweep rule to the session candle. Write the bias down before the next candle opens, so the decision is made while you’re calm.
Step 2: a “first-class” 15-minute rejection
Next, wait for price to reach a meaningful area on the 15-minute chart. That might be a key level or a fair value gap (FVG), also called an imbalance. That’s a three-candle pattern where price moved so fast that the wicks of the first and third candles don’t overlap, leaving a gap that price often comes back to. You want a clean, sharp rejection from that area in the direction of your bias. A slow, overlapping drift into the level is weaker. A strong reaction suggests real orders are defending it.
The source also points to timing. Give a new 1-hour candle roughly 15–20 minutes to show its hand before acting. The early minutes of a candle are often where the sweep happens.
Step 3: 1-minute (or 5-minute) execution
Once the 15-minute rejection appears, drop to the 1-minute chart and look for a change of character (CHoCH). That’s the first break of the short-term structure in your direction. In a bearish setup, price stops making higher lows and breaks below the most recent higher low.
The entry comes from the breaker, the level created by that structure shift. The creator notes that the breaker can also be the candle’s open price. The stop goes beyond the sweep or rejection extreme. The target is the opposite side of the previous candle, or the next key level.
This stack keeps the risk small. The stop sits on a 1-minute structure, while the target comes from a 1-hour candle’s range. That gap is where favourable reward-to-risk ratios come from. For a closely related entry model, see our 15-minute liquidity sweep with 1-minute entry guide.
SMT Divergence: The Confirmation Filter for NQ
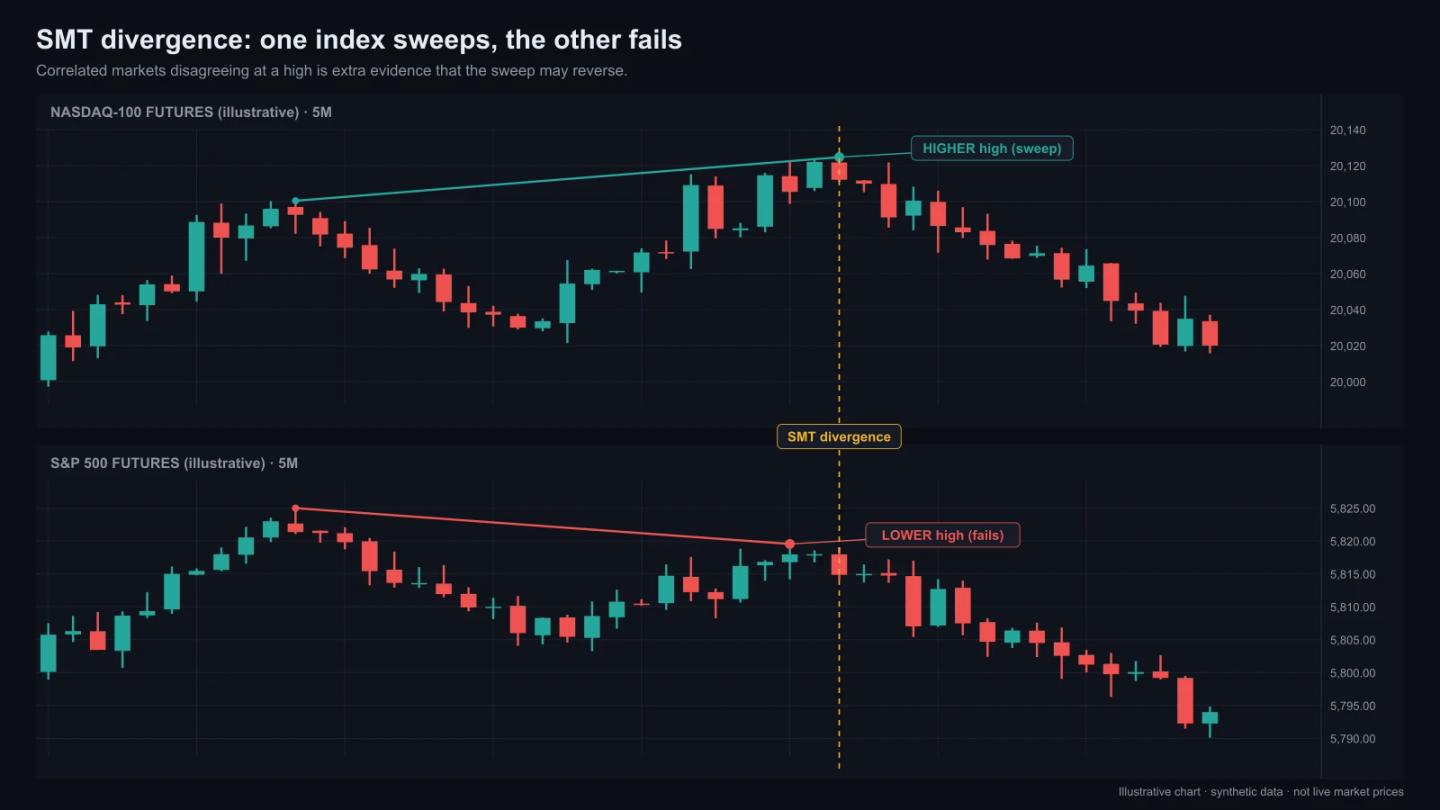
For index traders, the method adds one more filter: SMT divergence. NQ (Nasdaq-100 futures) and ES (S&P 500 futures) usually move together. Sometimes one of them sweeps a previous high while the other fails to make a new high. That disagreement suggests the move up isn’t backed by broad buying, and it often comes before a reversal. The same works at lows.
In this model, SMT divergence isn’t a signal on its own. It adds clarity to a sweep that’s already happening at your key level. When the previous-candle sweep, the 15-minute rejection and an NQ/ES divergence all line up, the setup is about as clean as this method gets.
A Hypothetical NQ Walkthrough
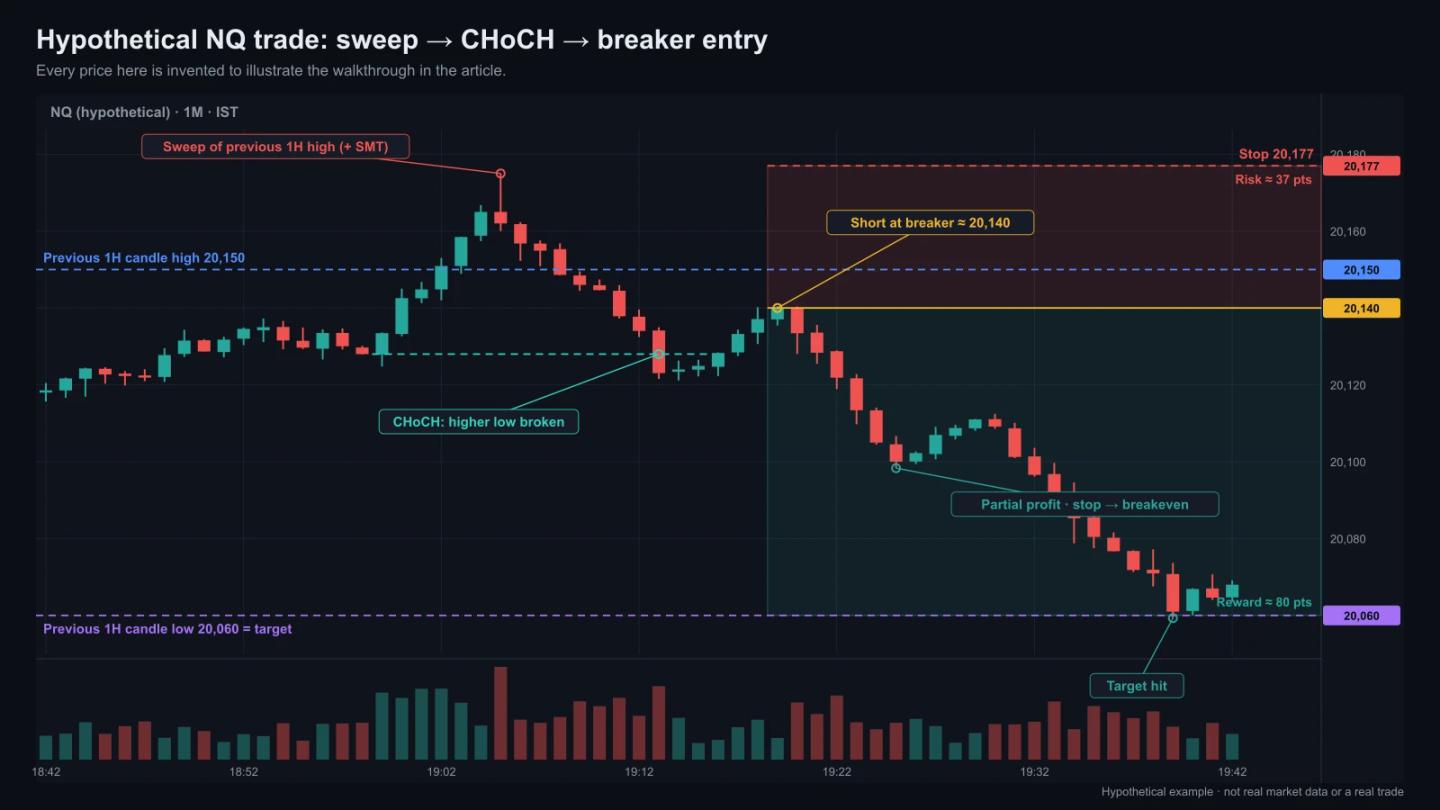
It’s summer. Before the session, you mark the previous day’s high on NQ as the key level. The 6:30 PM IST 1-hour candle closes with a high of 20,150 and a low of 20,060.
At about 7:05 PM IST, just after the cash open, NQ spikes to 20,175, above that high. ES doesn’t make a new high at the same time, which is SMT divergence. The 15-minute candle rejects sharply from a small fair value gap just under the previous day’s high. It leaves a long upper wick and closes back below 20,150.
The bias is now bearish, because the high was swept and the price closed back inside. On the 1-minute chart, price breaks the last higher low (a change of character), then comes back up to the breaker. The short entry is around 20,140, with a stop at about 20,177, just above the sweep high, and a target at 20,060, the previous candle’s low. That’s about 37 points of risk for 80 points of reward.
Part way down, the trader takes partial profit and moves the stop to breakeven. If a high-impact news release is due before the target, they close more of the position rather than hold it through the release.
Managing the Trade After Entry
The source is clear that how you manage the trade matters as much as the entry.
Take partial profit and move to breakeven. Once price has moved a meaningful distance in your favour, close part of the position and move the stop to your entry. Your remaining risk drops to roughly zero (a gap or slippage through the stop is still possible), and that removes most of the fear that causes early exits.
Respect the news calendar. Scheduled releases can wipe out a clean technical setup in seconds. If you’re in profit ahead of a major release, reduce or close.
Size from the stop. Decide what one trade may cost you (many intraday traders use 0.5–1% of the account). Then calculate the contract size from the distance between entry and stop. NQ moves quickly. The Micro E-mini (MNQ) is a tenth of the size and usually more appropriate while you learn.
The Psychology Behind Executing With Confidence
Much of the source video is about the fear that freezes traders at the moment of entry. The argument is practical. Fear doesn’t go away because you’re told to be brave. It goes away when you’ve seen the same setup work, and fail, enough times that one trade no longer feels like a verdict on you.
That’s why the method insists on backtesting before going live. Mark past session candles, apply the close-or-sweep rule, and record what the 15-minute and 1-minute charts did next. Then practise in real time with small size. Each stage builds the evidence that makes the next decision easier.
The video also draws a clear line: trading is a business and a skill. Taking random entries without a plan is gambling, whatever the chart says. A written rule, tested on past data and applied the same way every session, is what turns one into the other. More on this in the 5 psychological enemies destroying your trades.
How Reliable Is the Previous Candle on Its Own? Our Test
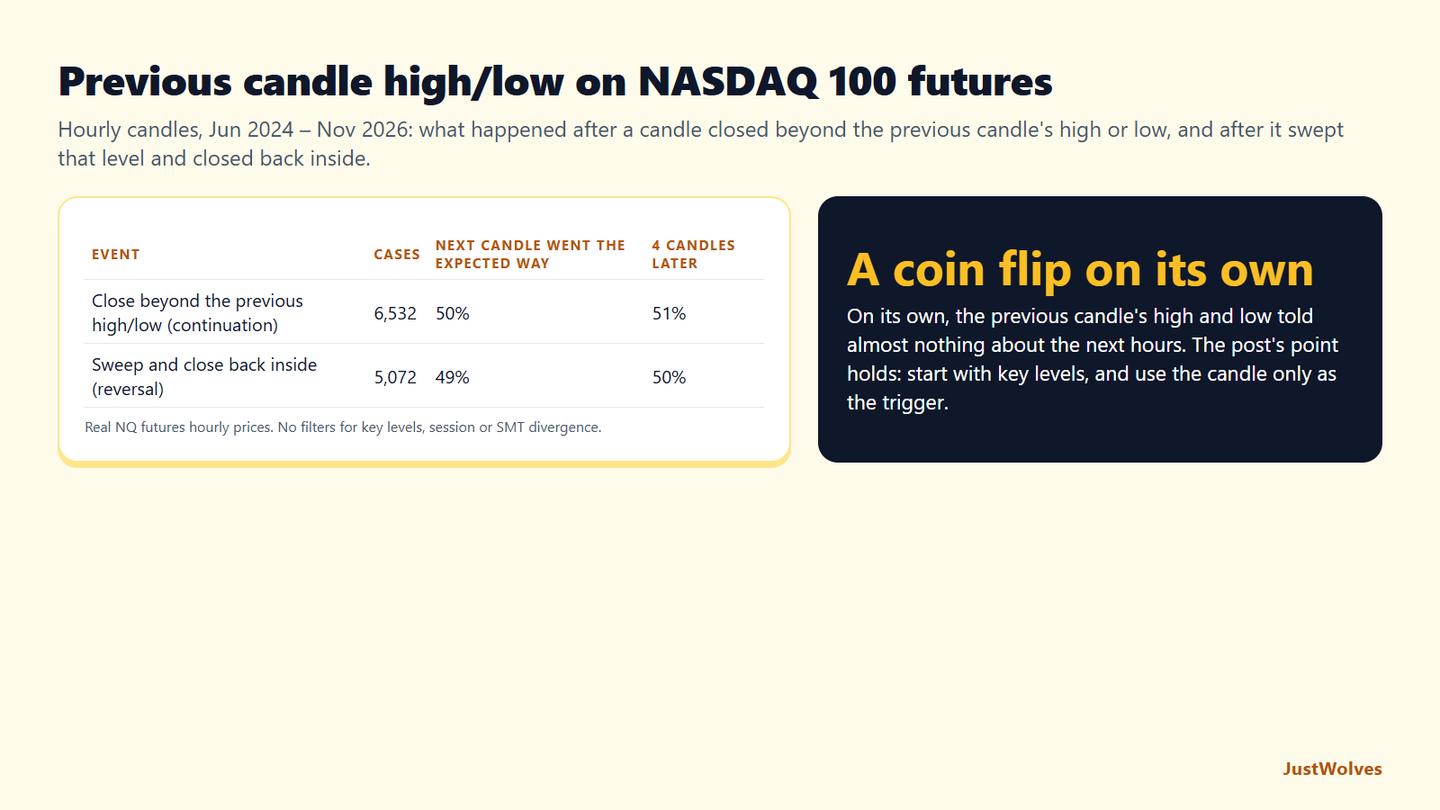
This article treats the previous candle's high and low as triggers that only matter at key levels. JustWolves tested what the candle tells you without any key level: on real NASDAQ 100 futures hourly candles from June 2024 to November 2026, we recorded every close beyond the previous candle's high or low (which the core rule reads as continuation) and every sweep of that high or low that closed back inside (read as reversal), and checked the next candle and the next four.
| Event | Cases | Next candle went the expected way | 4 candles later |
|---|---|---|---|
| Close beyond the previous high/low (continuation) | 6,532 | 50% | 51% |
| Sweep and close back inside (reversal) | 5,072 | 49% | 50% |
On its own, the previous candle was a coin flip. Across more than 11,000 hourly candles, a close beyond the previous high or low was followed by continuation half the time, and a sweep-and-return by a reversal half the time. Neither pattern carried information by itself.
That supports the order of this article. It starts with key levels, then session candles, then the 1H to 15M to 1M stack, and only then the candle trigger. Our test removed everything except the trigger, and the trigger alone did nothing. Whatever edge this method has must come from where the candle forms, and from the confirmation filters such as SMT divergence.
Test the full stack, not the pieces. The most useful next step is to record the setups that meet every condition in this article, at real key levels, and measure them over many weeks.
Common Mistakes With This Strategy
Marking the wrong candle. If you ignore daylight saving changes or your broker’s server time, every level after that is built on the wrong range.
Reading wicks as closes. The rule depends on where the body closes. A wick through a high isn’t a breakout.
Skipping the 15-minute rejection. Going straight from a 1-hour bias to a 1-minute entry removes the filter that confirms a level is actually being defended.
Trading against the 4-hour bias because a 1-minute pattern looks attractive.
Holding full size through news when partial profits and a breakeven stop would have protected the trade.
Going live without backtesting, then blaming the method for what was really a lack of practice.
Key Takeaways
- Trade only the timed London and New York session candles, and check their IST times after every daylight-saving change.
- Body close beyond the previous high or low means continuation. A sweep followed by a close back inside means reversal toward the other side.
- Use the 1H or 4H for bias, the 15M for a clean rejection at a key level or FVG, and the 1M for a CHoCH and breaker entry.
- On NQ, SMT divergence with ES adds confirmation to a sweep.
- Take partial profit, move to breakeven, respect the news calendar, and backtest before going live.
Frequently Asked Questions
What is the previous candle high and low strategy?
It’s a price-action method where you watch how a session candle interacts with the previous candle’s high and low. A body close beyond the level points to continuation. A sweep followed by a close back inside points to a reversal towards the other side of the range.
What is the difference between a sweep and a breakout?
In both cases price trades beyond the previous high or low. In a breakout, the candle body closes beyond the level and holds. In a sweep, price pokes through, triggers resting orders, and the body closes back inside the previous range.
What time should I trade NQ from India?
Focus on the New York AM session. The US cash open at 9:30 AM New York time is 7:00 PM IST in summer and 8:00 PM IST in winter. On a GMT+2/+3 broker chart, the 1-hour candle containing it opens at 6:30 PM or 7:30 PM IST.
Which timeframes does this model use?
The 1-hour or 4-hour session candle sets the bias. The 15-minute chart shows the rejection at a key level or fair value gap. The 1-minute or 5-minute chart is used for the change-of-character entry from a breaker.
What is SMT divergence?
It’s a disagreement between correlated markets such as NQ and ES. One sweeps a high or low and the other doesn’t. It suggests the move lacks broad participation and is used as extra confirmation for reversal setups.
Does this strategy work for forex as well as indices?
The logic applies to both. Forex pairs use the London and New York session candles at 8:00 AM local time. Indices are timed around the 9:30 AM New York cash open, which is why the timings are listed separately.
How long should I backtest before trading it live?
There’s no fixed number. Keep going until you’ve recorded enough session examples, typically dozens across different market conditions, to know how often each scenario plays out on your instrument. Then trade small before you scale up.
Does a close above the previous candle high mean price will continue?
Not on its own. On two years of real NASDAQ 100 futures hourly candles, the next candle continued in that direction 50% of the time. The signal matters only at meaningful key levels and with other confirmation.
Conclusion
Hesitation at the moment of entry usually comes from a plan that isn’t specific enough, not from a lack of skill. The previous candle high and low strategy breaks the decision into small, objective steps. Mark the right session candle. Check whether the next candle closes beyond the previous high or low or sweeps it. Wait for a clean 15-minute rejection. Enter on a 1-minute change of character, with SMT divergence as extra confirmation on NQ.
None of these steps needs a prediction. Each one asks you to observe something specific and act on it. Backtest the sequence, manage open trades with partial profits and breakeven stops, and keep the size small until the results are proven. With practice, the trades you used to only watch become trades you’re able to take.
Topics