Asian Session Liquidity: How London and New York Take the Asian High and Low
JustWolves is an educational platform and is not a SEBI-registered investment advisor. Trading financial instruments involves significant risk of loss and may not be suitable for all investors. Past performance is not indicative of future results. Read our full disclaimer →
What you'll learn
- Orders build up in quiet hours and get filled when busy sessions start.
- In 119 days of gold data, the day's high or low formed most often in the New York morning (08:00–11:00) and in the first hours of the trading day (18:00–21:00 New York).
- The classic kill zones held the day's extremes no more often than the clock would suggest in this sample.
- The Asian range was usually first broken before London opened.
- The first break of the Asian range was real on 61% of days and an early fake move on 11%.
In this article · 12 sections
Asian session liquidity, the stops resting above the Asian high and below the Asian low, shows how trading sessions and liquidity are linked: orders build up while a market is quiet and get filled when it becomes busy. This lesson uses 119 trading days of real gold data from MetaTrader 5 (MT5), June to November 2026, to show when the day's high and low actually formed, when the Asian range was first broken, how often that first break turned out to be a fake move (the "Judas swing"), and what the popular kill zones looked like in the data. Two real days show a fake early move and a real one.
What you will learn
- The sessions we use, in New York and India time
- Why time matters for liquidity
- When gold made the day's high and low
- Kill zones: what the data shows
- When the Asian range gets broken
- The early fake move (Judas swing): how often it really happened
- Real days: a fake early move and a real one
- How to use time, common mistakes, FAQ and quiz
1. The sessions we use
This course uses the same session times you met in Lesson 1. All times are New York time, because the gold trading day starts and ends at 17:00 New York. India times are for US summer time (add one hour in US winter).
| Session | New York time | India time (US summer) | What usually happens |
|---|---|---|---|
| Start of the trading day | 17:00–19:00 | 02:30–04:30 | A new day opens, often with a short burst of activity |
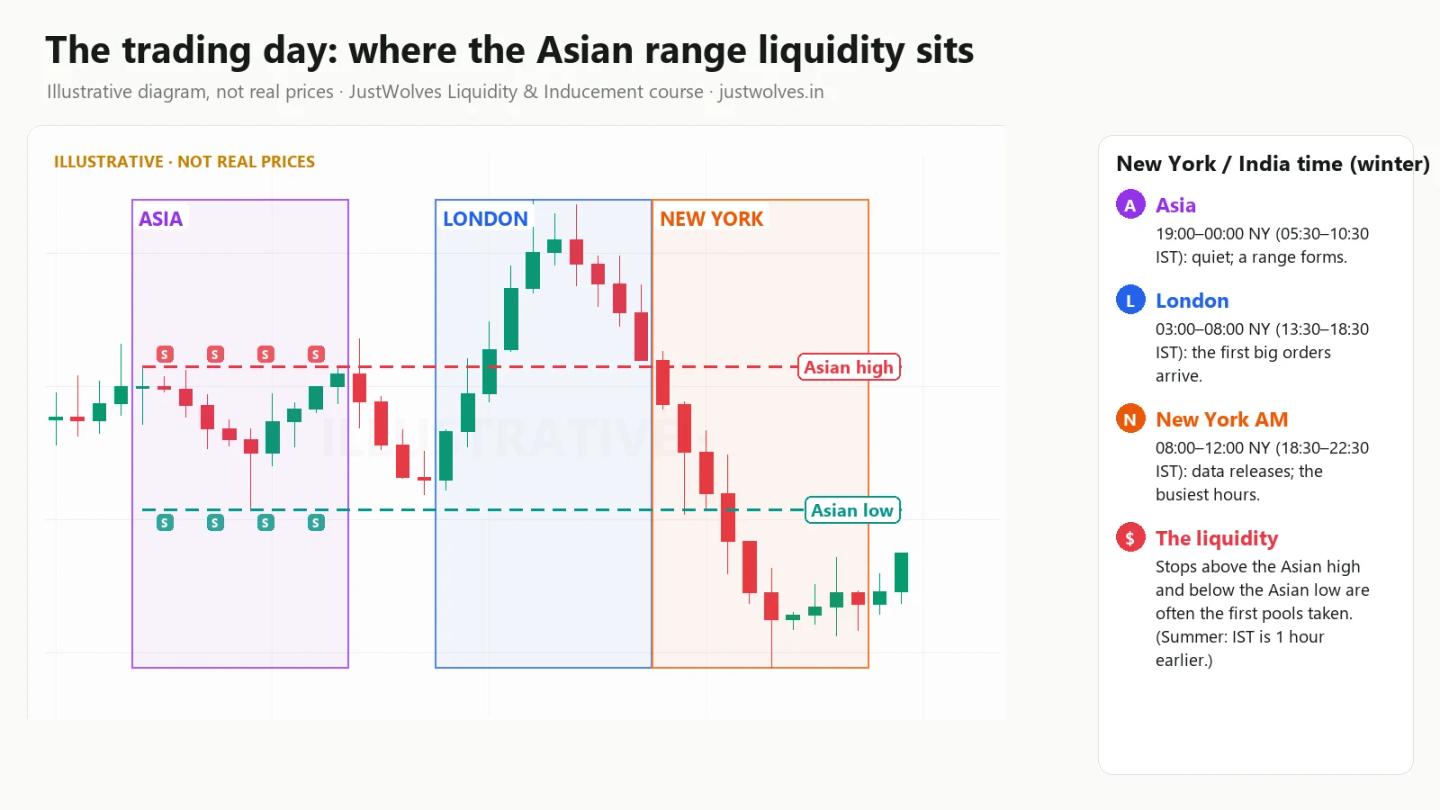
| Asia | 19:00–00:00 | 04:30–09:30 | Usually the quietest session; builds the Asian range |
| Pre-London | 00:00–03:00 | 09:30–12:30 | European traders start arriving |
| London | 03:00–08:00 | 12:30–17:30 | Volume rises; London traders react to the Asian range |
| New York morning | 08:00–12:00 | 17:30–21:30 | US data releases and the US stock market open |
| New York afternoon | 12:00–17:00 | 21:30–02:30 | Activity usually fades towards the 17:00 close |
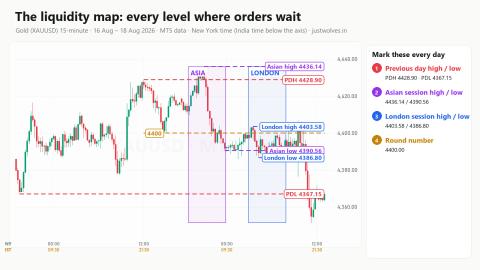
The Asian range is the high and low of the Asian session. Its high holds buy-side liquidity and its low holds sell-side liquidity, as in Lesson 1, section 4.5. For more on sessions in general, see our forex trading sessions lesson.
2. Why time matters for liquidity
Liquidity, as you know from Lesson 1, is orders waiting to be filled. Two things about it depend on the clock:
- When orders build up. In quiet hours, price moves in a small range and traders keep placing stops and breakout orders just beyond it. The longer the quiet range lasts, the more orders gather around its edges.
- When orders get filled. Orders fill when enough traders are active to push price through those levels: around session opens and scheduled news.
So the same level can sit untouched for hours and then be taken in minutes once a busy session starts. Knowing when price is likely to move helps you decide when to pay attention and when to step back.
3. When gold made the day's high and low
We recorded the hour in which gold made its high and its low on each of 119 trading days, from 1 June to 17 November 2026. That gives 238 day extremes.
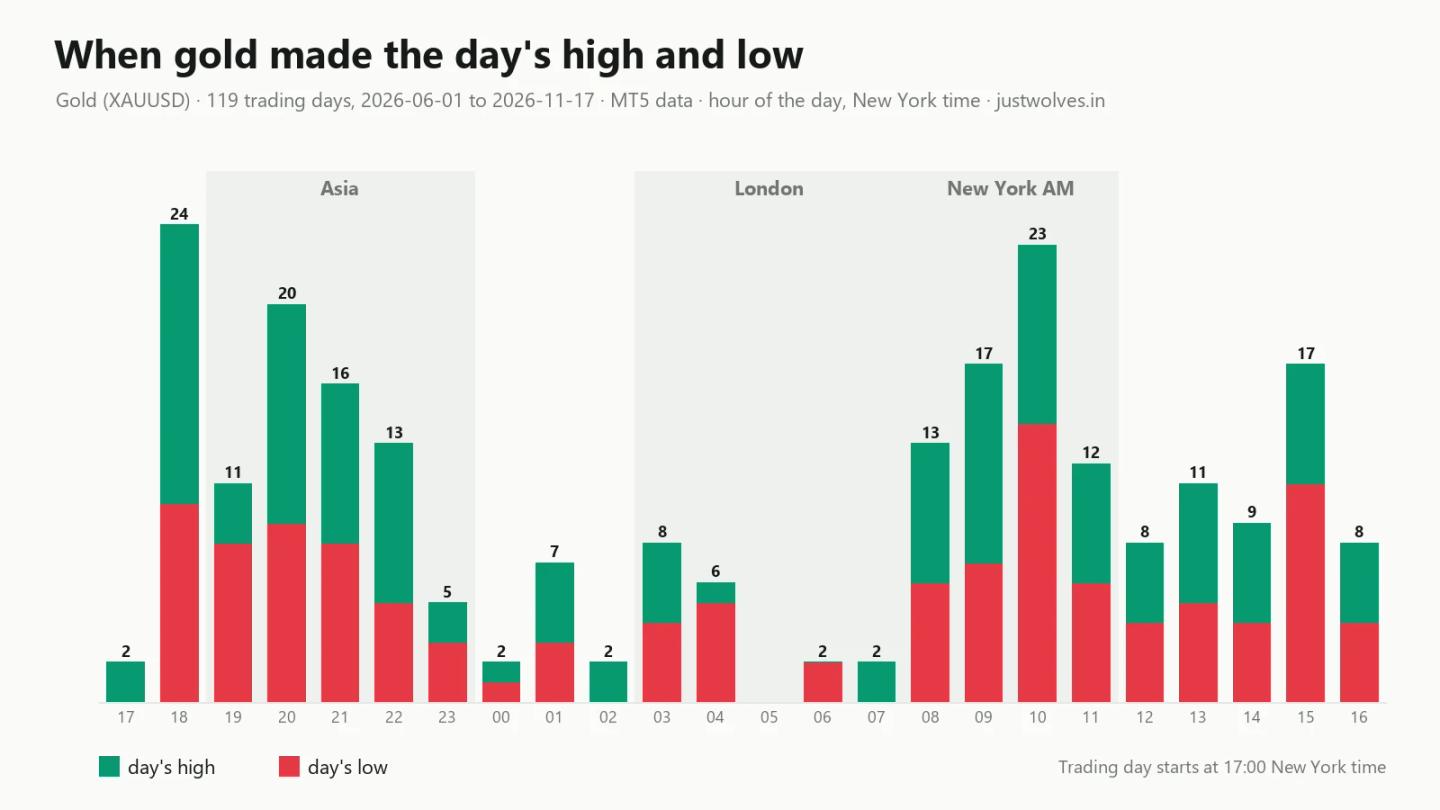
What stands out:
- The New York morning. From 08:00 to 10:59 New York time (17:30 to 20:29 in India in US summer), 53 of the 238 day extremes formed: about 22% of them in just three hours, or one-eighth of the clock. The single busiest hour was 10:00, with 23.
- The start of the trading day. From 18:00 to 20:59, 55 extremes formed, about 23%. Part of this is simply that a new day starts at 17:00: the first hours of any day often set one of its extremes.
- London was quiet for extremes. From 03:00 to 07:59, only 18 extremes formed, about 8%, even though that is five hours of the clock.
This does not mean London does not move gold. It means that, in this sample, London usually traded inside the day's eventual range, and the high or low of the day was more often set in the evening start or in the New York morning.
4. Kill zone trading: what the data shows
Kill zones are time windows that many traders, especially those following ICT methods, treat as the best times to trade. The most common are the London kill zone, 02:00 to 05:00 New York time, and the New York kill zone, 07:00 to 10:00. See our ICT kill zones lesson for the full idea.
Together those two windows cover 6 of the 24 hours, which is 25% of the clock. In our 119 days:
- the day's high formed inside a kill zone on 26 days (22%);
- the day's low formed inside a kill zone on 22 days (18%).
So for gold in this sample, the day's extremes formed inside the classic kill zones no more often than the clock alone would suggest. The New York window from 08:00 to 11:00, which overlaps the end of the New York kill zone, did stand out; the London kill zone did not.
5. Asian session liquidity sweeps: when the Asian range gets broken
On 116 of the 119 days, price went past the Asian high or the Asian low (or both) before the day was over. On 3 days it stayed inside. On 34 days, both sides were taken.
When was the first side taken?
| First break of the Asian range | Days |
|---|---|
| Pre-London (00:00–03:00 New York) | 83 |
| London (03:00–08:00) | 20 |
| New York morning (08:00–12:00) | 10 |
| New York afternoon (12:00–17:00) | 3 |
On most days, the Asian range was first broken before London even opened, usually in the pre-London hours from midnight to 03:00 New York time (09:30 to 12:30 in India in US summer). If you wait for the London open to watch the Asian range, on most days the first break has already happened.
6. The early fake move (Judas swing): how often it really happened
The early fake move, often called the Judas swing, is a popular idea: early in the day, price runs one way and takes the liquidity on one side of the Asian range, then reverses and makes the real move of the day in the other direction. Our Judas swing lesson explains the original idea.
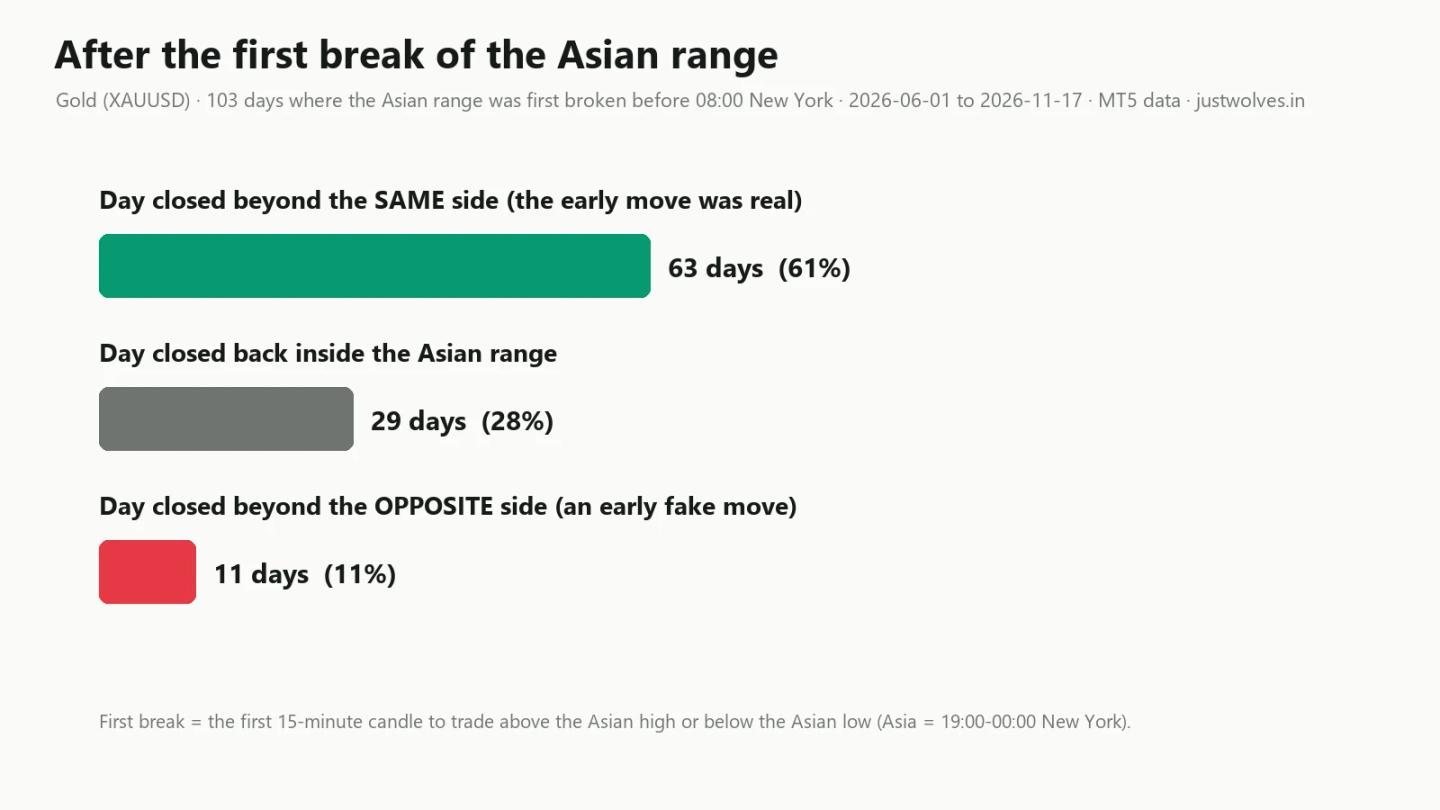
We tested it on every day where the Asian range was first broken before 08:00 New York time: 103 days. We then looked at where the day closed at 17:00.
| Where the day closed | Days | Share |
|---|---|---|
| Beyond the same side as the first break (the early move was real) | 63 | 61% |
| Back inside the Asian range | 29 | 28% |
| Beyond the opposite side (an early fake move) | 11 | 11% |
In this sample, the first break of the Asian range was more often real than fake. The full fake move, where the day closes beyond the other side, happened on about one day in nine.
We also checked whether the close of the first-break candle helps. When that 15-minute candle closed back inside the Asian range, the day still closed beyond the same side 58% of the time and beyond the opposite side 12% of the time. When it closed beyond, those numbers were 65% and 10%. One candle's close helps you judge the next few hours, as you saw in Lessons 1 and 2, but it was not enough to forecast the whole day.
7. Real days: a fake early move and a real one
7.1 The early fake move: Tuesday 8 September 2026
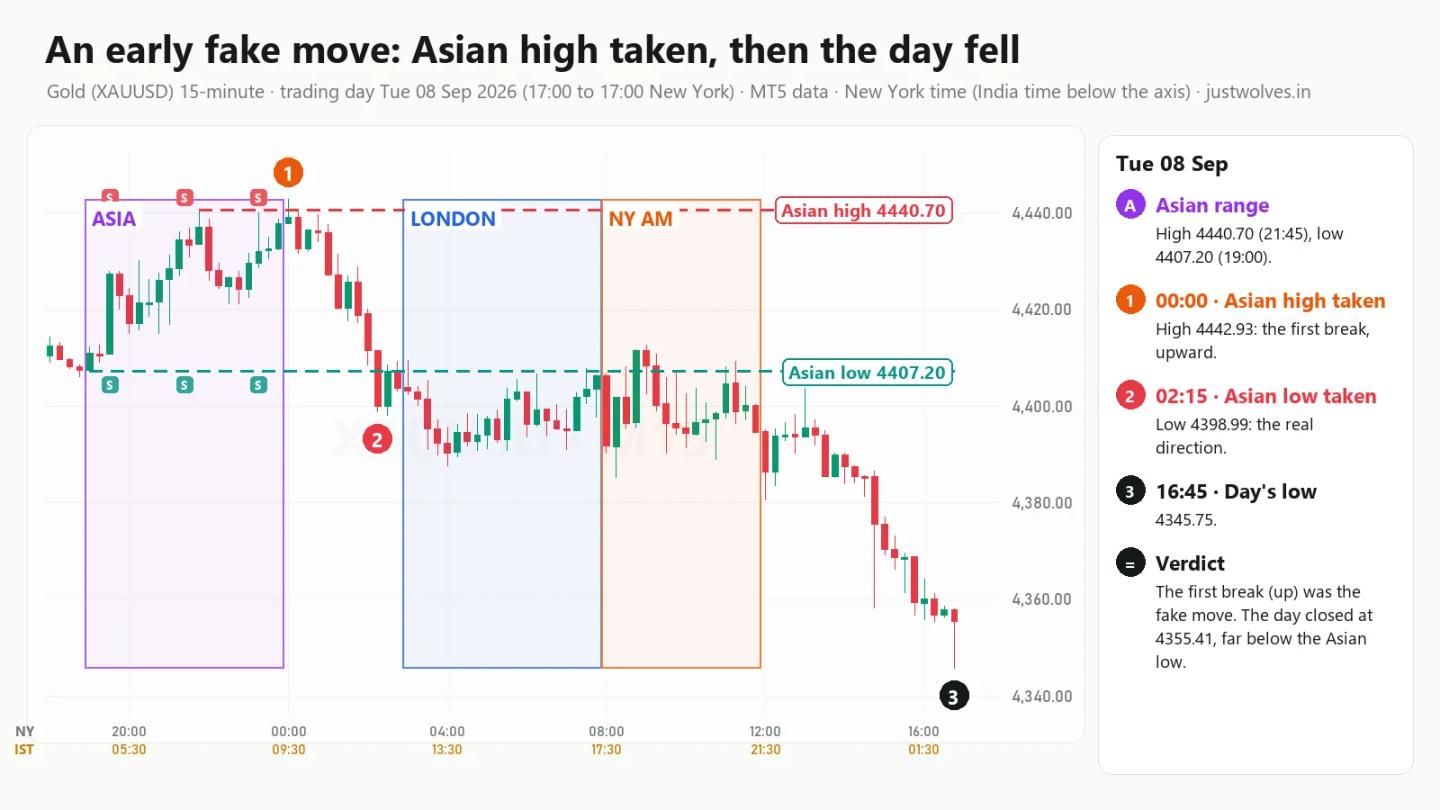
You have seen the start of this day before: it is the Asian-high example in Lesson 1, section 4.5.
- The Asian range. From 19:00 to 00:00 New York time on 7 September, gold traded between 4407.20 and 4440.70.
- The first break. At 00:00 a candle traded up to 4442.93, above the Asian high, and closed back below it. That high turned out to be the high of the whole day.
- The other side. At 02:15 price traded below the Asian low of 4407.20.
- The day. Gold kept falling into the New York afternoon, reaching its low of 4345.75 at 16:45, and closed at 4355.41, more than $51 below the Asian low.
This is the textbook early fake move: buy-side liquidity above the Asian high was taken first, and the real move of the day went the other way. It is also one of only 11 such days in our sample.
7.2 An early move that was real: Wednesday 24 June 2026
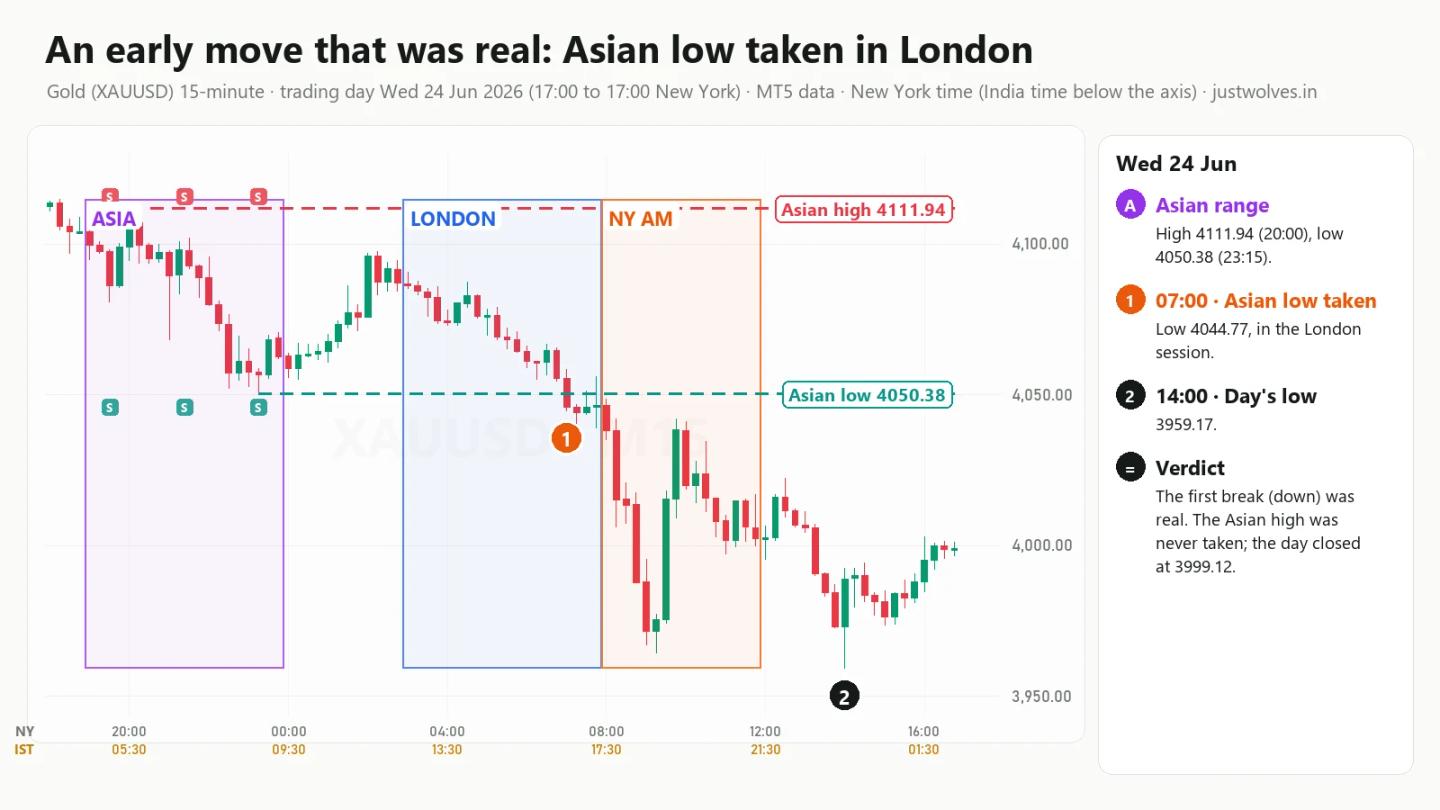
- The Asian range. Between 4050.38 and 4111.94.
- The first break. At 07:00 New York time, during London, price traded below the Asian low, taking the sell-side liquidity there.
- The day. Price never returned above the Asian high. It fell to the day's low of 3959.17 at 14:00 and closed at 3999.12, more than $51 below the Asian low.
Anyone who assumed the early break below the Asian low must be a fake move, and bought it, was on the wrong side all day. In our sample, this kind of day was far more common than the fake move.
8. How to use time
- Mark the Asian range every day: the high and low from 19:00 to 00:00 New York time.
- Expect the first break early. On most days in our sample it came before 03:00 New York time.
- Do not assume the first break is fake. In 103 days it was real 61% of the time and fake 11% of the time.
- Pay most attention in the New York morning. From 08:00 to 11:00 New York time (17:30 to 20:30 in India in US summer), gold set the day's high or low far more often than the clock alone would suggest.
- Check the economic calendar. Many New York morning moves start with scheduled US data.
- Combine time with the map. Time tells you when liquidity is likely to be taken; Lessons 1 to 4 tell you where it sits and what to watch afterwards.
Common mistakes with trading sessions and liquidity
- Treating the Judas swing as the default. In our sample the early fake move was the exception, not the rule.
- Waiting for the London open to watch the Asian range. On 83 of 116 days, the first break came before London.
- Trusting kill zones blindly. In this sample the day's extremes formed inside the classic kill zones no more often than the clock would suggest.
- Ignoring the New York morning. It was the busiest time for day extremes.
- Forgetting India time changes. When the US moves between summer and winter time, every session moves by one hour in India time.
Homework
For the next five trading days, write down the Asian range high and low, the time of the first break and which side it took, and where the day closed at 17:00 New York time. Compare your five days with the tables in sections 5 and 6.
Practise on the live gold chart
● LiveFrequently Asked Questions
Which trading session is best for gold?
In our 119-day sample, gold set the day's high or low most often in the New York morning, from 08:00 to 11:00 New York time (17:30 to 20:30 in India in US summer). That is when liquidity was most often taken.
What is the Judas swing?
An early move that takes liquidity on one side of the Asian range and then reverses, with the day closing on the other side. In our data it happened on 11 of 103 days where the Asian range was broken before 08:00 New York time.
Do ICT kill zones work for gold?
In this sample, the day's high and low formed inside the London and New York kill zones no more often than the hours alone would suggest. The 08:00 to 11:00 New York window did stand out.
When is the Asian range usually broken?
On 83 of 116 days in our sample, the first break came between midnight and 03:00 New York time, before London opened.
What time is the New York session in India?
The New York morning, 08:00 to 12:00 New York time, is 17:30 to 21:30 in India during US summer time and 18:30 to 22:30 during US winter time.
Test Your Knowledge
When did gold most often set the day's high or low in our sample?
Related lessons
Education only. Not investment advice or a recommendation to trade. JustWolves is not a SEBI-registered adviser. Charts and statistics use historical MT5 chart data for gold from 1 June to 17 November 2026; they describe past behaviour in one market and period and are not a forecast or a record of real trades. Trading forex and commodities involves substantial risk of loss.