Liquidity Block and Inducement Trap: Early Buyers, Early Sellers and How to Mark Them
JustWolves is an educational platform and is not a SEBI-registered investment advisor. Trading financial instruments involves significant risk of loss and may not be suitable for all investors. Past performance is not indicative of future results. Read our full disclaimer →
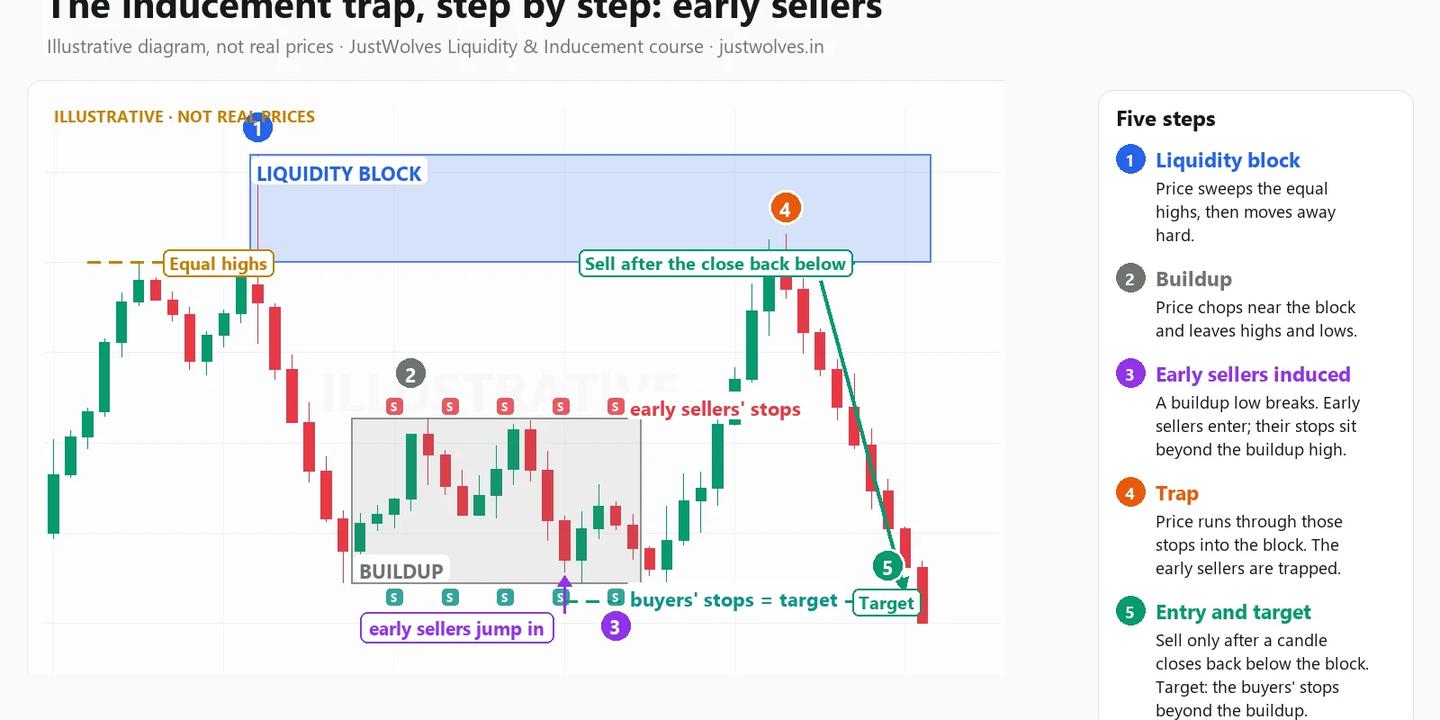
What you'll learn
- A liquidity block is the zone left by a sweep of stops followed by a sharp move away. No sweep, no block.
- Early buyers and early sellers enter on obvious signals with obvious stops. Those stops are the inducement.
- They appear in four places: range breakouts, first pullbacks, breakdowns inside a buildup, and retests of broken levels.
- For a sell from a block above, look for early sellers below it; for a buy from a block below, early buyers above it. Their stops are the fuel; the other side's stops are the target.
- Mark the block, the buildup, the early swing, the inducement, the fuel and the target, then wait for a close back out of the block.
- On five months of gold, the confirmed version produced 13 trades: 5 winners and 8 losers. Rare, risky, and worth testing before trusting.
In this article · 13 sections
A liquidity block is the zone where price swept a pool of stops and then moved away hard. It matters because of what usually happens next: price drifts back towards it, and on the way some traders jump in too early. Those early buyers and early sellers, and the stops they leave behind, are the inducement trap. This lesson explains who early traders are and why they enter early, the four places they come from, which side you need to see induced for a buy or a sell, how to mark and check an inducement on your own chart, and what happened on real gold (XAUUSD) charts from MetaTrader 5 (MT5), including one trade that failed and the full results from five months of data.
What you will learn
- What a liquidity block is
- Early buyers and early sellers: who they are and why they enter early
- Where early traders come from: four scenarios
- Which side must be induced for a buy, and which for a sell
- The inducement trap, step by step
- How to mark inducement on your chart
- How to check an inducement: valid or skip
- Three real charts: a sell, a buy, and a failure
- What five months of gold data say
- Common mistakes, FAQ and quiz
1. What a liquidity block is
You already know from Lesson 1 that stops pool above highs and below lows. A liquidity block is what is left behind after one of those pools is used.
It forms in three steps:
- A pool of liquidity. For example equal highs, with buy stops resting above them.
- The sweep. One candle runs through the highs, fills those buy orders, and closes back below.
- A sharp move away. Price falls hard, by much more than the height of the spike. In our rules, the drop must be at least twice the height of the spike.
The zone from the swept high to the top of the spike is the liquidity block. Somebody sold in size into those buy stops, and the sharp drop that followed shows they were in control. When price returns to that zone later, it is the area where those sellers acted before.
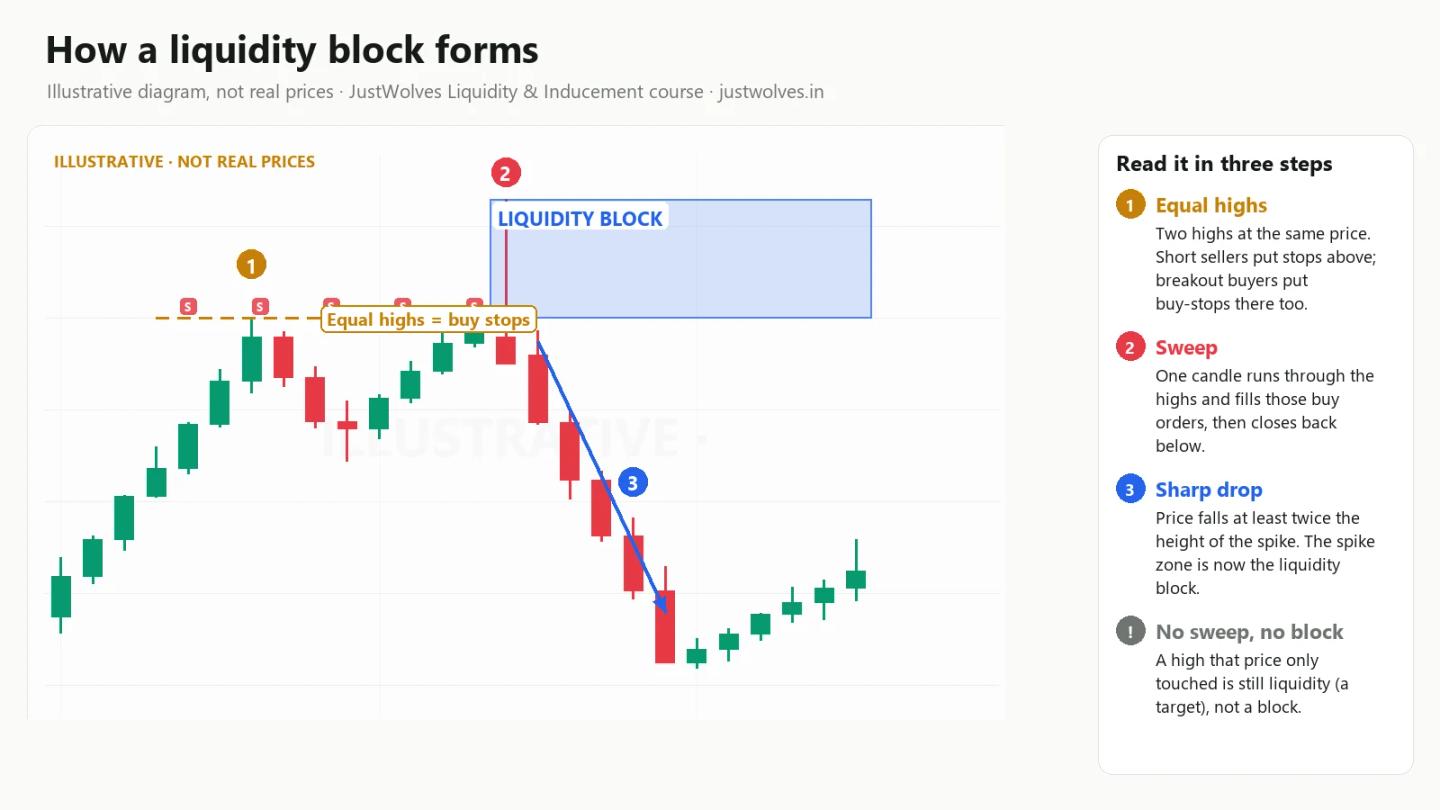
A bullish liquidity block is the mirror image: equal lows are swept, sell stops are filled, and price rallies hard. The zone from the swept low to the bottom of the spike is the block, and it sits below price.
2. Early buyers and early sellers: who they are and why they enter early
An early buyer buys before the move they are hoping for has really started. An early seller sells before it has really started. They are usually right about the direction, at least for a while. They are wrong about the timing, and that is what makes their stops useful to everyone else.
Why do traders enter early? Four reasons explain almost all of it:
- Fear of missing the move. After a strong move, the first sign of continuation feels like the last chance to get in.
- Textbook rules. "Buy the breakout", "sell the break of support", "buy the retest". These rules are taught everywhere, so many traders act on the same signal at the same place (Lesson 2).
- Tight stops for a better ratio. Entering at a small swing lets you place a very tight stop, which makes the reward-to-risk ratio look excellent. The tight stop sits exactly where everyone else's does.
- Small timeframes. On a 1-minute or 5-minute chart, every small swing looks like a structure break. On the 15-minute and 1-hour chart, it is just noise inside a range.
None of these traders is foolish. They are acting on rules that work some of the time. The problem is that their stops are predictable, and predictable stops are liquidity.
3. Where early traders come from: four scenarios
You will see early buyers and early sellers in the same four places again and again.
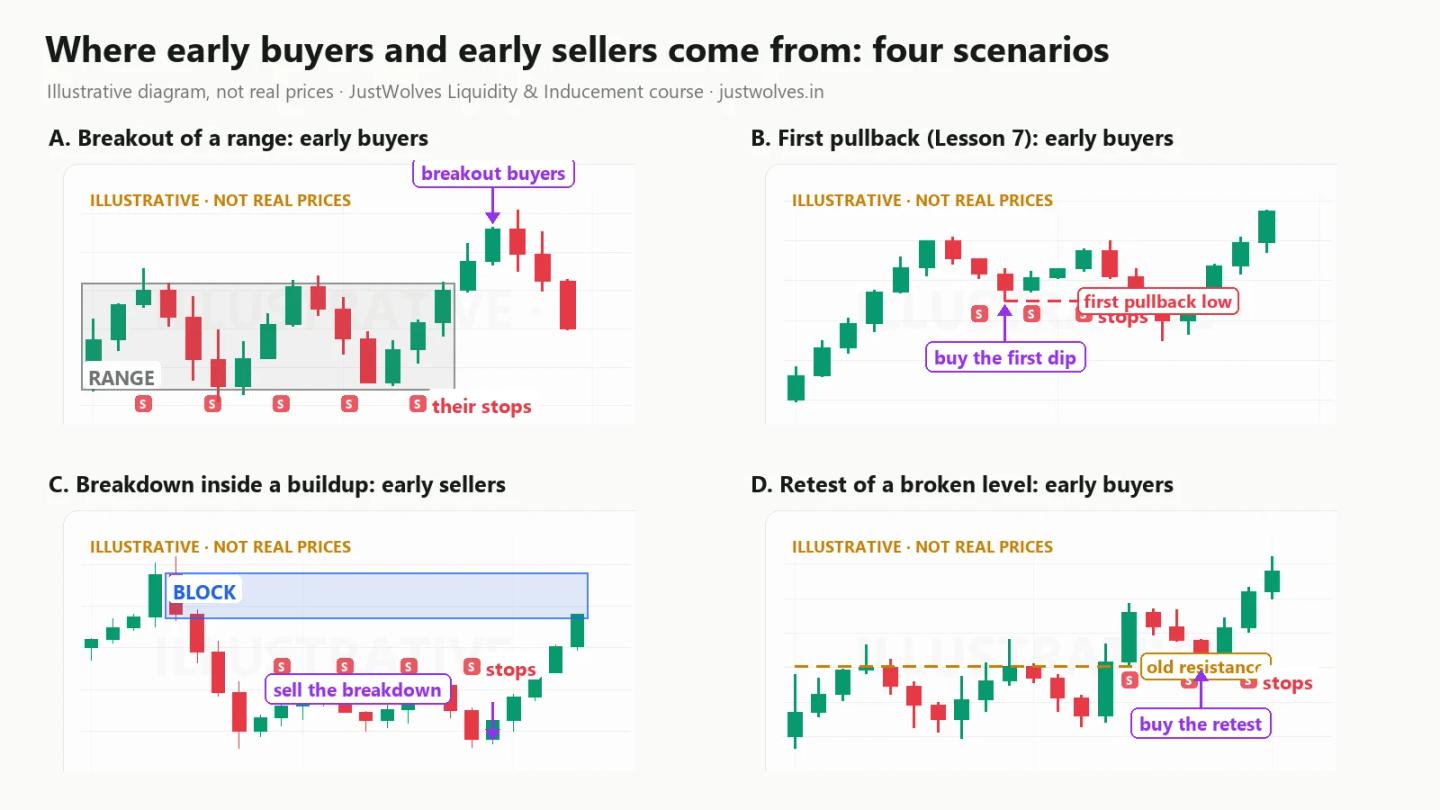
| Scenario | Who enters early | Where their stops sit | Lesson |
|---|---|---|---|
| A. Breakout of a range | Breakout buyers above the range high (or sellers below the low) | Back inside the range, often under the range low | Lesson 2 |
| B. First pullback after a strong move | Traders who buy the first dip (or sell the first rally) | Just beyond the first pullback swing | Lesson 7 |
| C. Breakdown inside a buildup | Traders who sell a small breakdown under a block (or buy a small breakout above one) | Just beyond the buildup's highs (or lows) | This lesson |
| D. Retest of a broken level | Traders who buy the retest of old resistance (or sell the retest of old support) | Just under the retest low (or above the retest high) | Lesson 8 |
In every case the pattern is the same: an obvious entry, and an obvious stop close to it. That stop is the inducement level.
4. Which side must be induced for a buy, and which for a sell
Most traders get this part backwards.
For a sell from a liquidity block above price, you want to see early sellers below the block. They sell too early, below the block, and their stops (buy orders) sit just above the small highs they sold under. When price rises and takes those stops, the forced buying pushes price up into your block. You sell where they were stopped out.
For a buy from a liquidity block below price, you want to see early buyers above the block. Their stops (sell orders) sit just below the small lows they bought above. When price drops and takes those stops, the forced selling pushes price down into your block. You buy where they were stopped out.
| You plan to... | The block is... | You need to see induced... | Their stops are the fuel at... | Your target is... |
|---|---|---|---|---|
| Sell | Above price | Early sellers | The buildup highs, under the block | The buyers' stops below the buildup lows |
| Buy | Below price | Early buyers | The buildup lows, above the block | The sellers' stops above the buildup highs |
Put simply, the traders who are induced are on your side, but early. Their stops bring price to your entry. The traders on the other side, who bought (or sold) the small bounces inside the buildup, leave the stops that become your target.
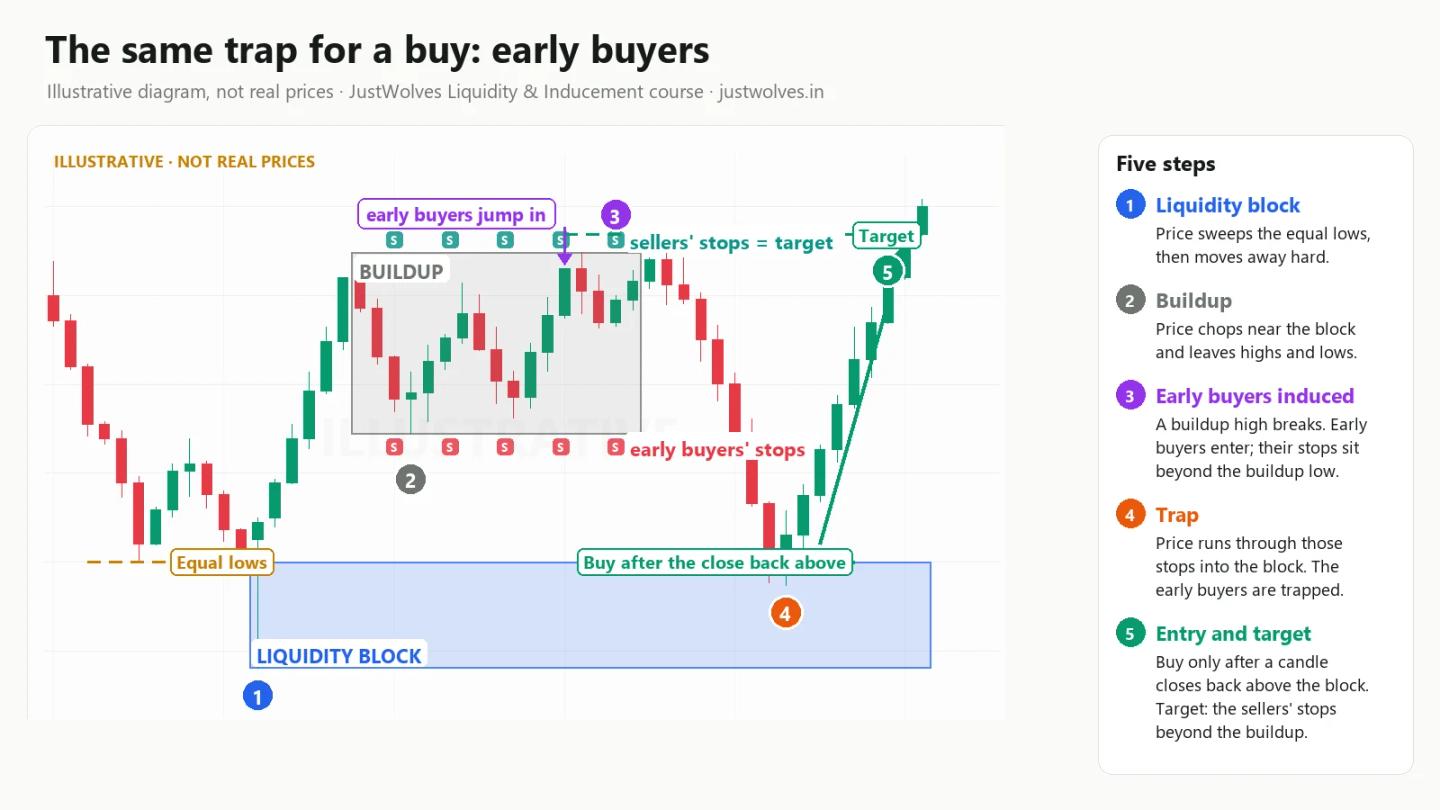
5. The inducement trap, step by step
The full sequence for a sell goes like this. A buy is the mirror image.
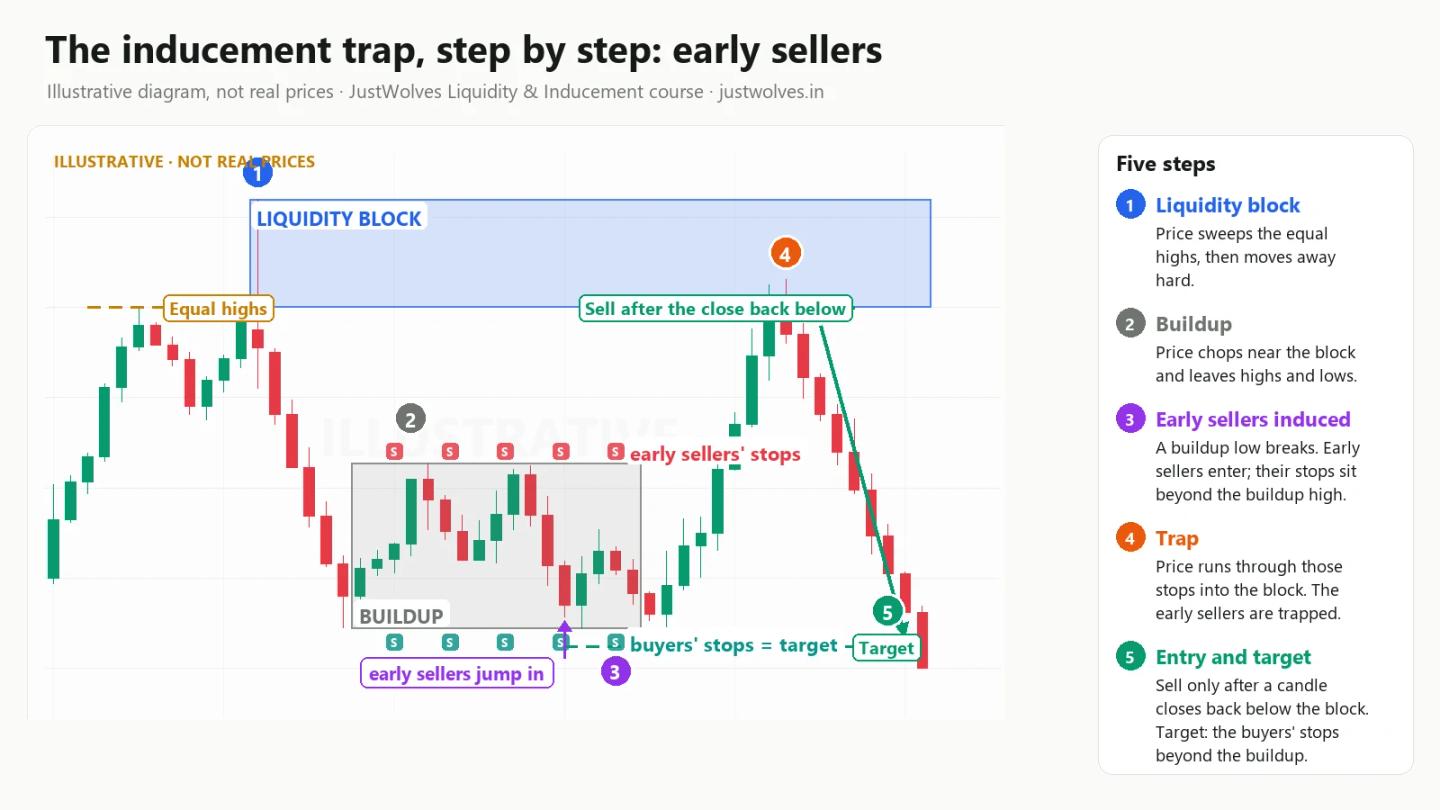
- Liquidity block. Price sweeps a pool of buy stops and drops hard.
- Buildup. Price moves sideways below the block, leaving a series of small highs and lows.
- Early sellers induced. A buildup low breaks. Traders sell the breakdown, with their stops above the buildup's highs.
- Trap. Price turns up, takes those stops, and runs into the block. The early sellers are trapped.
- Entry and target. You do not sell the first touch of the block. You wait for a 15-minute candle to close back below it, sell there with your stop above the block, and target the buyers' stops just beyond the buildup lows.
6. How to mark inducement on your chart
Do it in this order. Use the 15-minute chart for the marks and the 1-hour chart to confirm the block is a real one (Lesson 10 shows why the higher timeframe matters).
- Mark the liquidity block. Find a sweep of an obvious high or low followed by a sharp move away. Draw a box from the swept level to the end of the spike. If you cannot find the sweep, stop: there is no block.
- Mark the buildup. Draw a box around the sideways price action between the current price and the block. Note its highest high and lowest low.
- Mark the early swing. Look at the first few candles of the buildup. Their low (for a sell setup) is the level early sellers will break. In our rules this is the lowest low of the first four 15-minute candles of the buildup.
- Mark the inducement. When a later candle breaks that early low, label it "early sellers induced". From that moment, their stops sit above the buildup highs.
- Mark the fuel and the target. Draw a line at the buildup high (the early sellers' stops: the fuel) and at the buildup low (the buyers' stops: your target).
- Wait. Nothing to do until price takes the fuel and reaches the block.
A buy setup is the same with every word flipped: early buyers break a buildup high, their stops sit below the buildup lows, and your target is above the buildup highs.
7. How to check an inducement: valid or skip
Not every return to a block is a trade. Before you act, run five checks.
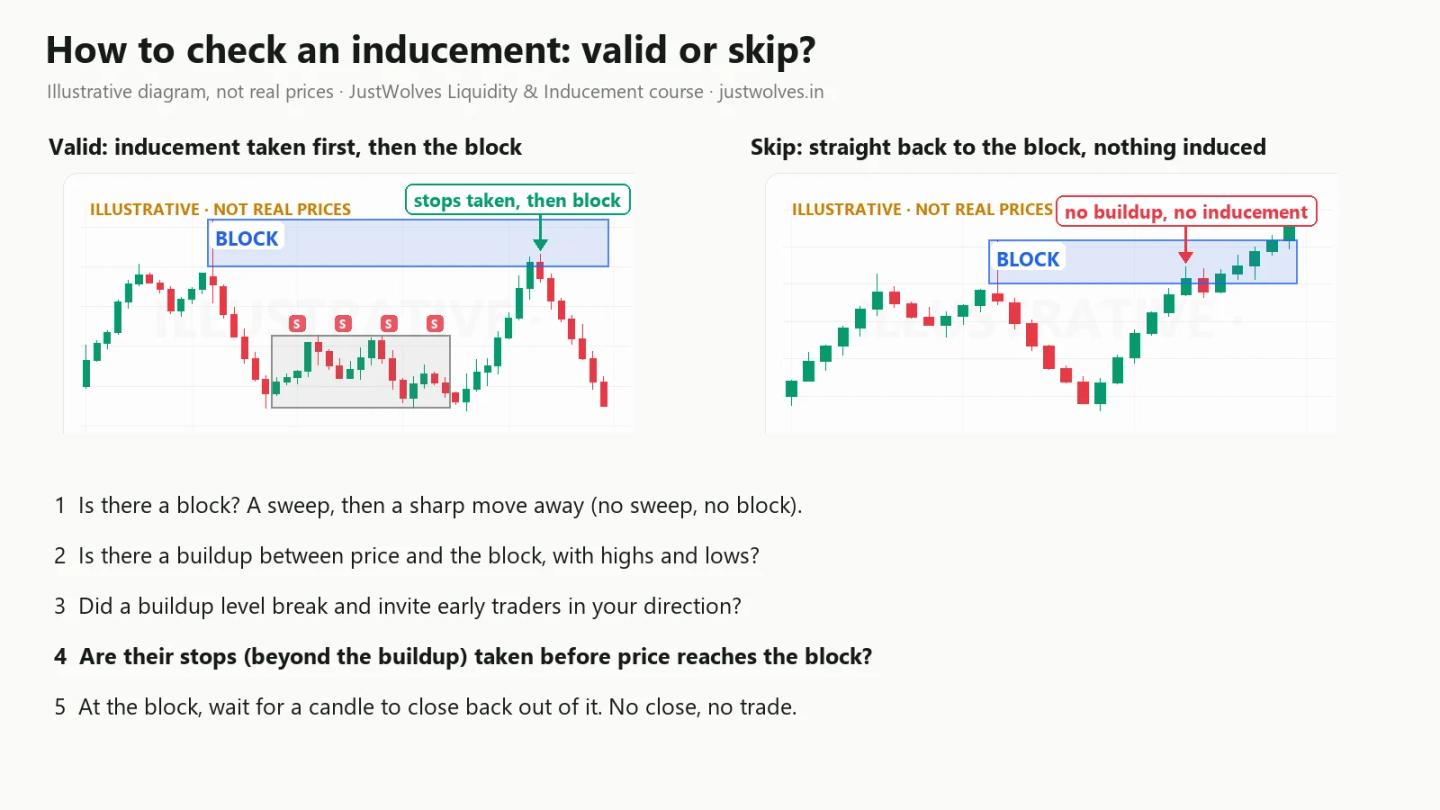
- Is there a block? A sweep, then a sharp move away. No sweep, no block.
- Is there a buildup between price and the block, with clear highs and lows?
- Did a buildup level break and invite early traders in your direction?
- Were their stops taken before price reached the block? This is the trap itself.
- Did a candle close back out of the block? No close, no trade.
If price runs straight back to the block with no buildup and no inducement, there is no trapped fuel and no engineered target. Our rules skip those, because there is nothing to tell you that the return is a trap rather than a breakout. Lesson 6 showed how often a level that looks like a sweep turns out to be a run.
8. Three real charts: a sell, a buy, and a failure
All three examples come from the same mechanical rules (section 9), on gold 15-minute data from MT5. Every mark on the charts is computed from the candles.
8.1 Real sell: early sellers trapped, Monday 16 November 2026
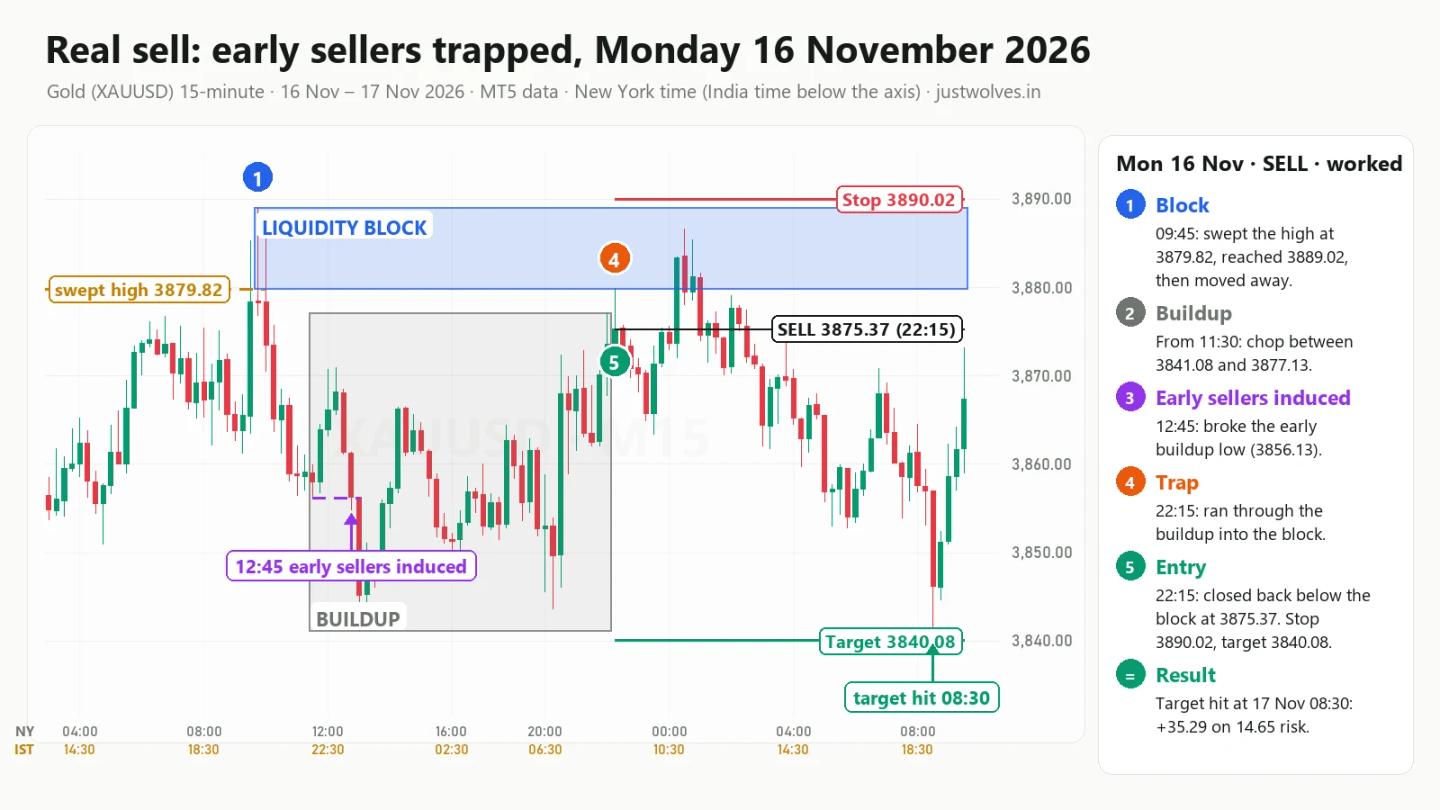
- The block. At 09:45 New York time (20:15 India time), a candle swept the high of 3879.82 from the previous evening, reached 3889.02, and closed back below at 3878.40. Within two hours gold had dropped to 3856.13. Block: 3879.82 to 3889.02.
- The buildup. From 11:30, price moved sideways between 3841.08 and 3877.13.
- Early sellers induced. At 12:45 a candle broke the early buildup low of 3856.13 and reached 3854.90. Sellers who sold that breakdown placed their stops above the buildup highs.
- The trap and the entry. At 22:15 (08:45 India time on 17 November), one candle ran up through the buildup highs, poked 5 cents into the block at 3879.87, and closed back below it at 3875.37. That close was the sell signal.
- Stop and target. Stop above the block at 3890.02 (risk $14.65). Target just below the buildup low at 3840.08.
- The result. Overnight, price went back into the block once, to 3886.59 at 00:30, but did not reach the stop. At 08:30 New York time on 17 November (19:00 India time) gold fell to 3836.90 and hit the target: +$35.29, about 2.4 times the risk.
Interactive chart: gold 15-minute, 16–17 November 2026 (MT5 data)
Loading historical candles…
8.2 Real buy: early buyers trapped, 20–21 October 2026
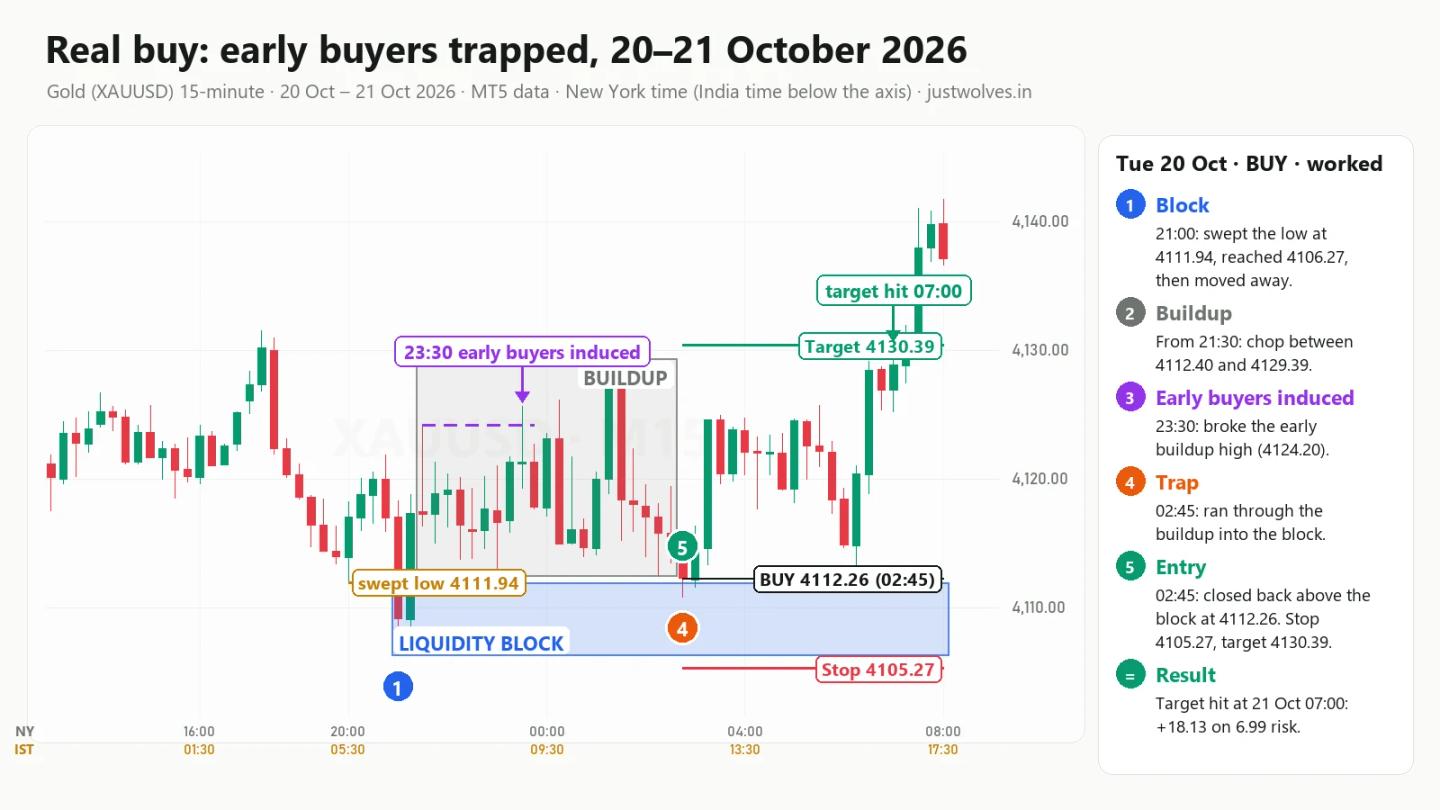
- The block. At 21:00 New York time on 20 October (06:30 India time on 21 October), a candle swept the evening low of 4111.94, reached 4106.27, and snapped back. Bullish block: 4106.27 to 4111.94, below price.
- The buildup. From 21:30, price moved sideways between 4112.40 and 4129.39.
- Early buyers induced. At 23:30 a candle broke the early buildup high of 4124.20 and reached 4125.64. Buyers who bought that breakout placed their stops below the buildup lows.
- The trap and the entry. At 02:45 (12:15 India time) a candle dropped through the buildup lows into the block, to 4110.82, and closed back above it at 4112.26: the buy signal.
- Stop and target. Stop below the block at 4105.27 (risk $6.99). Target just above the buildup high at 4130.39.
- The result. At 07:00 New York time (16:30 India time) gold reached 4130.65: target hit, +$18.13, about 2.6 times the risk.
8.3 When the trap fails: Tuesday 3 November 2026
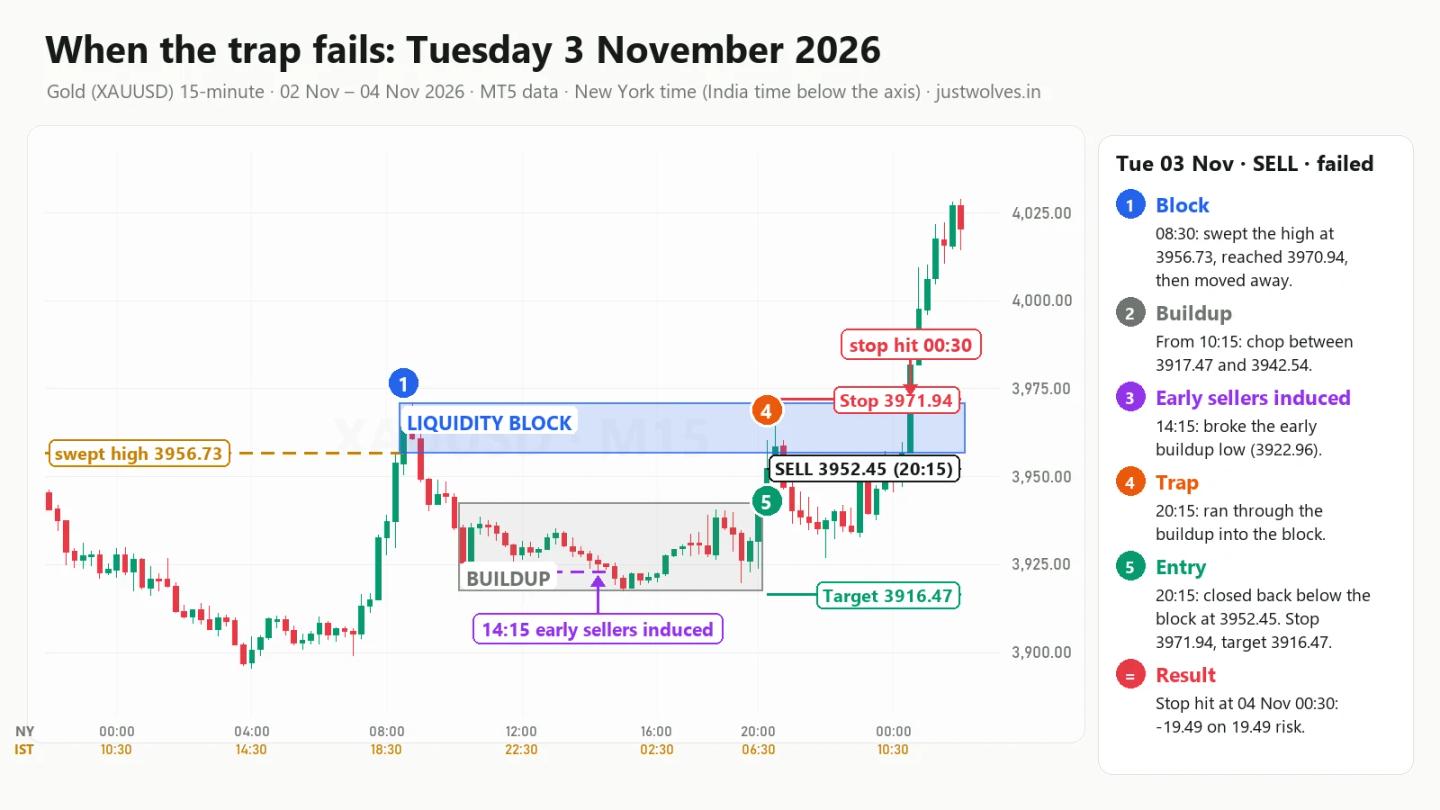
- The block. At 08:30 New York time (19:00 India time), a candle swept the high of 3956.73 from the previous evening and reached 3970.94. Block: 3956.73 to 3970.94.
- The buildup and the inducement. From 10:15 price moved between 3917.47 and 3942.54. At 14:15 a candle broke the early buildup low of 3922.96 by just 7 cents. Early sellers induced.
- The trap and the entry. At 20:15 (06:45 India time on 4 November) a candle ran into the block, to 3960.38, and closed back below at 3952.45. Sell. Stop 3971.94 (risk $19.49), target 3916.47.
- What happened. At 22:00 price was down at 3926.96: $25.49 in profit, only $10.49 short of the target. Then it turned. At 00:30 New York time on 4 November (11:00 India time) one candle opened at 3956.80 and rose to 3989.78, straight through the block. Stop hit: −$19.49.
Every step was present, exactly as on 16 November. The difference was only visible afterwards. This is why every trade needs a stop, and why the position size has to make a loss like this affordable (position sizing).
9. What five months of gold data say
We tested these exact rules on every 15-minute candle of gold from late June to 18 November 2026. The rules, written so a computer can apply them:
- Block: a candle trades above the highest high of the previous 12 hours, and within 2 hours price drops at least twice the height of the spike.
- Buildup: at least 2 hours below the block without touching it; a later candle breaks the low of the first four buildup candles (early sellers induced).
- Trap: price then trades back up into the block.
- Entry: either at the edge of the block, or (the rule in this lesson) only after a candle closes back below it within the next hour.
- Stop: above the block. Target: just beyond the buildup low. Buy setups are the mirror.
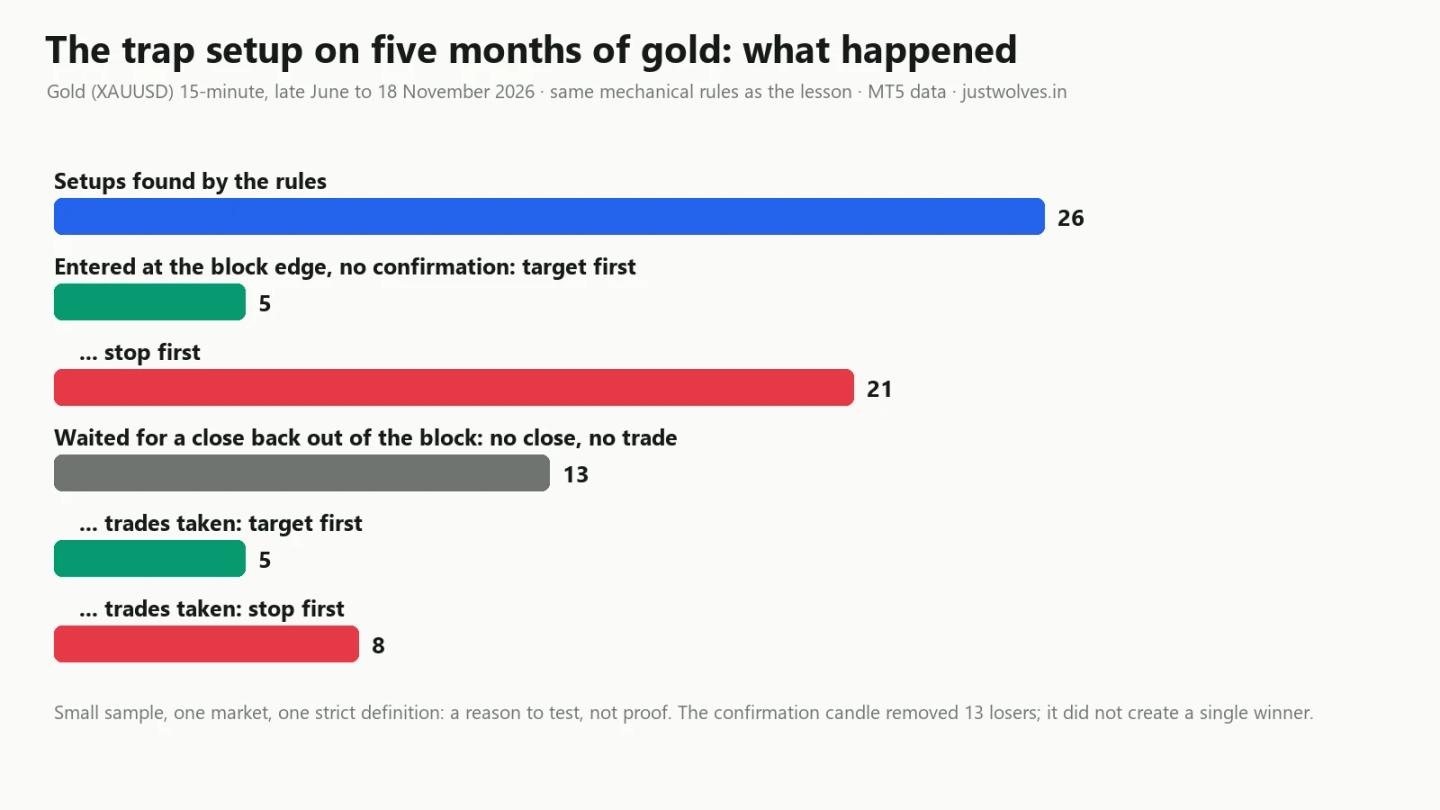
| Setups | Target first | Stop first | No trade | |
|---|---|---|---|---|
| Enter at the edge of the block, no confirmation | 26 | 5 | 21 | 0 |
| Wait for a close back out of the block (this lesson) | 26 | 5 | 8 | 13 |
Gold (XAUUSD) 15-minute, late June to 18 November 2026, MT5 data. A hypothetical test of fixed rules, not real trades.
What we take from this:
- The setup is rare. 26 times in about five months on gold, a handful per month.
- Entering at the first touch was a losing idea. 21 of 26 hit the stop.
- The confirmation close did not create a single winner. It removed 13 losing trades that never gave a close back out of the block. Of the 13 trades left, 5 reached the target and 8 hit the stop.
- Most trades still lost, but the winners were larger. The five winners paid 1.4, 2.1, 2.4, 2.6 and 5.4 times the risk. Added up, the 13 trades made about +5.9 times the risk before costs. But one trade (the 5.4R winner on 24 June) supplied most of that; without it the total was about +0.5R. With 13 trades, one lucky or unlucky trade changes the whole picture, so this is far too few to be sure.
Common mistakes with liquidity blocks and inducement
- Calling every high a block. No sweep, no block.
- Getting the induced side backwards. For a sell from a block above, you want early sellers below it, not early buyers.
- Selling the first touch of the block. In our data, 21 of 26 first-touch entries hit the stop.
- Putting the stop inside the block. The stop goes beyond the whole block, plus a small buffer.
- Trading a return with no buildup and no inducement. There is no trapped fuel and no target.
- Ignoring news. A news candle can run straight through a block, as on 4 November.
Homework
Find one liquidity block on gold from the last two weeks. Mark the block, the buildup, the early buildup low (or high), and the candle that induced early traders. Then answer: were their stops taken before price reached the block? Did a 15-minute candle close back out of the block? Write down what happened next. Do the same for two more blocks and compare your three cases with section 8.
Practise on the live gold chart
● LiveFrequently Asked Questions
What is a liquidity block in trading?
The zone left behind when price sweeps a pool of stops (for example above equal highs) and then moves away sharply. It runs from the swept level to the end of the spike. When price returns to it, it is a zone where large orders acted before.
What is an inducement trap?
A sequence where early traders are tempted to enter before the real move, place predictable stops, and are then stopped out as price runs to a liquidity block. Their stops provide the fuel that carries price into the block.
Who are early buyers and early sellers?
Traders who enter on an obvious signal (a breakout, a first pullback, a small breakdown, a retest) before the bigger move has started. They are often right about the direction but wrong about the timing, and their stops sit close to their entry.
How do I mark inducement?
Mark the liquidity block, then the buildup between price and the block, then the early swing inside the buildup. The candle that breaks that early swing is the inducement; the stops of the traders it attracts sit at the far side of the buildup.
How do I know if an inducement is valid?
Check that the early traders' stops were taken before price reached the block, and wait for a candle to close back out of the block. If price returns to the block with no buildup and nothing induced, skip it.
Does the liquidity block and inducement trap work?
On five months of gold 15-minute data, our strict rules found 26 setups. With the confirmation close, 13 became trades: 5 reached the target and 8 hit the stop. It is rare and risky, so test it on your own market before trading it.
Test Your Knowledge
What must happen before a high becomes a liquidity block?
Related lessons
Education only. Not investment advice or a recommendation to trade. JustWolves is not a SEBI-registered adviser. Real charts and statistics use historical MT5 chart data for gold from June to November 2026; illustrative diagrams are labelled and do not show real prices. The results are a hypothetical test of fixed rules, not real trades, and are not a forecast. Trading forex and commodities involves substantial risk of loss.