Liquidity Sweep Strategy: Entry, Stop, Target and a Real Win-Rate Test
JustWolves is an educational platform and is not a SEBI-registered investment advisor. Trading financial instruments involves significant risk of loss and may not be suitable for all investors. Past performance is not indicative of future results. Read our full disclaimer →
What you'll learn
- A liquidity sweep entry has five parts: the liquidity, the structure shift, the gap entry, the stop beyond the sweep and the target, plus position size.
- Tested mechanically on gold from June to November 2026 with costs, the structure-shift model lost (−0.34R per trade over 43 trades); entering on the sweep candle also lost; waiting for the confirmed sweep roughly broke even.
- A clean-looking setup is not an edge. Write rules down, test them without hindsight, and trade small until you have your own evidence.
- Liquidity is most useful for deciding where not to put your stop, and where the next target sits.
- Risk a small fixed percentage per trade. Twelve straight losses at 1% risk cost about 11%; at 5% risk, about 46%.
In this article · 11 sections
A liquidity sweep strategy is the trade most liquidity courses build towards: price takes a pool of stops, the structure shifts the other way, and you enter on the pullback with your stop beyond the sweep. This lesson builds that entry step by step, with exact rules for the trigger, the entry, the stop, the target and the position size. Then it does something most courses do not: it tests those rules mechanically on real gold (XAUUSD) data from MetaTrader 5 (MT5), June to November 2026, with trading costs included, and shows you the result, including the parts that did not work.
What you will learn
- The five parts of a liquidity sweep entry
- Our exact rules
- Real chart: a winning trade, 8 July 2026
- Real chart: the same rules, a losing trade, 4 August 2026
- The liquidity sweep win rate: what the rules did over five months
- What the test does and does not tell you
- Stops, targets and position size: the parts liquidity does help with
- Common mistakes, FAQ and quiz
1. The five parts of a liquidity sweep entry
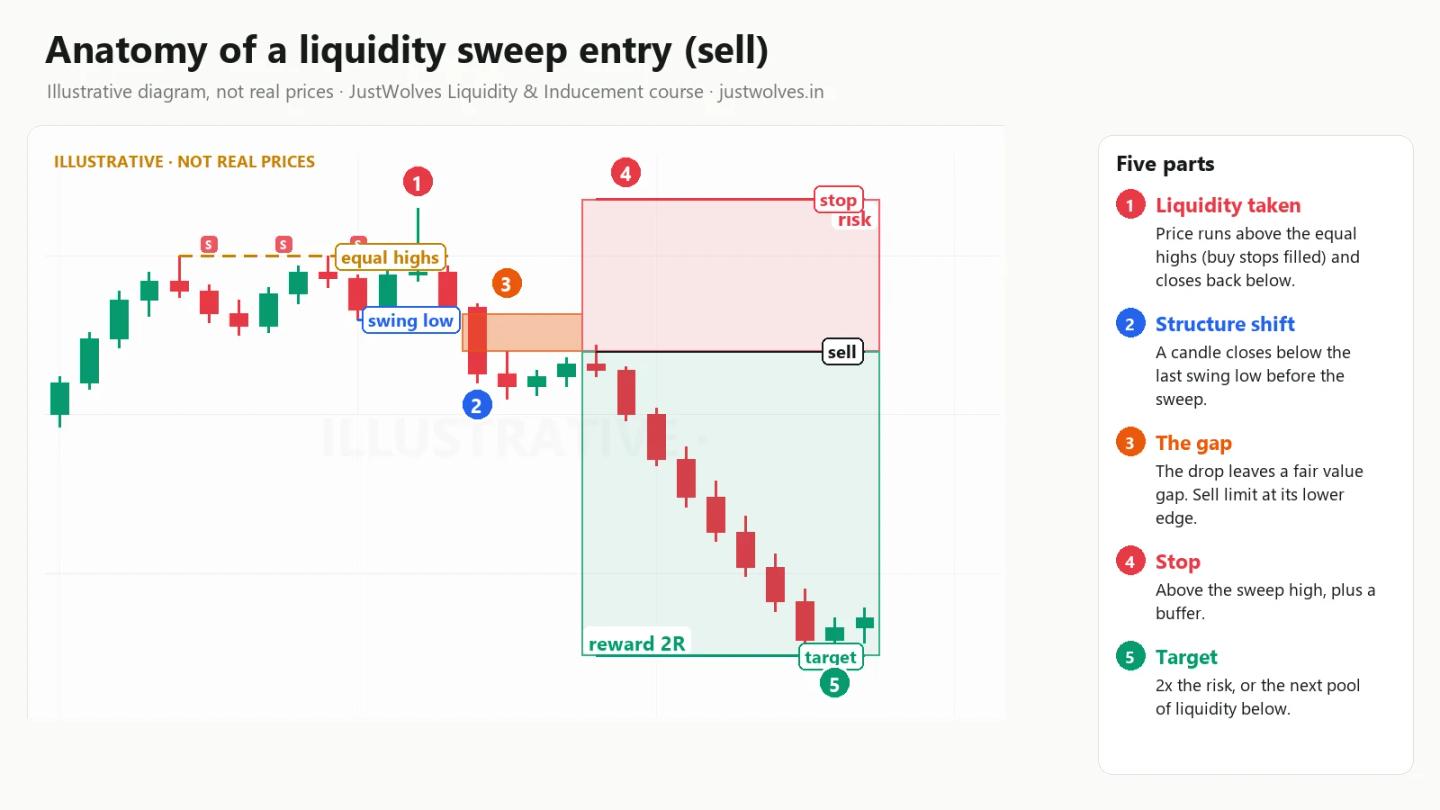
Every trade has the same five parts, whatever the method. A liquidity sweep entry fills each of them with something you learned in this course:
| Part | The question | The liquidity answer |
|---|---|---|
| Setup | Where might price turn? | At a pool of liquidity: a previous day, week or session high or low (Lesson 1) |
| Trigger | What tells me it might be turning now? | The pool is taken, then the short-term structure shifts the other way |
| Entry | Where exactly do I get in? | On a pullback into the gap (fair value gap) left by the move away |
| Stop | Where am I wrong? | Beyond the extreme of the sweep, plus a small buffer |
| Target | Where do I take profit? | At a fixed multiple of the risk, or at the next pool of liquidity |
Then a sixth part that is not about the chart at all: size. How much you trade decides whether a run of losing trades is a bad week or the end of your account. Section 7 covers it.
The structure shift, also called a market structure shift (MSS), is the key filter. After a high is swept, price must close below the last swing low that was in place before the sweep. That close is the evidence that sellers have taken control at least for now. Our market structure shift vs CHoCH lesson explains the idea in detail, and the fair value gap lesson explains the gap.
2. Our exact rules
To test anything fairly, the rules have to be written down before you look at the results, and they cannot use any information that was not available at the time. Here are the rules for a short after a high is taken (a long after a low is taken is the exact mirror):
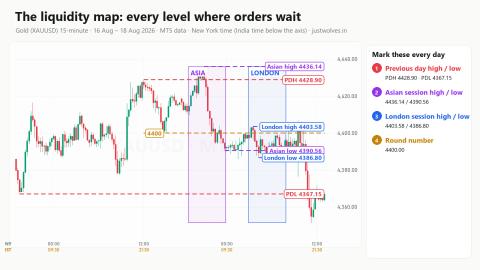
- The liquidity. Any first take, by more than 50 cents, of a previous day high, previous week high, or Asian or London session high. These are the same 429 takes used in Lesson 6 and Lesson 10.
- The structure shift. Within the next 16 fifteen-minute candles (four hours), a candle must close below the last confirmed 15-minute swing low that existed before the take. If price first closes more than one ATR above the level, the setup is cancelled.
- The gap. The last bearish fair value gap formed between the take and the structure shift (a candle whose low, two candles earlier, is above the high of the candle after it). The entry is a sell limit at the lower edge of that gap.
- The fill. The order must be filled within the next 16 candles. If price runs to the target without coming back, there is no trade.
- The stop. Above the highest price between the take and the structure shift, plus a buffer of 0.1 × the 15-minute ATR.
- The target. Two times the risk (2R). We also report 1R and 3R.
- The exit. Whichever of stop or target is touched first. If a candle touches both, we count the stop (the conservative choice). Anything still open after 48 hours is closed at the market.
- Costs. $0.30 per trade for spread and commission, subtracted from every result.
There is no judgement in these rules and no hindsight. A computer can apply them, which means anyone can check them.
3. Real chart: a winning trade, Wednesday 8 July 2026
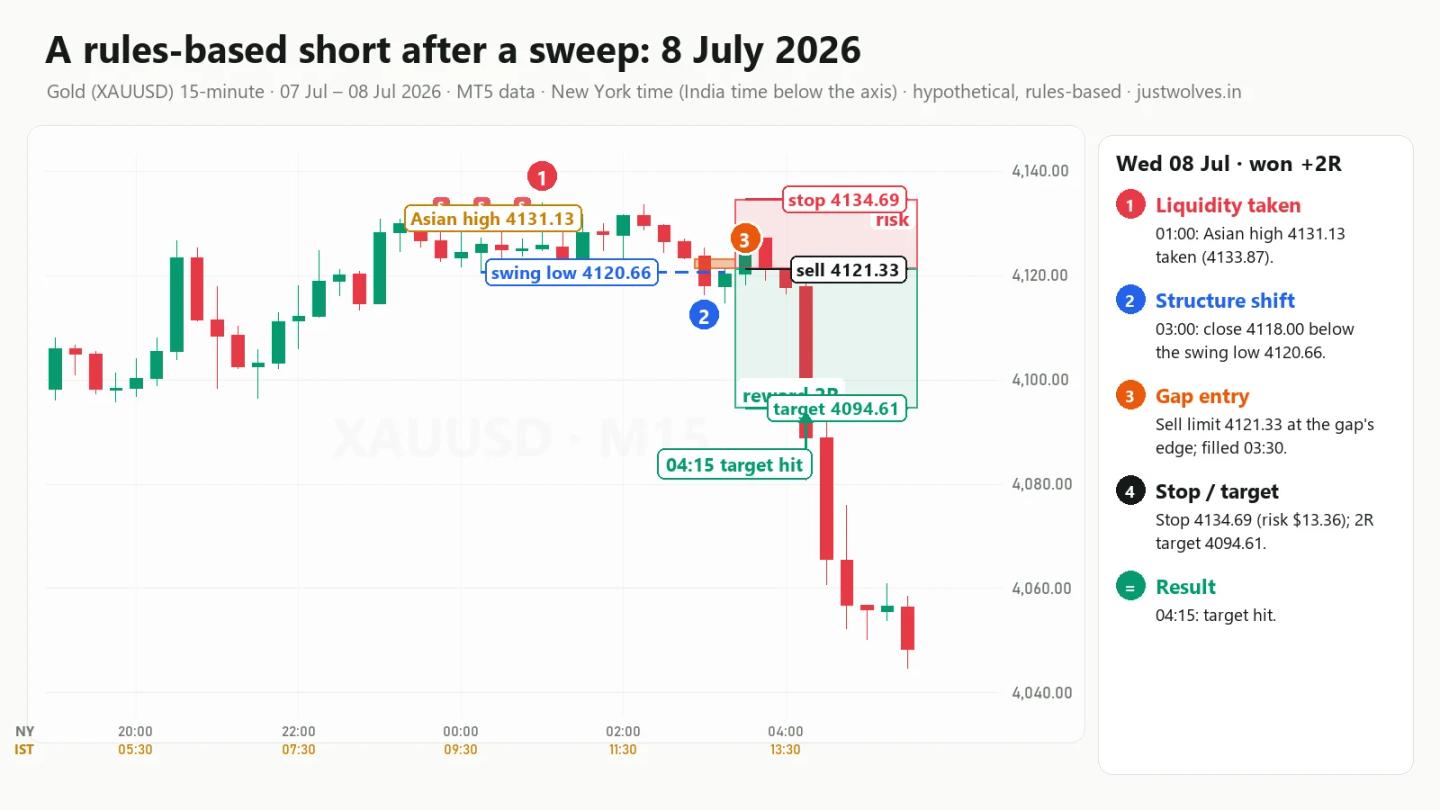
- The liquidity. The Asian session high was 4131.13, made at 23:30 New York time on 7 July.
- The take. At 01:00 on 8 July (10:30 India time), a candle traded to 4133.87 and closed at 4125.79, back below. (In Lesson 6 terms this first hour was "mixed": the rules here do not need a clean sweep, only the structure shift that follows.)
- The structure shift. The last 15-minute swing low before the take was 4120.66, at 00:15. At 03:00 a candle closed at 4118.00, below it.
- The gap and the entry. That 03:00 candle left a bearish fair value gap: the candle before it had a low of 4123.32 and the candle after it a high of 4121.33. The sell limit sat at 4121.33.
- The fill. At 03:30 price came back up and filled the order. It went as high as 4127.34 in that candle, about $7 from the stop, which is a normal thing to sit through.
- Stop and target. The stop was at 4134.69 (the sweep high of 4133.87 plus the buffer), a risk of $13.36. The 2R target was 4094.61.
- The result. At 04:15 a large bearish candle fell to 4080.84, hitting the target: +2R, minus costs.
This is the trade the method is designed to catch, and it looked textbook from start to finish.
4. Real chart: the same rules, a losing trade, Tuesday 4 August 2026
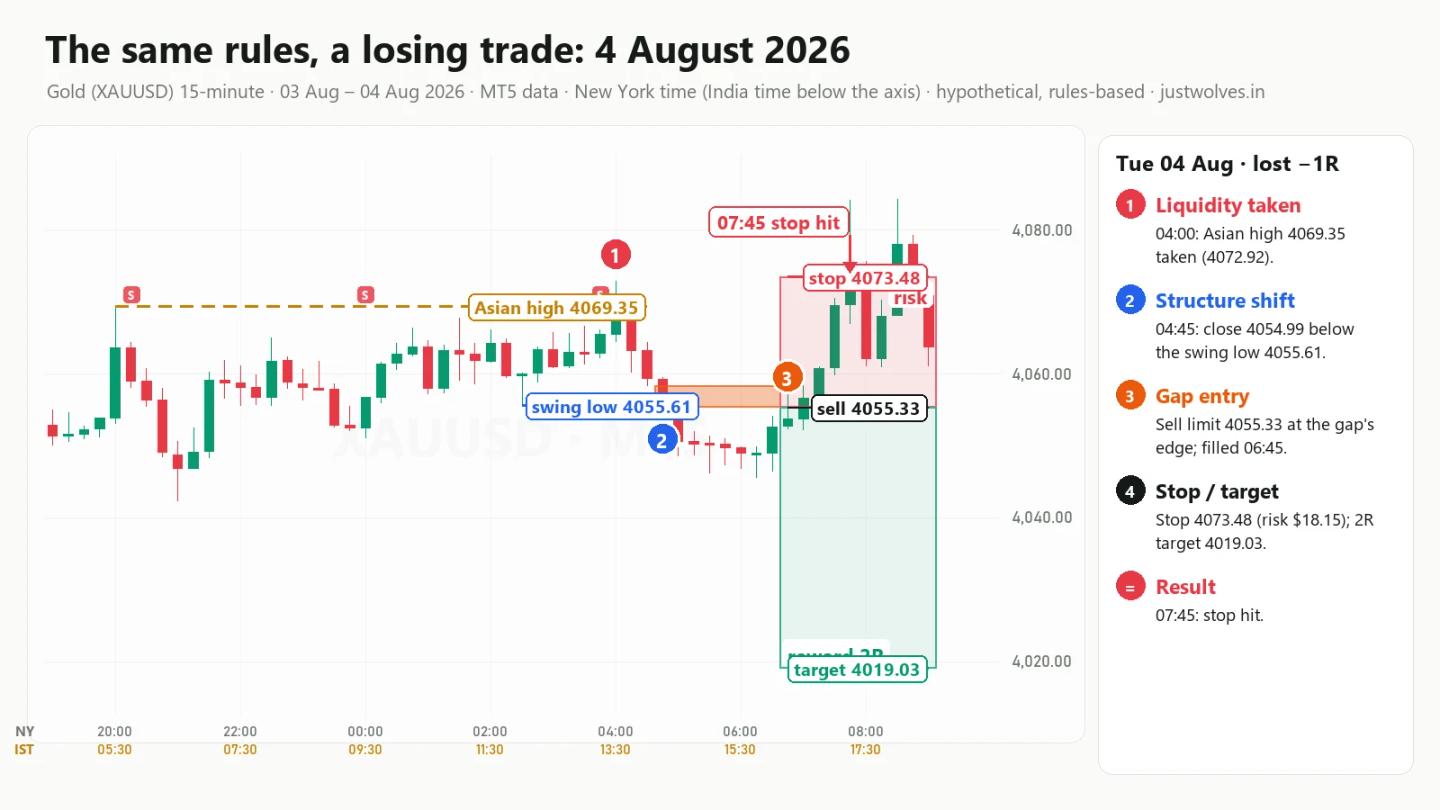
- The liquidity and the take. The Asian high was 4069.35 (20:00 New York time on 3 August). At 04:00 on 4 August a candle traded to 4072.92 and closed at 4068.17, back below. This time the first hour was a clean sweep by the Lesson 6 rules.
- The structure shift. At 04:45 a candle closed at 4054.99, below the swing low of 4055.61 from 02:30.
- The entry. The gap from that move put the sell limit at 4055.33. It filled at 06:45.
- The stop and the result. The stop was 4073.48, a risk of $18.15. After the fill, price only got as low as 4052.31, about $3 in our favour. Then it turned up, and at 07:45 a candle reached 4084.21: stopped out, −1R. By 09:45 gold was at 4093.97, well above the Asian high.
Every rule was met, and the setup looked at least as clean as 8 July. It still failed. Nothing visible at the moment of entry separated these two trades. That is the reality of any entry method, and it is why the next section matters.
5. The liquidity sweep win rate: what the rules did over five months
We applied the rules to every one of the 429 liquidity takes from June to November 2026. We also tested two simpler versions without the structure shift, to see what the shift adds:
- No confirmation: sell at the close of the take candle if it closes back below the level, stop above its high.
- Confirmed sweep, no shift: wait for the Lesson 6 sweep (four more closes back inside), sell at the close of the fifth candle, stop above the highest high so far.
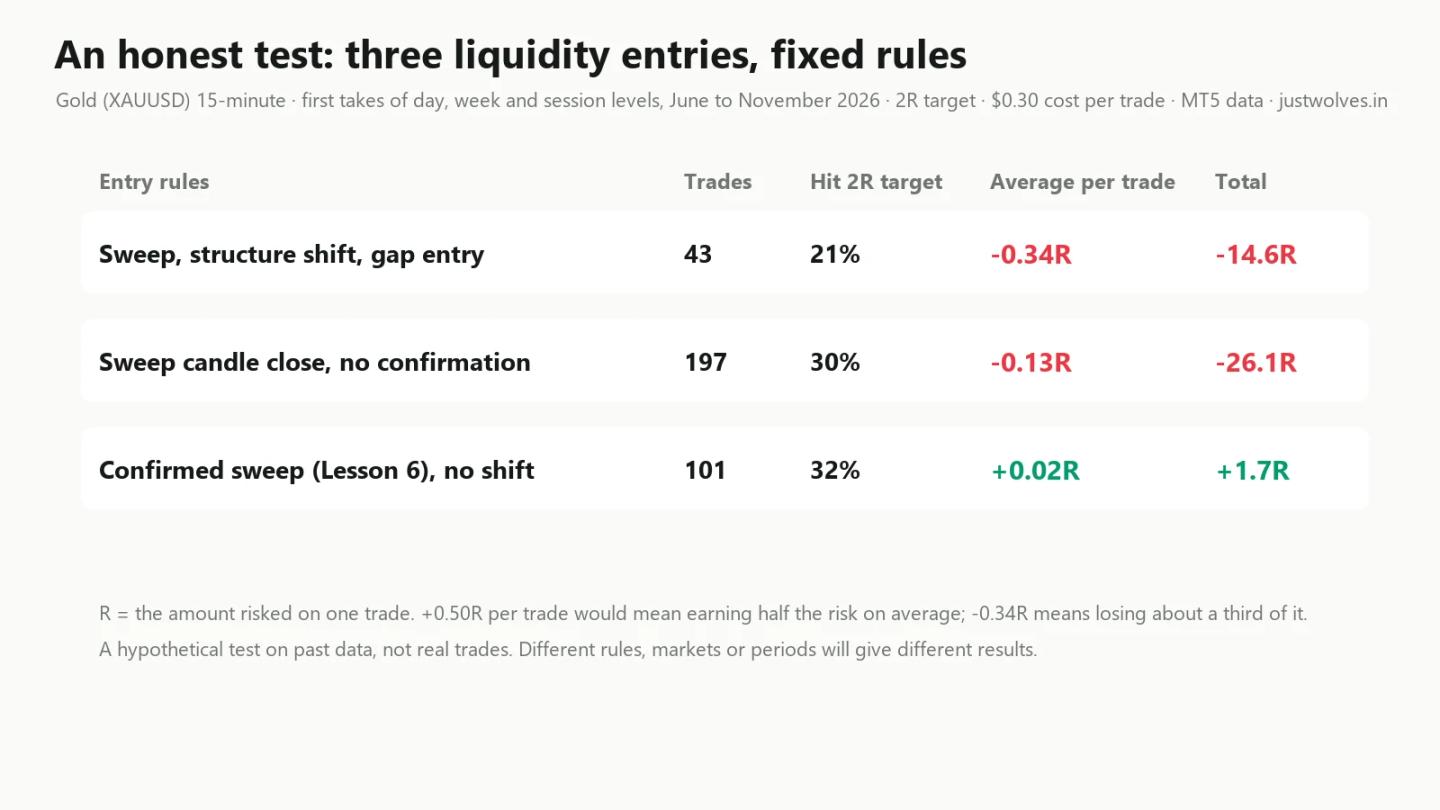
| Entry rules (2R target) | Trades | Hit target | Hit stop | Average per trade | Total |
|---|---|---|---|---|---|
| Sweep, structure shift, gap entry | 43 | 9 (21%) | 32 | −0.34R | −14.6R |
| Sweep candle close, no confirmation | 197 | 60 (30%) | 137 | −0.13R | −26.1R |
| Confirmed sweep (Lesson 6), no shift | 101 | 32 (32%) | 63 | +0.02R | +1.7R |
Gold (XAUUSD), 15-minute, MT5 data, June to November 2026. "Hit target" and "hit stop" do not always add up to the total because a few trades were closed after 48 hours. R = the amount risked on one trade.
So what does this show?
The full model, with the structure shift and the gap entry, lost money. It hit the 2R target in only 9 of 43 trades. To break even at 2R you need to win a little over one trade in three; it won about one in five. With a 1R target it won 40% of the time and still lost (−0.22R per trade); with a 3R target it won 16% and lost (−0.32R per trade).
Entering on the sweep candle with no confirmation also lost, over many more trades.
Waiting for the confirmed sweep from Lesson 6 roughly broke even: +0.02R per trade over 101 trades, which is indistinguishable from zero.
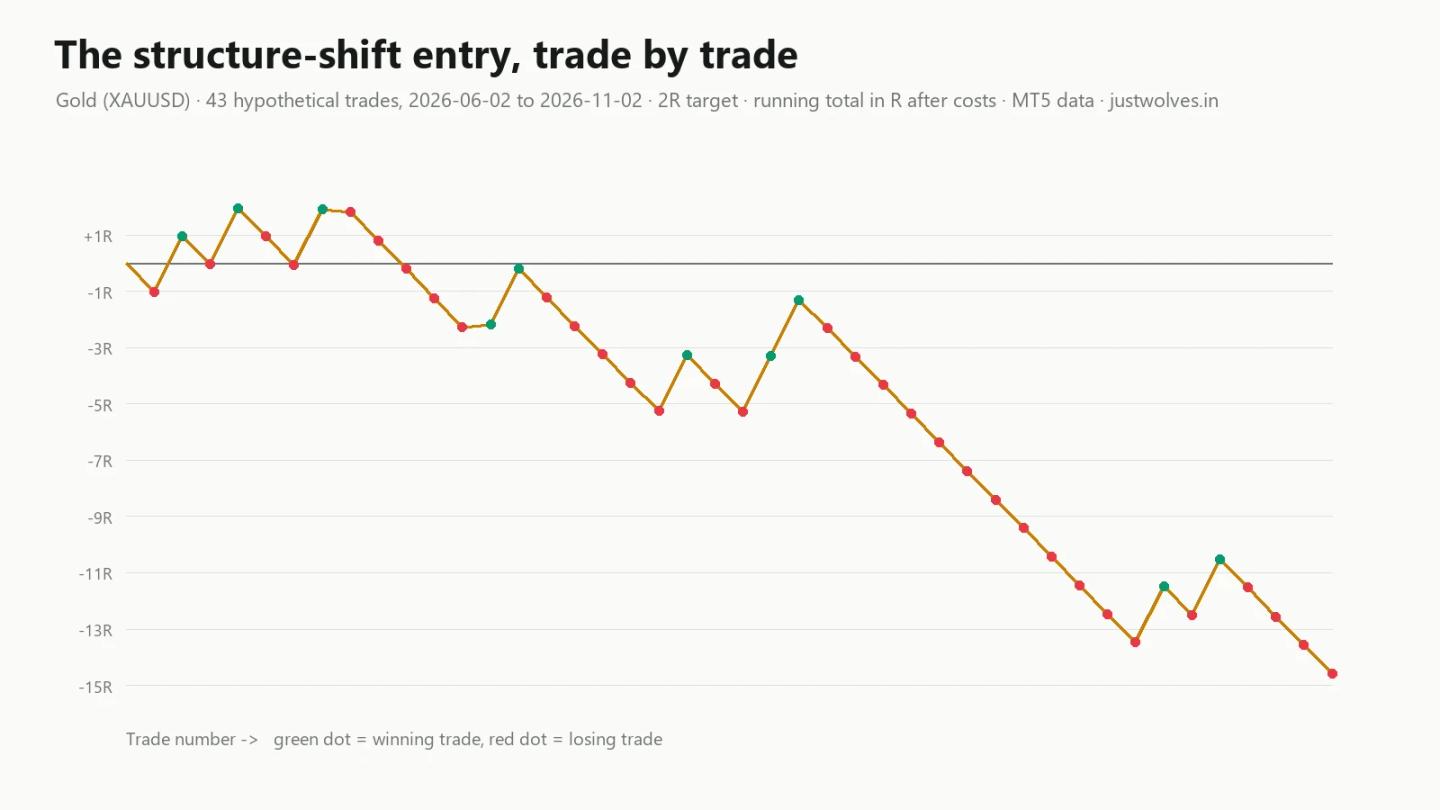
The running total is worth a close look. After four trades the model was up almost 2R and would have looked brilliant. Over the next few months it gave all of that back and much more. The longest run of losing trades was 12 in a row. It made money in no single month: June and July were roughly flat, and August, September and October lost 3.1R, 5.1R and 5.2R.
One more number explains much of the problem. Of the 32 trades that were stopped out, 10 later reached the target price anyway within 48 hours. The stop beyond the sweep was hit and then price went the planned way. In other words, the sweep extreme itself was often swept: the stop placed "safely" beyond the liquidity became liquidity.
6. What the test does and does not tell you
It would be easy to hide a result like this. We think you are better served by seeing it, because you will meet many courses and social media posts that show only trades like 8 July.
What the test does tell you:
- These exact rules, on gold, in this period, did not make money. If you were planning to trade them mechanically, the evidence says don't.
- A popular entry pattern is not automatically an edge. A setup that looks perfect on a chart picked afterwards can still lose over dozens of trades.
- Losing streaks of ten or more are normal even for methods that eventually work, so they are certainly normal for methods that don't. Your sizing has to survive them (section 7).
What the test does not tell you:
- It does not prove that liquidity sweeps never work. It tests one specific set of rules. A different structure-shift definition, entry, stop or time filter would give a different result, and so would a different market or period.
- It does not include judgement. A skilled trader might skip trades that run against the daily direction (Lesson 10) or that come at the wrong time of day (Lesson 5). But be careful: it is very easy to find a filter that fixes the past and fails in the future. We tested one filter that we chose before looking (trade only in the direction of the previous day's candle), and it did not fix the structure-shift model (−0.18R per trade on 18 trades) and made the no-confirmation model worse.
- 43 trades is a small sample. The true long-run result of these rules could be better or worse than −0.34R.
7. Stops, targets and position size: the parts liquidity does help with
The test says liquidity alone did not give these entry rules an edge. But the ideas in this course are still useful in three places that every trade needs, whatever the entry.
7.1 Where to put the stop
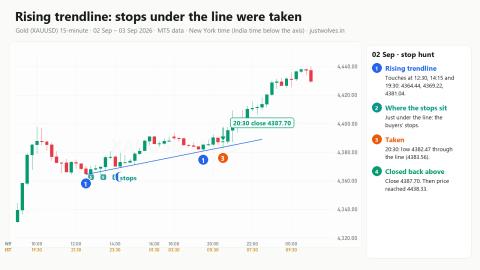
The worst place for a stop is where everyone else's is: just beyond the obvious swing or the first pullback (Lesson 7). Liquidity thinking tells you where those crowded places are, so you can avoid them:
- Put the stop beyond the level that would prove the idea wrong, not beyond the nearest small swing.
- Add a buffer. In our test, 10 of 32 stopped trades would have reached the target with more room. A wider stop means a smaller position for the same risk, not a bigger loss.
- Never move your stop closer just to make the position bigger. See our stop loss lesson.
7.2 Where to take profit
Fixed multiples (1R, 2R, 3R) are simple and testable. The liquidity alternative is to aim for the next pool: the opposite side of the dealing range, the previous day low, the Asian low, or an old low within one daily ATR (Lesson 8). A common rule is to take the trade only if the next pool is at least 2R away. Our risk to reward ratio lesson explains why the target and the win rate must be judged together.
7.3 How much to trade
Position size is the one part that decides whether you can survive being wrong. The formula is simple:
Position size = (account size × risk per trade %) ÷ (distance to stop × value per point)
On a standard MT5 gold contract, one lot is 100 ounces, so a $1 move is $100 per lot (check your broker's contract specification; some differ). Using the 8 July trade:
| Value | |
|---|---|
| Account | $10,000 |
| Risk per trade | 1% = $100 |
| Distance from entry to stop | $13.36 |
| Ounces | $100 ÷ $13.36 = about 7.5 oz |
| Lots | about 0.07 lots (actual risk $93.52) |
Now look at what a losing streak does at different risk levels. The structure-shift model's longest run was 12 losses in a row:
| Risk per trade | Account after 12 straight losses |
|---|---|
| 1% | about 88.6% left (−11.4%) |
| 2% | about 78.5% left (−21.5%) |
| 5% | about 54.0% left (−46.0%) |
At 1% risk, twelve losses in a row is painful but survivable. At 5%, it nearly halves the account. Our position sizing lesson goes deeper.
Common mistakes with liquidity sweep entries
- Believing a setup is an edge because it looks clean. The 4 August trade met every rule and lost.
- Judging a method by its best examples. The structure-shift model was up almost 2R after four trades and down 14.6R after 43.
- Testing with hindsight. Our first draft of the comparison test accidentally entered at the sweep candle's close using information only known four candles later, and it looked very profitable. Once fixed, the profit disappeared. Check every rule for this.
- Placing the stop exactly at the sweep extreme. That extreme is itself a fresh pool of liquidity.
- Sizing up after a few wins. The risk per trade should not change with your mood.
Homework
Write down your own version of the entry rules in section 2: what counts as the liquidity, what counts as the structure shift, where you enter, where the stop and target go. Then go back through the last 20 takes of the Asian high or low on gold and apply your rules, candle by candle, without looking ahead. Record each result in R, subtract a cost, and add them up. Compare your result with the table in section 5.
Interactive chart: gold 15-minute, 7–8 July 2026 (MT5 data)
Loading historical candles…
Practise on the live gold chart
● LiveFrequently Asked Questions
What is a liquidity sweep entry?
A trade taken after price takes a pool of liquidity (for example the previous day high) and then shifts structure the other way. The entry is usually on a pullback into a fair value gap or order block, with the stop beyond the sweep.
Does the liquidity sweep entry work?
In our mechanical test on gold from June to November 2026, one common version (sweep, structure shift, gap entry, 2R target) lost about a third of the risk per trade over 43 trades after costs. That does not prove every version fails, but it shows the pattern is not automatically profitable.
Where should I put my stop on a sweep trade?
Beyond the sweep extreme with a buffer, at the price that would show your idea is wrong. Avoid the exact extreme and the nearest small swing: those are where other traders' stops collect.
How much should I risk per trade?
Many professional traders risk between 0.5% and 2% of their account per trade. Choose a figure that lets you survive a run of 10 to 15 losses.
What is turtle soup?
An older name for trading a false breakout of a recent high or low, popularised long before "liquidity sweep" became common. See our turtle soup lesson; the same testing advice applies.
Test Your Knowledge
What confirms the turn in our rules?
Related lessons
Education only. Not investment advice or a recommendation to trade. JustWolves is not a SEBI-registered adviser. All trades in this lesson are hypothetical: rules applied to historical MT5 chart data for gold from June to November 2026, with an estimated cost per trade. They are not real trades, they describe past behaviour in one market and period, and they are not a forecast. Trading forex and commodities involves substantial risk of loss.