
Bullish and Bearish CRT Setups
JustWolves is an educational platform and is not a SEBI-registered investment advisor. Trading financial instruments involves significant risk of loss and may not be suitable for all investors. Past performance is not indicative of future results. Read our full disclaimer →
What you'll learn
- Bullish CRT: C2 sweeps below CRL and closes back above it; look for longs in C3
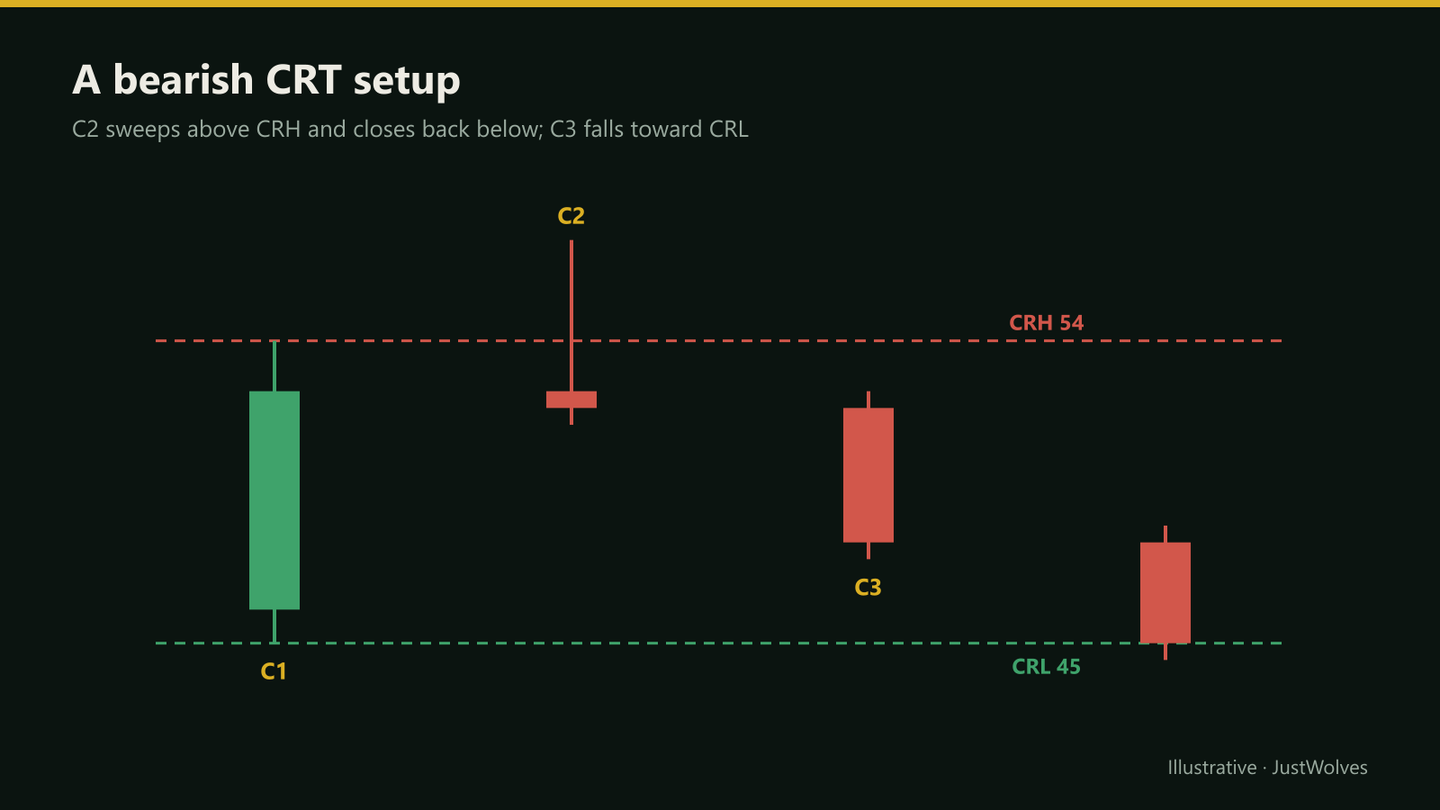
- Bearish CRT: C2 sweeps above CRH and closes back below it; look for shorts in C3
- Standard plan: entry in C3, stop beyond C2's extreme, first target at the opposite side of C1's range
- Grade setups on location, trend, close strength and room to target
- Skip setups where the reward to the first target is too small relative to the stop
In this article · 18 sections
This lesson brings the CRT model together into two complete setups: bullish and bearish. Each has a precise checklist, a standard entry, stop and target, and a set of grading criteria that separate the setups worth taking from those worth skipping. Later modules refine entries and add other frameworks; this is the core.
What You Will Learn
- The conditions for bullish and bearish CRT
- The standard entry, stop and target
- How to grade setup quality
- When to skip a valid pattern
Before You Start
Read Reclaim, Rejection and Continuation of a Range first.
Bullish CRT
Checklist
Step 1: C1
Mark CRH and CRL after C1 closes; prefer C1 at or near support.
Step 2: C2
Trades below CRL and closes back above it.
Step 3: Entry
In C3: at its open, on a retest of CRL, or on a lower-timeframe trigger.
Step 4: Stop
Below C2's low, with a small buffer.
Step 5: Target
First target CRH; optional runner beyond.
Read the checklist, then step through it on the chart below. Use Next to move one candle at a time, or Play to watch the whole sequence. The buttons on the right switch the liquidity, entry, stop and target lines on and off, so you can check what the chart looks like before you know the outcome.
Bullish CRT, step by step
Step 1 of 6
Context: price falls into support
Three candles fall into an area the trader has already marked on a higher timeframe, such as the previous day's low or a daily demand zone. Nothing to do yet.
- What to observe
- Where is price relative to higher-timeframe levels?
- Condition
- Only look for bullish CRT at or near support, or with the higher-timeframe trend.
Two details in the chart matter more than they look. First, C2's body is small and closes inside C1's range. If C2 had closed below 100.80, there would be no CRT; it would be a breakdown, and the sell stops below CRL would have done their job of pushing price lower. Second, the stop sits below C2's low, not below CRL. Placing it at CRL is the most common way a correct read still loses money: price often returns to probe the sweep area before C3 develops.
Bearish CRT
Checklist
Step 1: C1
Mark CRH and CRL; prefer C1 at or near resistance.
Step 2: C2
Trades above CRH and closes back below it.
Step 3: Entry
In C3: at its open, on a retest of CRH, or on a lower-timeframe trigger.
Step 4: Stop
Above C2's high, with a small buffer.
Step 5: Target
First target CRL; optional runner beyond.
Real Example: Bearish 4H CRT on EUR/USD
Below is an actual sequence from EUR/USD on 9–10 November 2026, built from hourly market data into 4-hour candles aligned to the 5 pm New York close (the convention most forex platforms use). It is useful precisely because it is not perfect: the pattern was valid and the move was large, but the trade plan only made sense with a runner.
Real bearish CRT: EUR/USD 4H, 10 November 2026
Step 1 of 6
Context: a slow grind higher
Through 9 November EUR/USD climbed about 30 pips in small, overlapping 4H candles. Grinding moves like this leave stops stacked just above each minor high.
- What to observe
- Small overlapping candles and closely spaced highs.
- Condition
- No setup yet. Wait for a candle to define a range.
Notice what the example teaches beyond "it worked":
- The range was small and the wick was large. C1 covered 12.6 pips, while C2 overshot by 20 pips. That ratio is what produced the poor reward to TP1. A setup can be valid and still not be worth taking at full size.
- Timing lined up with the session change. C2 was the 01:00–05:00 New York candle, which contains the Frankfurt and London opens (London opens at 03:00 New York time in winter). C3 was the 05:00–09:00 candle, running from the London morning into the New York open. Many CRT traders watch exactly these candles, because the London session frequently decides whether an overnight high or low holds.
- The higher timeframe agreed. The daily candle for 10 November closed at 1.11682, well below where it opened, and the following sessions continued lower. A bearish CRT in the direction of the next daily candle's move is what the grading table calls "in the trend's direction".
You can explore the same period yourself on the interactive chart below. It uses real candles and you can switch between daily, 4H, 1H and 15-minute views. On the 1H chart, notice that the sweep looks like a strong bullish breakout candle that closed at its high. Only on the 4H chart does it show up as a wick that failed. That is why CRT is always judged on the candle's own timeframe.
EUR/USD around the 10 November 2026 sweep
Loading historical candles…
Which Timeframes and Candles to Use
CRT can be applied to any candle, but most traders use it on a small set of timeframes where each candle carries meaning:
- Daily candles for swing trades. C1 is yesterday, C2 is today, C3 is tomorrow. Setups are rare, perhaps a few a month per instrument, but each one represents a full day of order flow.
- 4-hour candles for intraday to short swing trades. Aligning them to the 5 pm New York close gives six candles a day that open at 17:00, 21:00, 01:00, 05:00, 09:00 and 13:00 New York time. The 01:00 candle (containing the London open) and the 05:00 candle (London morning into the New York open) are the most watched.
- 1-hour candles for intraday trades, ideally confirmed by a lower-timeframe entry trigger on the 5- or 15-minute chart.
Below one hour, ranges become so small that spread and noise dominate. A 1-minute "CRT" is usually just random movement with a story attached.
| C1–C3 timeframe | Entry refinement | Typical holding time | Watch out for |
|---|---|---|---|
| Daily | 1H or 4H | 1–3 days | Weekend gaps; wide stops |
| 4H | 15m or 1H | Hours to 1 day | Candle alignment differs between brokers |
| 1H | 5m or 15m | Minutes to hours | News spikes; spread at session opens |
Grading Quality
| Factor | Stronger | Weaker |
|---|---|---|
| Location | Sweep of a widely watched level (previous day, equal highs/lows) | Mid-range, no level |
| Trend | In the higher-timeframe trend's direction | Against a strong trend |
| C2 close | Past C1's midpoint | Just inside the range |
| Room | First target well beyond 1R | Target closer than the stop |
| C1 size | Normal relative to recent candles | Very small or very large |
When to Skip
A valid pattern isn't automatically a trade. If C2's wick is long, the stop beyond it can be larger than the distance to the opposite side of the range, leaving a reward-to-risk below 1. Many traders skip those, or use a refined lower-timeframe entry to tighten the stop.
Skip setups just before major scheduled news, setups against a strong trend into a major level, and setups where C1 is unusually large.
Choosing Between Entry Points
The three standard entries suit different situations. Entering at C3's open is simple and never misses a fast move, but uses the widest stop relative to the target. Entering on a retest of the swept level gives a better price and often a tighter stop, but sometimes price leaves without retesting. A lower-timeframe trigger, such as a small break of structure on the 5- or 15-minute chart during C3, offers the tightest stop at the cost of more complexity.
Pick one entry method for testing and use it consistently. Mixing methods from trade to trade makes it impossible to tell which one works in your market. Module 08.04 compares them in detail.
Bullish and Bearish Aren't Perfectly Symmetrical
In stock indices, sharp falls tend to be faster than rallies, and sweeps of lows during sell-offs can turn into real breakdowns quickly. Some traders use slightly stricter rules for bullish CRT setups in a falling market, such as requiring C2 to close above the midpoint, than for bearish setups in the same conditions.
Practical Example
Hypothetically, in a daily downtrend, a currency pair's 4-hour C1 runs from 1.2650 to 1.2700, just below a prior swing high. C2 trades to 1.2718 and closes at 1.2672, below the midpoint of 1.2675. It's a bearish CRT in the trend's direction at a widely watched level.
Ananya shorts early in C3 at 1.2670, with a stop at 1.2723 (above C2's high plus a 5-pip buffer) and a first target at CRL 1.2650, about 0.4R, which on its own is too small. She uses a runner target at the prior swing low of 1.2580, about 1.7R in total, and takes the trade at half her usual size because the first target is close.
Managing the Trade After Entry
Most CRT material stops at entry, stop and target. Managing the open trade decides as much of the result. These are common, simple rules. Pick one set and test it rather than improvising.
- Partial at C1's midpoint. Close a portion (for example a third) when price reaches the middle of C1's range, and move the stop to breakeven. This reduces the damage when C3 stalls halfway, which is common.
- Time stop. If C3 closes without reaching the midpoint, the expected expansion has not happened. Many traders exit at C3's close rather than holding through C4 and beyond.
- Exit on a close beyond C2's extreme. Even if the stop has not been hit by a buffer, a candle closing beyond C2's high (bearish) or low (bullish) means the sweep has turned into a breakout. Staying in is hoping, not trading.
- Runner rules decided in advance. If you hold beyond CRH or CRL, define the runner target (the next swing high or low, a previous day's high or low, an opposing fair value gap) before entry.
The Psychology of Waiting for C2 to Close
The hardest part of CRT is not reading the pattern; it is waiting. While C2 is open, the sweep looks like a breakout and every instinct says to chase it. Once C2 closes back inside, the setup looks obvious and the temptation becomes entering too early in C3 at any price.
Two habits help. Set an alert at C2's close time and stay away from the chart until then, so you only see the finished candle. And write the entry, stop and targets on paper before C3 opens. If the numbers do not meet your minimum reward-to-risk, the decision is already made. You are following a rule, not overriding a feeling. See Trading Discipline for building that habit.
Common Mistakes
- Taking setups with reward below 1R to the first target without a plan.
- Stops at CRL or CRH instead of beyond C2's extreme.
- Ignoring trend and location.
- Entering before C2 closes.
- No grading, treating all valid patterns alike.
Professional Insight
Most of the edge CRT traders describe comes from selection rather than from the pattern itself. Writing down grading criteria, and only trading the best-graded setups, matters more than refining entry tricks.
Risk Considerations
- Wide C2 wicks produce wide stops.
- Small ranges limit reward.
- Counter-trend setups fail more often.
Important Terminology
| Term | Meaning |
|---|---|
| Bullish CRT | C2 sweeps below CRL and closes back above. |
| Bearish CRT | C2 sweeps above CRH and closes back below. |
| Runner | Part of a position held beyond the first target. |
| Grading | Rating a setup's quality on set criteria. |
| Buffer | Extra distance added to a stop beyond a level. |
What is a bullish CRT setup?
C2 sweeps below C1's low and closes back above it, setting up a possible move toward C1's high.
Where does the stop go in CRT?
Beyond C2's sweep extreme, with a small buffer, not at CRH or CRL.
What is the target in CRT?
Commonly the opposite side of C1's range, with an optional runner beyond.
What if the reward to CRH is smaller than the risk?
Skip the trade, use a lower-timeframe entry to tighten the stop, or rely on a runner target with reduced size.
Are bearish CRT setups the same as bullish ones?
Yes, mirrored: sweep above CRH and close back below.
Which timeframe is best for CRT?
The 4-hour and daily charts are the most common because each candle represents a meaningful session of trading. The 1-hour chart works for intraday trading with a lower-timeframe entry. Below 1 hour, ranges are too small relative to spreads and noise.
Does CRT work on gold and indices?
The mechanics are the same on gold, indices and forex: C1 sets a range, C2 sweeps one side and closes back inside, and C3 targets the other side. Gold and indices tend to have larger C2 wicks, so stops are wider. Test each market separately rather than assuming results carry over.
What if C3 does not reach the target?
Many traders use a time stop: if C3 closes without reaching C1's midpoint, they exit or reduce. If a candle closes beyond C2's extreme, the setup has failed and the trade is closed.
Is the CRT example on this page a trade recommendation?
No. It is a historical example chosen because it shows the mechanics clearly. It does not show how often CRT setups succeed, and past price behaviour does not predict future results.
Practical Exercise
Build and use a checklist.
Your task
Step 1: Write checklists
For bullish and bearish CRT, including grading.
Step 2: Find twenty setups
On past charts.
Step 3: Grade each
Strong, average or weak.
Step 4: Record outcomes
Did strong setups reach the first target more often in your sample?
Check Your Understanding
A bearish CRT needs C2 to:
Related Lessons
Previous: Reclaim, Rejection and Continuation of a Range. Next module: CRT with Market Structure.