
CRT Strategy: Higher-Timeframe Ranges and Lower-Timeframe Entries
JustWolves is an educational platform and is not a SEBI-registered investment advisor. Trading financial instruments involves significant risk of loss and may not be suitable for all investors. Past performance is not indicative of future results. Read our full disclaimer →
What you'll learn
- A complete CRT strategy defines bias, C1 timeframe, setup rules, entry, stop, targets, management and size
- Common pairings: 4-hour CRT with 15-minute entries, 1-hour CRT with 5-minute entries
- Lower-timeframe entries can cut the stop distance substantially for the same target, at the cost of more missed trades
- Management often uses partial profit at 1R or the midpoint, then a trail toward the opposite side and beyond
- Write the whole strategy down and test it before trading it
In this article · 16 sections
The earlier modules covered CRT's parts: the reference candle, sweeps, reclaims, setups and the frameworks that add context. This lesson assembles them into one complete strategy: a higher-timeframe range and bias, a lower-timeframe entry during C3, defined stops and targets, and a management plan. It's an example to adapt and test, written so that every decision is specified in advance.
What You Will Learn
- The components of a complete CRT strategy
- How to pair higher and lower timeframes
- How lower-timeframe entries change risk
- A management plan and checklist
Before You Start
Read the CRT Foundations, Price Behaviour and Frameworks modules, especially CRT with Market Structure and CRT with SMC.
The Strategy at a Glance
| Component | Rule |
|---|---|
| Bias | Daily structure: higher highs and lows for longs, lower highs and lows for shorts |
| C1 | 4-hour candle, normal size, ideally a pullback candle at a meaningful level |
| C2 | 4-hour candle sweeps C1's low (longs) or high (shorts) and closes back inside |
| Entry | During C3, on a 15-minute break of structure or FVG pullback in the bias direction |
| Stop | Beyond the 15-minute swing that triggered entry; never wider than beyond C2's extreme |
| Targets | Partial at 1R or C1's midpoint; main target at the opposite side of C1; runner to the next swing |
| Size | Fixed risk per trade, such as 1% of capital |
| Skip | Major scheduled news during C3; reward to C1's opposite side below 1.5R |
Pairing Timeframes
- Daily CRT → 1-hour entries: swing trades, a few setups a month.
- 4-hour CRT → 15-minute entries: a balance of frequency and quality.
- 1-hour CRT → 5-minute entries: intraday, more setups and more noise.
The entry timeframe should be roughly four to twelve times smaller than the CRT timeframe: small enough to refine the entry, large enough not to be pure noise.
How Lower-Timeframe Entries Change Risk
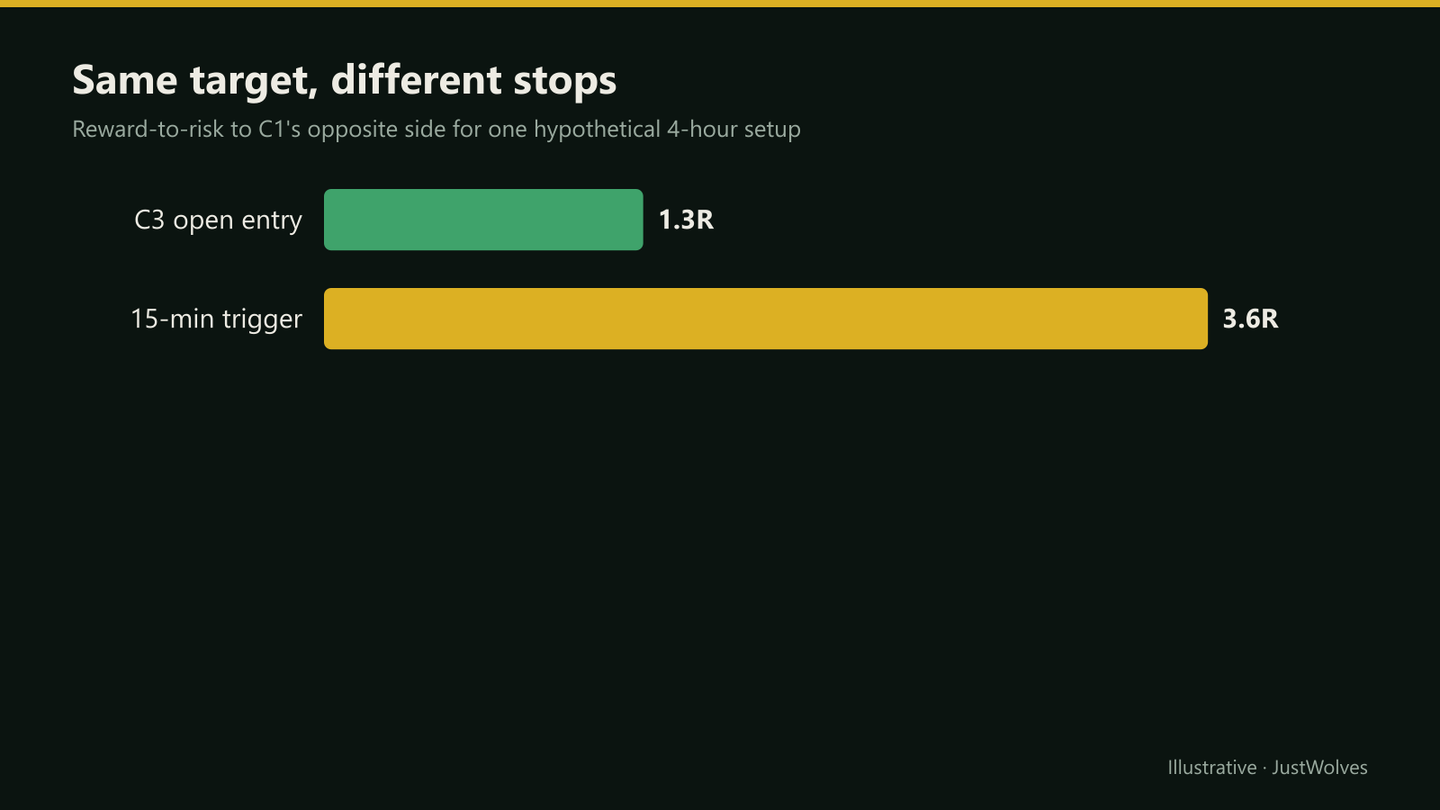
Entering at C3's open with a stop beyond C2's extreme can mean a wide stop relative to the distance to C1's opposite side. A lower-timeframe entry places the stop beyond a much smaller swing, so the same target offers a larger multiple of the risk.
The trade-off is that some setups move away without giving a lower-timeframe trigger, so you miss them, and tighter stops are hit more often by normal noise.
Management
One way to manage the trade
Step 1: Partial
Take a third at 1R or C1's midpoint, whichever comes first.
Step 2: Breakeven
Move the stop to breakeven after the partial.
Step 3: Main target
Take another third at C1's opposite side.
Step 4: Runner
Trail the last third behind 15-minute swings toward the next higher-timeframe level.
Step 5: Invalidation
Exit fully on a 4-hour close beyond C2's extreme or a daily structure break.
See the Management Rules in Action
The management steps above sound simple. The chart below shows the trade-off inside them: a partial exit and a breakeven stop that protect the trade, and a normal pullback that turns a winning trade into a small one.
Managing a CRT trade: partial, breakeven, and its cost
Step 1 of 6
C1
C1 ranges from 67.00 to 69.40, midpoint 68.20.
- What to observe
- Three levels: CRL, midpoint, CRH.
- Condition
- Mark all three.
Practical Example
Hypothetically, Nifty's daily trend is up. A 4-hour C1 runs from 24,100 to 24,220. C2 sweeps to 24,070 and closes at 24,130. Entering at C3's open (24,130) with a stop below C2 at 24,060 would risk 70 points to make 90 to CRH: about 1.3R.
Instead, Karthik waits. On the 15-minute chart, price breaks a minor swing high at 24,150 and pulls back to 24,148; he buys there with a stop at 24,128, below the 15-minute swing low. Risk is 20 points; CRH is 72 points away, about 3.6R. Before taking the trade, he checks the daily chart for room above CRH and finds the next resistance at 24,300. Costs widen the gap between the two entries. On one Nifty futures lot, round-trip charges are about 14 points at discount-broker rates: the C3-open entry becomes roughly 76 points of reward for 84 of risk, about 0.9R net, while the refined entry is roughly 58 for 34, about 1.7R net.
How These Rules Performed on Real Data
JustWolves tested a version of this strategy's core rules on real 4H data (EUR/USD, GBP/USD, USD/JPY and gold, May–November 2026). Rules tested: daily bias in the setup's direction (daily close above a rising 20-day average for longs, the mirror for shorts); reward to CRH of at least 1R at C3's open; half the position closed at C1's midpoint with the stop then moved to entry; the rest targeted at CRH; trades closed after C4. The lower-timeframe entry could not be tested, because it needs months of 5- to 15-minute data we do not have. Costs were excluded.
| Version | Trades | Winning trades | Average result |
|---|---|---|---|
| Plain CRT, every valid setup | 830 | 45% | −0.06R |
| Strategy rules (bias + ≥1R + partial and breakeven) | 182 | 54% | −0.09R |
| Plain CRT when the daily chart had no clear trend | 167 | 56% | +0.21R |
The rules did what rules like these usually do: they raised the win rate (from 45% to 54%) and cut the number of trades by more than three quarters. They did not improve the average result. Partial exits and breakeven stops turn some losers into small wins, but they also cut many winners short, and the two effects roughly cancelled out.
The most interesting row is the last one. In this sample, the plain pattern taken when the daily chart was not trending was the only version with a clearly positive average. That points to a different strategy from the one above: a range-focused CRT strategy, where C1 sits at the edge of a higher-timeframe range and the target is the other side of that range. It is a hypothesis worth testing, not a proven edge; see CRT with Market Structure for the details.
Pre-Trade Checklist
- Daily bias agrees with the setup direction.
- C1 is normal-sized and at a meaningful level.
- C2 swept and closed back inside, with the close ideally beyond C1's midpoint.
- A lower-timeframe trigger has formed in the bias direction.
- Reward to C1's opposite side is at least 1.5R.
- No major scheduled news during C3.
- Position size matches the fixed risk per trade.
Improving the Strategy Without Fooling Yourself
Once you have a first set of results, the temptation is to keep adding conditions until the backtest looks good. That process almost always produces a strategy that fits the past and fails in the future. A more reliable approach:
- Change one rule at a time, and record the result of each change, including the ones that made things worse.
- Prefer removing rules to adding them. If a rule does not clearly improve results per setup, drop it. Fewer rules mean more trades and more reliable statistics.
- Keep a hold-out period. Develop rules on one period of data, then check them once on a later period you have not looked at. If the result collapses, the rule was fitted to noise.
- Watch the trade count. A version with 30 trades and a great average is weaker evidence than one with 300 trades and a modest average.
The full testing process is covered in How to Backtest CRT.
Common Mistakes
- Changing timeframes from trade to trade.
- Using lower-timeframe triggers against the bias.
- Stops tighter than the market's normal noise.
- No written management plan.
- Trading the strategy before testing it.
Professional Insight
The value of writing a complete strategy is that every trade becomes comparable. After fifty trades with identical rules, you can see exactly which part of the strategy is helping and which isn't, something impossible when rules change with each trade.
Risk Considerations
- Tight stops increase the loss rate.
- Missed trades are a normal cost of LTF entries.
- News can overwhelm any setup.
Important Terminology
| Term | Meaning |
|---|---|
| HTF | Higher timeframe, used for C1, C2 and bias. |
| LTF | Lower timeframe, used to refine entries. |
| LTF trigger | A lower-timeframe signal, such as a break of structure, that times the entry. |
| Runner | Part of the position held beyond the main target. |
| Breakeven stop | A stop moved to the entry price. |
What is a CRT strategy?
A complete set of rules using the CRT model, covering bias, setup, entry, stop, targets, management and position size.
Which timeframes work best together?
Common pairs are daily with 1-hour, 4-hour with 15-minute, and 1-hour with 5-minute.
Why use a lower-timeframe entry?
It can tighten the stop for the same target, improving reward-to-risk, at the cost of missing some setups.
How should I manage a CRT trade?
One common approach is a partial at 1R or the midpoint, a main target at C1's opposite side, and a trailed runner.
Should I move my stop to breakeven?
It reduces losses but also cuts some winners; test it on your market.
Does moving the stop to breakeven improve CRT results?
Not on average in our test. Combined with a partial exit at the midpoint, it raised the win rate but the average result per trade stayed about the same, because it also stopped out trades that would have reached the target after a normal pullback.
What is a good CRT strategy for beginners?
Start with the plain rules (valid C2, stop beyond C2, target the opposite side of C1, skip setups under 1R), one market and one timeframe, and log every setup. Add or remove one rule at a time based on your own results rather than adopting a complex rule set on trust.
Practical Exercise
Write your CRT strategy.
Your task
Step 1: Fill the table
Every component, with exact rules.
Step 2: Choose timeframes
One CRT and one entry timeframe.
Step 3: Write the checklist
And the skip conditions.
Step 4: Paper-trade ten setups
Following the rules exactly.
Check Your Understanding
A common entry timeframe for 4-hour CRT is:
Related Lessons
Previous module: CRT with ICT Concepts. Next: CRT Entry Models.