
Range Formation and Range Expansion
JustWolves is an educational platform and is not a SEBI-registered investment advisor. Trading financial instruments involves significant risk of loss and may not be suitable for all investors. Past performance is not indicative of future results. Read our full disclaimer →
What you'll learn
- Markets alternate between range formation (contraction) and range expansion
- A CRT setup is a failed expansion on one side followed by expansion toward the other
- Small, overlapping candles often precede larger expansion candles
- Inside candles and narrow ranges make tight, clearly defined C1 ranges
- Expansion beyond the opposite side of C1's range is possible but not a given
In this article · 17 sections
Markets move in a rhythm: periods where candles shrink and overlap, followed by periods where they stretch and travel. CRT sits inside that rhythm. C1 is a range, C2 is an attempted expansion that fails, and C3 is the expansion in the other direction. Understanding how ranges form and expand helps you judge which C1 candles are worth watching and how far a CRT move might travel.
What You Will Learn
- The contraction–expansion cycle
- How CRT fits into it
- Why narrow ranges and inside candles make useful C1s
- How far expansions tend to travel, and why that varies
Before You Start
Read The Reference Candle and, from the Candlestick course, Inside Bars and Outside Bars.
Contraction and Expansion
During contraction, candles get smaller and overlap: buyers and sellers are roughly balanced and price stays within a narrowing band. During expansion, one or more large candles carry price decisively in one direction.
The cycle repeats on every timeframe. A quiet morning session can be a contraction on the 15-minute chart inside a single daily candle that later becomes a large expansion candle.
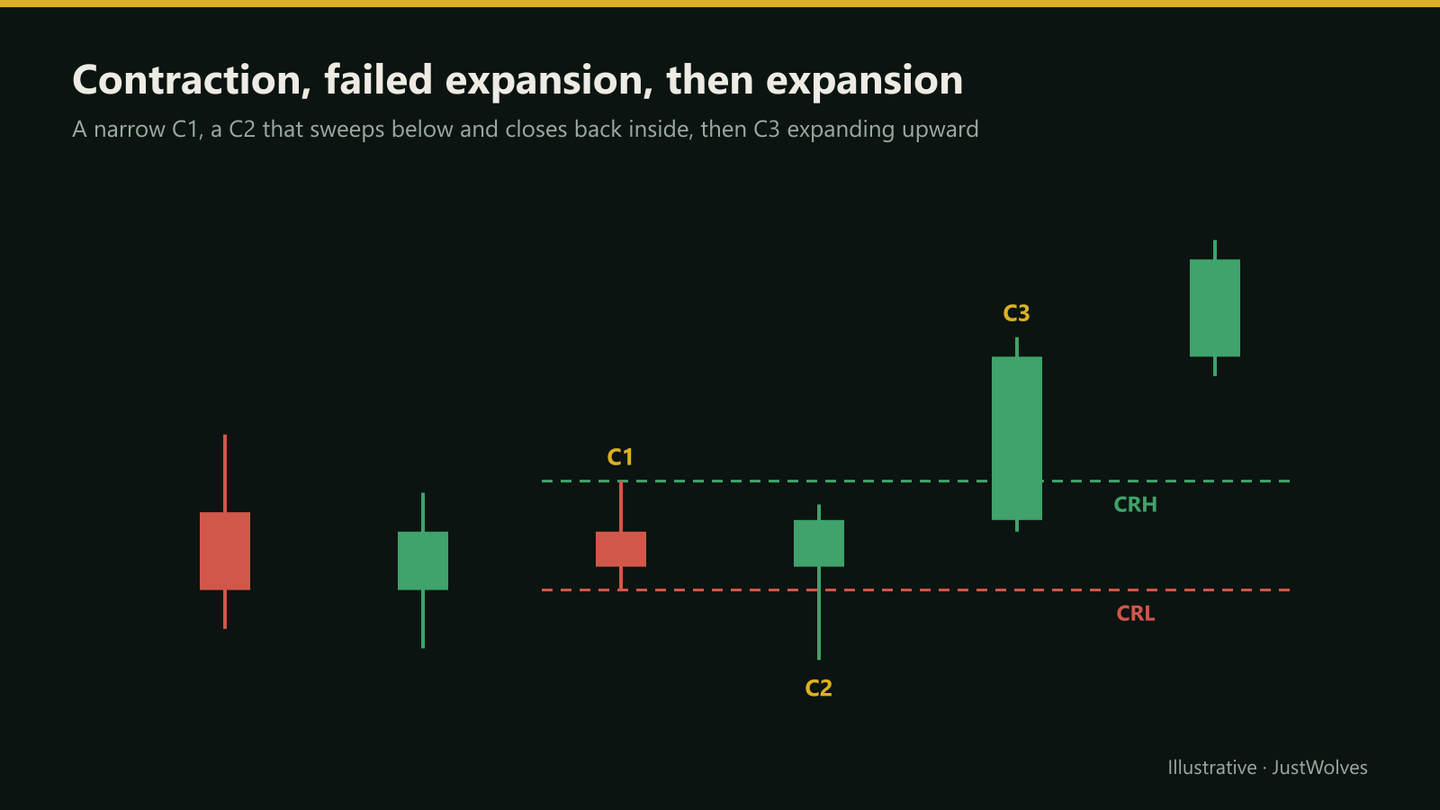
CRT in the Cycle
- C1: a range, often part of a contraction.
- C2: an attempt to expand on one side that fails and closes back inside.
- C3: expansion in the opposite direction, toward and sometimes beyond the other side of the range.
The Cycle, Step by Step
The chart below shows the sequence as it is usually taught: normal candles, a contraction, a small C1, a sweep, and an expansion. Step through it, then read what the real data shows about how often that last step happens on schedule.
Contraction, a sweep, then expansion
Step 1 of 5
A normal market
Candles of ordinary size move price up and down.
- What to observe
- Typical candle size: about 1.2 points.
- Condition
- Nothing to do.
Narrow Ranges and Inside Candles
A C1 that's narrower than recent candles, or an inside candle sitting within the previous candle's range, gives tight, clearly defined levels. Sweeps of such ranges are easy to identify, and stops beyond C2 stay manageable.
The trade-off is distance: a narrow range means the opposite side is close, so the first target is small. Many traders use narrow-range C1s when they expect expansion to continue beyond the opposite side.
Does a Narrow Candle Predict Expansion?
JustWolves checked this on about 12,000 real 4H candles from EUR/USD, GBP/USD, USD/JPY and gold (two years of data). We grouped each candle by its size relative to the average of the previous 14 candles, then measured the size of the next candle.
| Candle type | Candles | Next candle size (vs average) | Next candle large (over 1.5× average) |
|---|---|---|---|
| Narrow (under half the average) | 908 | 0.79× | 6% |
| Inside candle | 2,077 | 0.89× | 11% |
| Normal | 7,460 | 1.04× | 15% |
| Wide (over 1.5× the average) | 1,839 | 1.31× | 29% |
The result is the opposite of the popular shortcut. Small candles were usually followed by more small candles, and large candles by more large ones. A large candle came straight after a narrow one only 6% of the time, less than half as often as after a normal candle. This is a well-known property of markets called volatility clustering: quiet periods tend to stay quiet for a while, and busy periods stay busy.
Contraction does eventually end, and many big moves do start from quiet ranges. What the data does not support is timing: a narrow C1 does not mean C3 is about to expand. For CRT, this has two practical consequences:
- Expect slow follow-through from small ranges. A tight C1 gives a tight stop, but price often drifts rather than expands, so time stops matter.
- Session changes matter more than candle size. The quiet-session ranges that do expand usually do so when a busier session opens, not simply because the range was small. See ICT Kill Zones for the hourly activity data.
How Far Expansion Travels
The opposite side of C1's range is the natural first target, because it's the next level with resting orders. Whether price goes further depends on context: a CRT in the direction of the higher-timeframe trend, with no nearby resistance beyond CRH, has more room than one trading into a major level.
Many CRT traders take partial profit at the opposite side of the range and manage the rest with a trailing stop, accepting that some trades will stop at the range and others will extend.
Expansion Through the Session
Expansion is often tied to activity. In forex, quieter sessions frequently form ranges that the London or New York sessions then sweep and expand from. In Indian indices, the first hour after the 9:15 am open and the hours around global events tend to produce more expansion than the quieter middle of the day.
Matching C1 to a quieter period and watching C2 and C3 form in a more active one is a common way to apply CRT intraday. The higher-timeframe version uses the same idea with daily candles: a narrow day followed by a sweep of its high or low the next day.
When Expansion Fails
Not every C3 expands. Sometimes price closes back inside the range, drifts, and the next candle sweeps the other side instead. That's a sign the market is still contracting. Traders who see C3 stall near the midpoint often reduce their position or exit, rather than waiting for an expansion that the market isn't delivering.
Practical Example
Hypothetically, a currency pair's 4-hour candles shrink through a quiet Asian session. The narrowest candle, C1, runs from 1.0840 to 1.0868. The next 4-hour candle sweeps to 1.0828, below CRL, and closes at 1.0852.
Meera buys early in C3 at 1.0854 with a stop below C2's low at 1.0822, taking half profit at CRH 1.0868 and trailing the rest. The pair expands through London to 1.0905, where she exits the remainder.
Measuring Contraction Objectively
"The candles are getting smaller" is easy to say and hard to test. Three objective definitions are common, and any of them will do if you apply it consistently:
- Range ratio: the candle's range divided by the average range of the last 10–20 candles. Below 0.5 counts as narrow. This is the definition used in our study above.
- NR4 / NR7: the narrowest range of the last 4 (or 7) candles. A classic definition from short-term trading literature.
- Inside candles: a candle whose high and low both sit within the previous candle's range. Two or more in a row mark a clear contraction.
Write your definition down before testing. If you judge contraction by eye, you will tend to notice it most on charts where a big move followed, which makes the idea look better than it is.
Wide Candles Are Information Too
The flip side of our finding is more practical than the original rule. A wide candle tells you the next one is likely to be wide as well: after a candle more than 1.5 times the average, the next candle was large 29% of the time, about double the normal rate. For CRT, that matters in two ways. A C2 that sweeps during a volatile period needs a larger stop buffer, because noise is larger. And a C1 formed during a wide-candle phase gives a large range with more room to the opposite side, which our data suggested was no disadvantage. Size positions from the actual stop distance, as covered in Position Sizing.
Common Mistakes
- Expecting every contraction to resolve the same way.
- Using very narrow C1s where costs exceed the range.
- Assuming expansion beyond CRH on every trade.
- Ignoring session timing: quiet sessions often produce false moves.
- Trading expansions into major levels.
Professional Insight
Many intraday traders watch for contraction in a quieter session followed by a sweep and expansion when a more active session opens. CRT gives that common pattern a precise, rule-based shape.
Risk Considerations
- Expansion direction is uncertain until it happens.
- False expansions occur in choppy markets.
- News-driven expansion can be violent in either direction.
Important Terminology
| Term | Meaning |
|---|---|
| Contraction | A period of shrinking, overlapping candles. |
| Expansion | A period of large candles moving decisively. |
| Narrow-range candle | A candle smaller than recent candles. |
| Inside candle | A candle within the previous candle's range. |
| Failed expansion | A move beyond a range that closes back inside. |
What is range expansion?
A period when candles grow larger and price moves decisively after a contraction.
How does CRT relate to range expansion?
C2 is a failed expansion on one side of C1's range; C3 is the expansion toward the other side.
Are narrow ranges better for CRT?
They give tight levels and stops, but their first target is close; context decides whether expansion continues.
Does contraction predict direction?
No. It suggests a larger move may follow, but not which way.
How far does a CRT move go?
Usually at least toward the opposite side of C1's range; beyond that depends on trend and levels.
Does contraction lead to expansion in trading?
Over time, quiet periods do give way to active ones. But in our study of about 12,000 real 4H candles, a narrow candle was usually followed by another small one: the next candle was large only 6% of the time, compared with 15% after a normal candle.
Are inside candles good CRT reference candles?
They give tight, clear levels and small stops. Our data shows the candle after an inside candle tends to be smaller than average, so expect slower follow-through and plan time stops accordingly.
Practical Exercise
Study contraction before CRT.
Your task
Step 1: Find ten valid CRT setups
On your chosen timeframe.
Step 2: Check C1's size
Narrower or wider than the last ten candles?
Step 3: Measure C3's move
Did it reach the opposite side? Go beyond?
Step 4: Compare
Did narrow-range C1s behave differently in your sample?
Check Your Understanding
Contraction is:
Related Lessons
Previous: The Reference Candle. Next: Liquidity Around Candle Ranges. See also Consolidation and Trading Ranges.