Inside Bars and Outside Bars
JustWolves is an educational platform and is not a SEBI-registered investment advisor. Trading financial instruments involves significant risk of loss and may not be suitable for all investors. Past performance is not indicative of future results. Read our full disclaimer →
What you'll learn
- An inside bar's whole range (high and low) sits inside the previous candle's range, called the mother bar
- An outside bar's range covers the previous candle's whole range, high and low
- Inside bars show contraction; they're commonly traded as breakouts of the mother bar
- Outside bars show expansion; their close shows which side won the wider range
- Inside bars in the trend's direction are generally preferred to counter-trend ones
In this article · 16 sections
Inside and outside bars compare a candle's full range, wicks included, with the candle before. An inside bar fits entirely within the previous range, a moment of contraction. An outside bar extends beyond both ends, a moment of expansion. They're closely related to the harami and engulfing patterns, but measured on ranges rather than bodies. This lesson covers both and the common ways traders use them.
What You Will Learn
- What inside and outside bars are
- How they differ from harami and engulfing
- How to trade inside bar breakouts
- How to read outside bars
Before You Start
Read Harami Patterns and Bullish and Bearish Engulfing Patterns first.
Inside Bars
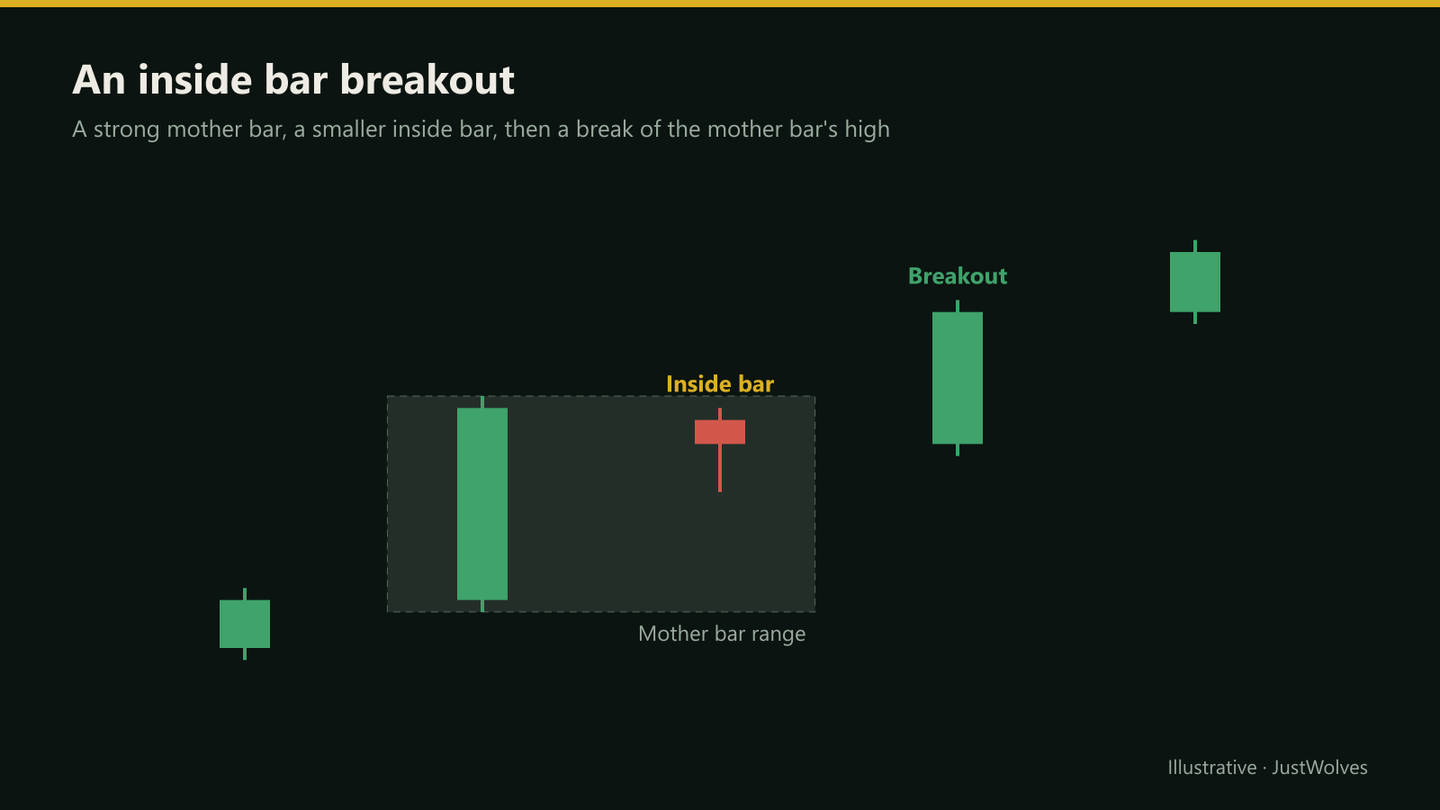
An inside bar has a lower high and a higher low than the previous candle, so its full range sits inside the previous range. The previous candle is called the mother bar.
Inside bars show contraction: after the mother bar's range, the market traded in a narrower band. They're common after strong moves, as a pause before the next one.
Outside Bars
An outside bar has a higher high and a lower low than the previous candle, so it covers the whole previous range. It shows expansion: price explored both directions further than the previous period.
The close tells you who won. An outside bar that closes near its high after a decline is a strong bullish signal, often also a bullish engulfing pattern. One that closes in the middle shows volatility without a winner.
How They Relate to Harami and Engulfing
| Pattern | Compares | Second candle |
|---|---|---|
| Harami | Bodies | Body inside the previous body |
| Inside bar | Full ranges | Whole range inside the previous range |
| Engulfing | Bodies | Body covers the previous body |
| Outside bar | Full ranges | Whole range covers the previous range |
Every inside bar is a harami in body terms only if its body also sits inside the previous body, and not every harami is an inside bar, because its wicks can poke outside. The range-based versions are stricter.
Trading Inside Bars
Inside bar breakout in an uptrend
Step 1: Trend
A clear uptrend on the trading timeframe.
Step 2: Pattern
An inside bar after a strong bullish mother bar, ideally near a level that has just broken.
Step 3: Entry
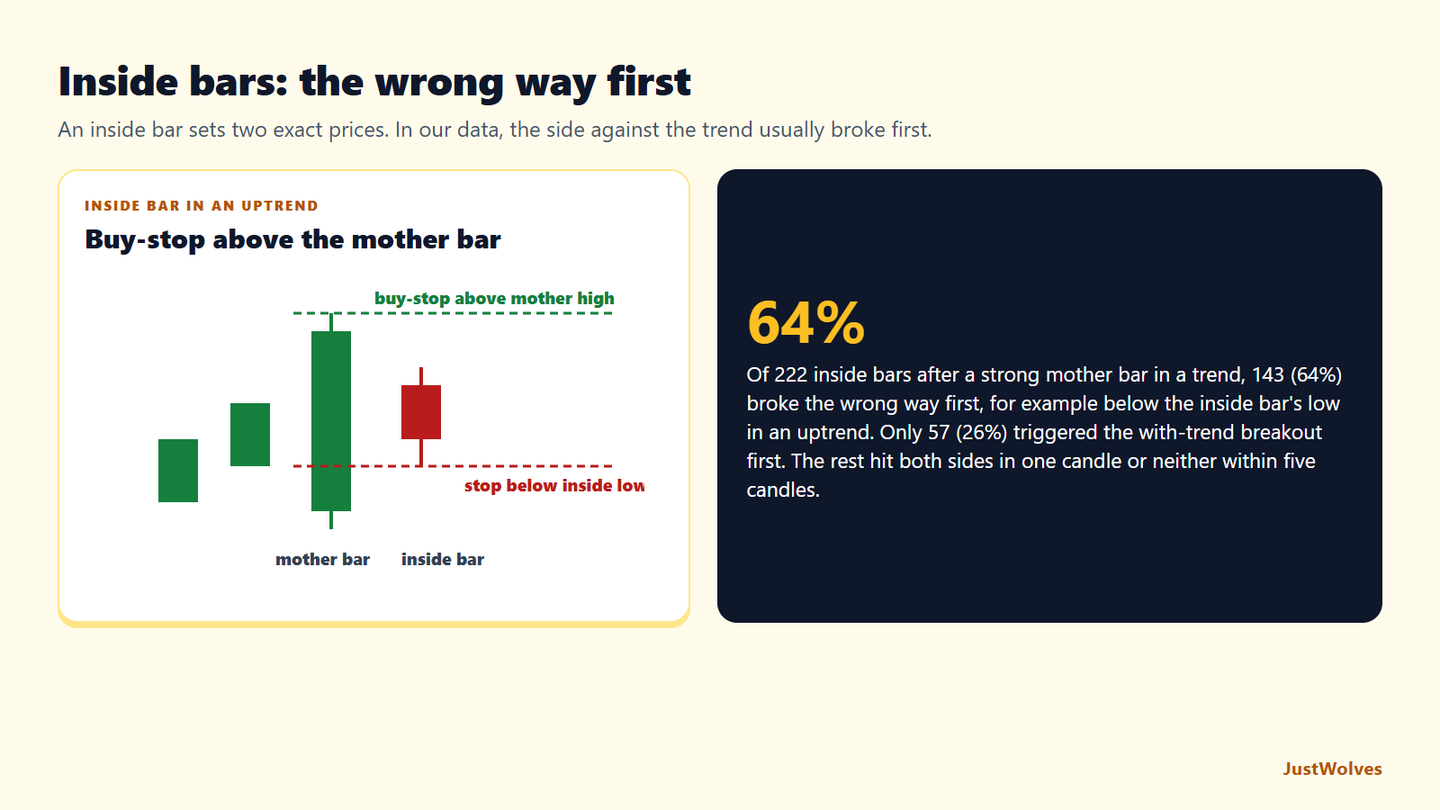
Buy-stop just above the mother bar's high (some traders use the inside bar's high for a tighter entry).
Step 4: Stop
Below the mother bar's low, or below the inside bar's low for a tighter stop.
Step 5: Target
The next resistance, or a multiple of the risk.
Real Case: A Bharti Airtel Inside Bar Breakout
The chart below uses real daily candles for Bharti Airtel from October and November 2026. Step through it to see the setup from this lesson on a real chart: a strong mother bar in an uptrend, an inside bar, a buy-stop triggered on a small gap, and a move to the 2R target.
Real case: an inside bar breakout, Bharti Airtel, October–November 2026
Step 1 of 5
An uptrend
Bharti Airtel turns up from 1,756 on 13 October 2026 and climbs to 1,917.5 by 26 October, holding higher lows.
- What to observe
- A clear uptrend on the daily chart.
- Condition
- Look for a pause to join it.
Reading Outside Bars
Because an outside bar runs stops on both sides of the previous candle, it often appears at turning points and around news. The useful questions are where it formed and how it closed. A bullish outside bar at support after a decline, closing in its top quarter, shows sellers pushing below the previous low and buyers then taking price above the previous high. That's a strong shift, and the pattern low gives a clear stop.
An outside bar that closes near its middle shows only that volatility increased. Many traders simply wait for the next candle in that case. In ranges, frequent outside bars are a sign of choppy, two-way trading where breakout methods tend to struggle.
Which Way Do Inside Bars Break? Our Test
JustWolves tested the inside bar breakout from this lesson on about two years of real daily candles for 20 large NSE stocks, NIFTY 50, four currency pairs and gold, and six months of hourly candles for the five markets. Setup: a trend (price at least two average ranges beyond its level 20 candles earlier), a mother bar in the trend's direction with a body of at least one average range, and an inside bar. Orders: a stop order beyond the mother bar's far end, with the protective stop beyond the inside bar. We recorded which side broke first over the next five candles, and the result of the trades that triggered, with a 2R target. Downtrends were tested on mirrored prices.
| Group | Cases | With-trend breakout first | Wrong way first | Both in one candle |
|---|---|---|---|---|
| Daily, uptrends | 37 | 11 | 22 | 4 |
| Daily, downtrends | 49 | 15 | 31 | 2 |
| Hourly, uptrends | 58 | 13 | 38 | 5 |
| Hourly, downtrends | 78 | 18 | 52 | 3 |
| All groups | 222 | 57 (26%) | 143 (64%) | 14 (6%) |
The headline is uncomfortable for a popular setup: in nearly two cases out of three, price broke the inside bar the wrong way before it triggered the with-trend entry. With a stop order this does not cost anything directly, since the entry was never filled, but it shows that an inside bar is not a coiled spring pointing in the trend's direction. It is a pause, and pauses resolve both ways, just as the harami lesson found.
The trades that did trigger were mixed and the samples are small:
| Group | Result |
|---|---|
| Daily, uptrends | 11 trades, 9% wins, −0.73R |
| Daily, downtrends (short) | 15 trades, 47% wins, +0.40R |
| Hourly, uptrends | 13 trades, 38% wins, +0.15R |
| Hourly, downtrends (short) | 18 trades, 33% wins, 0.00R |
We also tested this lesson's outside bar idea: after a decline, an outside bar closing in the top quarter of its range, bought at the close with the stop below its low. It averaged −0.20R on daily charts (15 trades) and −0.06R on hourly charts (16), with the mirror-image bearish version at +0.14R daily (21) and −0.44R hourly (27). None of these is a reliable edge on its own. The warning in this lesson, that false breaks are common and need a plan, is the part the data supports most clearly.
Practical Example
Hypothetically, a stock in an uptrend breaks above resistance at ₹540 with a mother bar from ₹532 to ₹556. The next candle trades between ₹545 and ₹553: an inside bar.
Rahul places a buy-stop at ₹557, above the mother bar's high, with a stop at ₹544, just below the inside bar's low. His target is ₹595, the next resistance: ₹13 of risk for ₹38 of reward. The order triggers two days later.
Measuring the Bharti Airtel Setup
| Measure | Values | Result |
|---|---|---|
| Mother bar range | 1,910.6 to 1,978.8 | 68.2 points, closed at its high |
| Inside bar range | 1,926.6 to 1,970.8 | 44.2 points, 65% of the mother bar |
| Planned entry and stop | 1,979 and 1,921 | 58 points of risk |
| Actual fill | Opened at 1,981 on 30 October | 2 points of slippage on a gap |
| Target | About 2R from the actual fill | About 2,101, reached on 6 November |
Two details are worth noticing. First, the protective stop sits below the inside bar, not the mother bar, which keeps the risk to 58 points instead of about 75 with a stop below the mother bar's low. That is the main attraction of the setup: a precise entry and a tighter stop than the mother bar alone would give. Second, the fill came on a small gap, two points above the order. On stocks that gap often, it is sensible to plan with a little slippage, as this example does, rather than assume a perfect fill.
Common Mistakes
- Trading inside bars against strong trends.
- Using tiny inside bars on low timeframes, which are noise.
- Ignoring the mother bar's size; huge mother bars mean wide stops.
- Treating mid-close outside bars as signals.
- No plan for false breaks.
Professional Insight
Inside bars appeal to many traders because they define both entry and stop with exact prices before the breakout happens. The contraction-then-expansion idea behind them also appears at larger scales, in flags and volatility contraction before breakouts.
Risk Considerations
- False breaks are frequent.
- Gaps can trigger stop orders far from the planned price.
- Several consecutive inside bars can make the setup ambiguous.
Important Terminology
| Term | Meaning |
|---|---|
| Inside bar | A candle whose full range sits within the previous range. |
| Mother bar | The candle that contains the inside bar. |
| Outside bar | A candle whose range covers the previous candle's range. |
| Contraction | A narrowing of ranges. |
| Expansion | A widening of ranges. |
What is an inside bar?
A candle whose high is lower and low is higher than the previous candle's, so its range sits inside the previous one.
What is a mother bar?
The candle before an inside bar, whose range contains it.
How do you trade an inside bar?
Commonly with a stop order beyond the mother bar's high or low in the trend's direction, and a stop on the other side.
What is an outside bar?
A candle with a higher high and lower low than the previous candle, covering its whole range.
Is an inside bar the same as a harami?
Not exactly. A harami compares bodies; an inside bar compares full ranges including wicks.
Do inside bars usually break out in the direction of the trend?
Not in our data. Of 222 inside bars after a strong mother bar in a trend, 64% broke the wrong way first, beyond the inside bar's far end, before triggering the with-trend entry. Only 26% triggered the with-trend breakout first.
Where should the stop go on an inside bar breakout?
A common choice, used in this lesson and in our test, is just beyond the inside bar's far end. It is tighter than a stop beyond the mother bar, so the risk per trade is smaller, but it is also reached more easily.
Practical Exercise
Test inside bar breakouts.
Your task
Step 1: Find twenty inside bars
Ten with the trend, ten against it, on daily charts.
Step 2: Apply the breakout rule
Entry beyond the mother bar, stop on the other side.
Step 3: Record outcomes
Which broke first, and did it reach 2R?
Step 4: Compare
With-trend versus counter-trend results in your sample.
Check Your Understanding
An inside bar has:
Related Lessons
Previous: Tweezer Tops and Bottoms. Next module: Morning Star and Evening Star. See also Continuation Patterns.