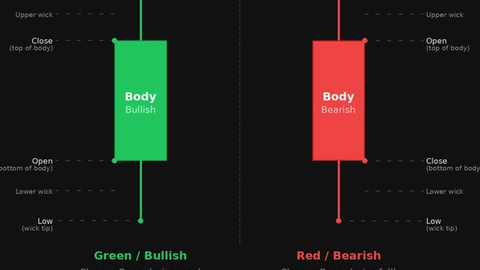
Bullish and Bearish Engulfing Patterns
JustWolves is an educational platform and is not a SEBI-registered investment advisor. Trading financial instruments involves significant risk of loss and may not be suitable for all investors. Past performance is not indicative of future results. Read our full disclaimer →
What you'll learn
- An engulfing pattern is two candles: the second body completely covers the first body, in the opposite direction
- Bullish engulfing follows a decline; bearish engulfing follows a rise
- Stronger versions: a large second body, a close beyond the first candle's range, and a key level
- The second candle's close is already the confirmation many traders use
- Stop beyond the pattern's extreme; target the next opposing level
In this article · 16 sections
The engulfing pattern is one of the most widely used two-candle patterns. In a single period, one side not only stops the previous move but more than reverses it, swallowing the entire body of the candle before. This lesson covers how to identify bullish and bearish engulfing patterns, how to judge their strength, and how to trade them with a defined stop.
What You Will Learn
- How bullish and bearish engulfing patterns form
- What makes an engulfing pattern strong or weak
- How to trade it with entries, stops and targets
- Common failure situations
Before You Start
Read Pin Bars and Bullish vs Bearish Candles and Candle Strength first.
The Pattern
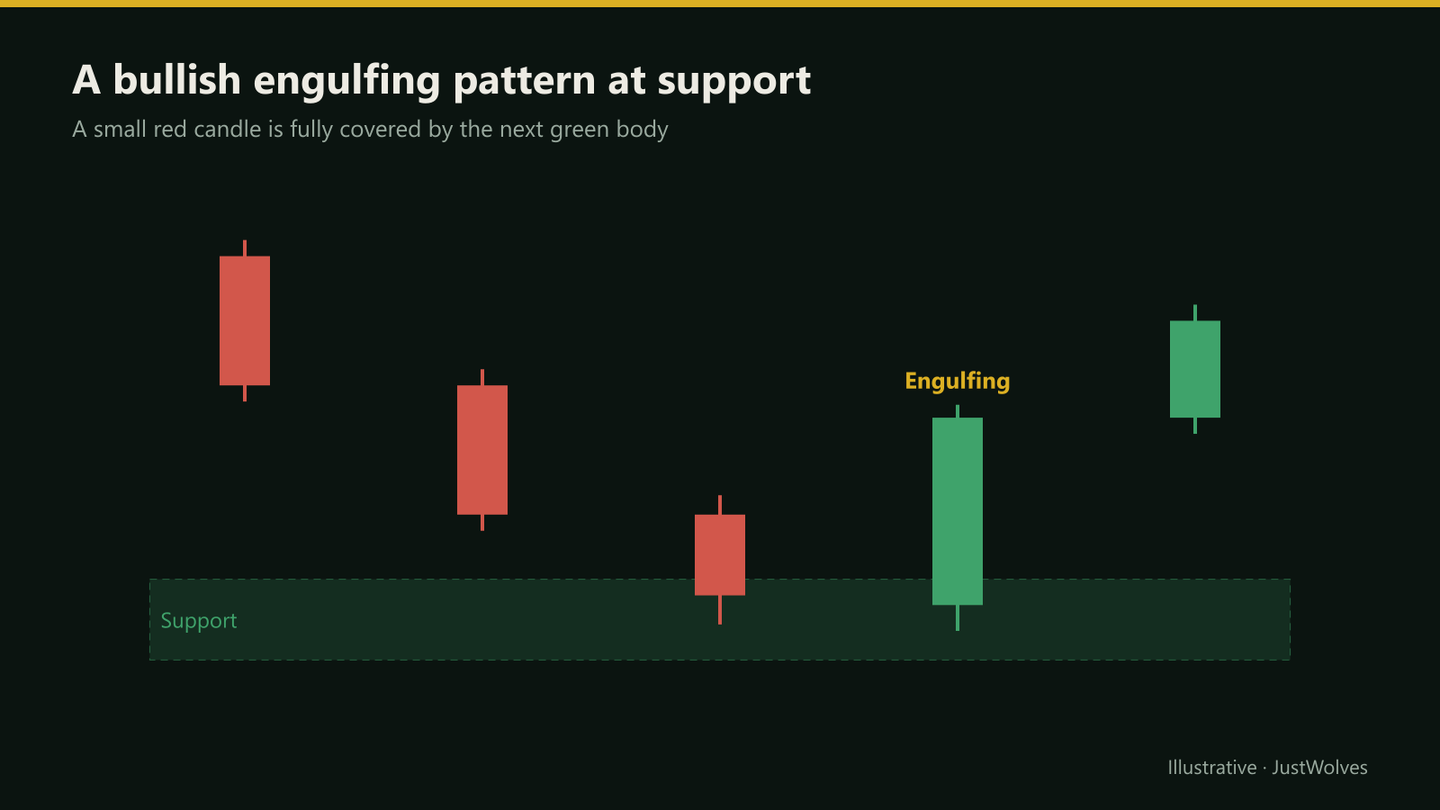
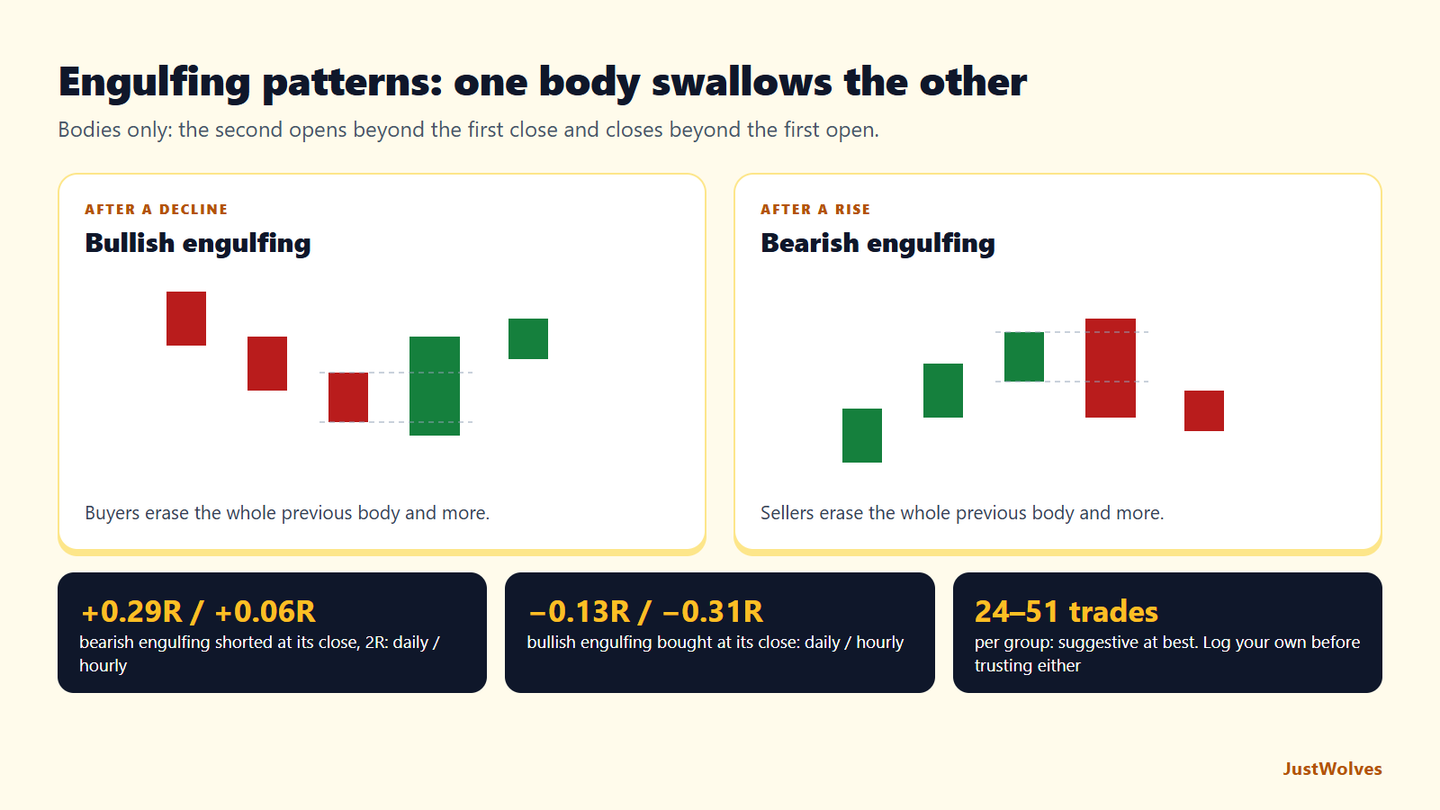
- Bullish engulfing: after a decline, a bearish candle is followed by a bullish candle whose body completely covers the first candle's body. The second candle opens at or below the first close and closes above the first open.
- Bearish engulfing: after a rise, a bullish candle is followed by a bearish candle whose body covers the first body. It opens at or above the first close and closes below the first open.
Strict definitions compare bodies only; wicks don't need to be engulfed. In continuous markets like forex, where one candle usually opens at the previous close, the second candle often opens level with the first close rather than beyond it.
Judging Strength
| Feature | Stronger | Weaker |
|---|---|---|
| Second body size | Much larger than the first and than recent candles | Barely covers the first body |
| Close | Beyond the first candle's high (bullish) or low (bearish) | Just past the first open |
| Location | At a key level after a clear move | Mid-range |
| Trend | In the direction of the higher-timeframe trend | Against a strong trend |
Trading the Engulfing Pattern
Bullish engulfing at support
Step 1: Level
Mark support or a demand zone before price arrives.
Step 2: Pattern
A bullish engulfing candle forms at the level.
Step 3: Entry
At the close of the engulfing candle, or on a pullback toward its midpoint.
Step 4: Stop
Below the lower of the two candles' lows.
Step 5: Target
The next resistance; skip the trade if it's too close.
Real Case: A Bullish Engulfing on ICICI Bank
The chart below uses real daily candles for ICICI Bank from May and June 2026. Step through it to see a bullish engulfing pattern at a 20-day low and the trade that followed.
Real case: a bullish engulfing at a 20-day low, ICICI Bank, June 2026
Step 1 of 4
The decline
ICICI Bank falls from 1,301.8 on 26 May 2026 to 1,220.7 on 2 June, five red candles in a row.
- What to observe
- Sellers in control.
- Condition
- Watch for a sign that buyers have taken over.
When Engulfing Patterns Fail
Engulfing patterns fail most often in three situations. First, against a strong trend: a bullish engulfing in a steep downtrend is often just a one-day bounce. Second, in choppy ranges, where large alternating candles engulf each other constantly. Third, when the engulfing candle is very large, making the stop so wide that even a successful trade has a poor reward relative to risk.
A useful filter is to ask whether the pattern would still be interesting without its name. A large bullish candle at well-marked support after a fall is worth noting whether or not it technically engulfs the previous body.
Bearish Engulfing in Practice
The bearish version works the same way at resistance. After a rally into a supply zone or prior high, a green candle is followed by a red candle that opens at or above its close and finishes below its open. The stop goes above the higher of the two highs, and the target is the next support. Bearish engulfing patterns that also take out the previous candle's low are generally considered the stronger form.
How Do Engulfing Patterns Perform? Our Test
JustWolves tested both versions on about two years of real daily candles for 20 large NSE stocks, NIFTY 50, four currency pairs and gold, and six months of hourly candles for the five markets. Bullish engulfing: after a fall of at least 1.5 average ranges over five candles, a bearish candle followed by a larger bullish candle that opens at or below its close and closes at or above its open. Bearish engulfing: the mirror image after a rise. Trades: at the engulfing candle's close, stop beyond the pattern, 2R target.
| Setup | Daily | Hourly |
|---|---|---|
| Bullish engulfing, at the close | 24 trades, 29% wins, −0.13R | 39 trades, 23% wins, −0.31R |
| Bullish engulfing at a 20-candle low | 18 trades, 33% wins, 0.00R | 23 trades, 22% wins, −0.35R |
| Bearish engulfing, at the close | 35 trades, 43% wins, +0.29R | 51 trades, 35% wins, +0.06R |
| Bearish engulfing at a 20-candle high | 20 trades, 50% wins, +0.50R | 24 trades, 38% wins, +0.13R |
| Control: any candle, same trade | about 2,200 trades, −0.02 to −0.03R | about 2,500 trades, −0.07 to −0.10R |
The two versions behaved differently in this sample. Bearish engulfing patterns did better than the control, especially at 20-day highs (+0.50R on daily charts). Bullish engulfing patterns did worse than the control, particularly on hourly charts.
Two cautions before reading too much into this. The samples are small, 18 to 51 trades per row, so a handful of trades changes the picture. And the period tested includes particular market conditions; a different two years could look different. What the data does support is this lesson's own advice in "When Engulfing Patterns Fail": the pattern's name adds little on its own, and location, trend and the size of the stop decide whether a given engulfing candle is worth trading.
Practical Example
Hypothetically, a chemical stock falls from ₹720 to ₹652 into support at ₹645–₹652. One session opens at ₹656 and closes at ₹650. The next opens at ₹648 and closes at ₹668, covering the previous body, with a low of ₹643.
Kavya buys at the close, ₹668, with a stop at ₹638 below the pattern's low, targeting ₹720 at the previous high: ₹30 of risk for ₹52 of reward.
Checking the Engulfing Rule Precisely
| Test | Values | Result |
|---|---|---|
| Second candle opens at or below the first close | 1,219.9 ≤ 1,226.6 | Yes |
| Second candle closes at or above the first open | 1,242.0 ≥ 1,233.0 | Yes |
| Second body larger than the first | 22.1 vs 6.4 | Yes |
| Context: after a decline, at a low | 20-day low at 1,213.7 | Yes |
Notice that the first candle was small (a 6.4-point body). Engulfing a small body is easy; many traders give more weight to patterns where the second candle engulfs a full-sized first candle, or also takes out the first candle's high. Whatever rule you use, write it down and apply it the same way to every candidate, so your results mean something.
Common Mistakes
- Ignoring location.
- Counting wick-only engulfing as the full pattern.
- Trading every engulfing candle in a range.
- Stops inside the pattern.
- Chasing very large engulfing candles without adjusting size.
Professional Insight
Many traders treat the engulfing pattern as a clear trigger once context and location are already in place, as covered in Price Action Entry Triggers and Confluence. Its value comes from showing a shift in control at exactly the place you were already watching.
Risk Considerations
- Large engulfing candles mean wide stops.
- Counter-trend patterns fail more often.
- Gaps can change how stocks' patterns look on daily charts.
Important Terminology
| Term | Meaning |
|---|---|
| Engulfing | A body that completely covers the previous body. |
| Bullish engulfing | A green body covering a red body after a decline. |
| Bearish engulfing | A red body covering a green body after a rise. |
| Body | The area between open and close. |
| Pattern low | The lower of the two candles' lows. |
What is a bullish engulfing pattern?
A two-candle pattern after a decline where a bullish candle's body completely covers the previous bearish candle's body.
Do wicks need to be engulfed?
In the strict definition, no; only the bodies. Some traders prefer patterns where the whole range is covered.
How reliable is the engulfing pattern?
Not on its own in our data. Bullish engulfing patterns traded at their close lost slightly on daily charts (−0.13R) and more on hourly charts (−0.31R) with a 2R target, on small samples. Location and trend are the usual filters; test the pattern on your own markets before relying on it.
Where does the stop go on an engulfing trade?
Beyond the pattern's extreme: below the lower low for bullish, above the higher high for bearish.
What is the difference between engulfing and harami?
In engulfing, the second body covers the first. In a harami, the second body sits inside the first.
Is the bearish engulfing pattern better than the bullish one?
In our sample it did better: +0.29R on daily charts and +0.50R at 20-day highs, against negative results for the bullish version. The samples were small, so test it on your own market before relying on it.
Practical Exercise
Grade ten engulfing patterns.
Your task
Step 1: Find ten
Five at key levels, five mid-range.
Step 2: Grade each
Body size, close beyond range, location and trend.
Step 3: Track outcomes
Did price reach 2R before the stop?
Step 4: Compare
Which group did better in your sample?
Check Your Understanding
In a bullish engulfing pattern, the second candle:
Related Lessons
Previous module: Pin Bars. Next: Harami Patterns. See also Price Action Entry Triggers and Confluence.