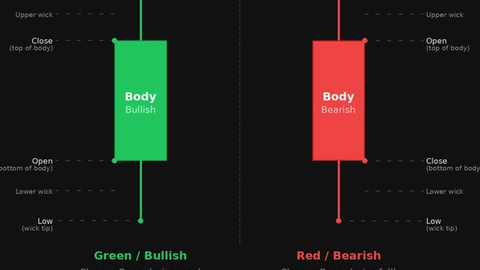
Candlestick Trading Setups
JustWolves is an educational platform and is not a SEBI-registered investment advisor. Trading financial instruments involves significant risk of loss and may not be suitable for all investors. Past performance is not indicative of future results. Read our full disclaimer →
What you'll learn
- A setup combines context, location, a candlestick trigger, a stop, a target and a position size
- Setup 1: a bullish pin bar at a pullback level in an uptrend
- Setup 2: an engulfing pattern at a major level after a clear move
- Setup 3: an inside bar breakout in the direction of the trend
- Write each setup as rules, test it, and trade only one or two at first
In this article · 17 sections
The final lesson of the Candlestick course turns patterns into complete trade plans. Each of the three setups below specifies the context, the level, the candlestick trigger, the stop, the target and the position size. They're examples to adapt and test, not systems to follow blindly, and they follow the structure from [Building a Price Action Strategy](/learn/price-action/price-action-strategy).
What You Will Learn
- The parts of a complete candlestick setup
- Three example setups with rules
- How to size positions from the pattern's stop
- How to choose and test a setup
Before You Start
Read How Reliable Are Candlestick Patterns? and Position Sizing first.
Anatomy of a Setup
| Part | Question |
|---|---|
| Context | Which direction does the trend favour? |
| Location | Which level am I waiting for? |
| Trigger | Which candlestick pattern must form there? |
| Entry | Exactly where do I enter? |
| Stop | Where is the idea wrong? |
| Target | Where do I take profit, and is it at least my minimum reward? |
| Size | How many shares or lots, given my risk per trade? |
Setup 1: Pin Bar Pullback
- Context: daily uptrend (higher highs and higher lows).
- Location: a pullback to a broken resistance level or the prior higher low.
- Trigger: a bullish pin bar whose tail probes the level and whose body closes in the top third of the range.
- Entry: buy-stop above the pin bar's high.
- Stop: below the tail.
- Target: the recent swing high; skip if under 2R.
Real Case: Setup 1 on Titan
The chart below uses real daily candles for Titan Company from July and August 2026. Step through it to apply Setup 1 rule by rule: the context, the broken resistance, the pin bar trigger, the buy-stop entry, the stop below the tail, and the target rule, which in this case said "skip".
Real case: Setup 1 on Titan, a pin bar pullback to broken resistance, August 2026
Step 1 of 5
Context and level
Titan is in a daily uptrend. From 28 to 31 July 2026 it stalls under 4,860–4,886, then on 3 August breaks out and closes at 5,000, at the day's high. The 4,886 area is now broken resistance.
- What to observe
- Uptrend, and a level to wait for.
- Condition
- Setup 1: wait for a pullback to the level.
Setup 2: Engulfing at a Major Level
- Context: a clear move of several candles into the level; ideally with the higher-timeframe trend.
- Location: a major support or resistance level tested at least twice before.
- Trigger: an engulfing pattern whose second candle is larger than the recent average and closes beyond the first candle's range.
- Entry: at the engulfing candle's close.
- Stop: beyond the pattern's extreme and the level.
- Target: the next opposing level; skip if under 2R.
Setup 3: Inside Bar Breakout
- Context: a trending market, just after a strong with-trend candle (the mother bar).
- Location: near a level that has just been broken, or early in a new trend leg.
- Trigger: an inside bar.
- Entry: stop order beyond the mother bar's high (uptrend) or low (downtrend).
- Stop: beyond the inside bar's opposite extreme (tighter) or the mother bar's (wider).
- Target: the next level or a fixed 2R.
Sizing From the Pattern
Candlestick patterns vary in size, so the stop distance varies too. Fix the amount you risk per trade, then calculate the position from the stop distance: position size = amount at risk ÷ stop distance per share.
This keeps a wide engulfing candle and a small inside bar at the same rupee risk, as covered in Position Sizing.
Managing the Trade
A setup also needs rules for after entry. Common choices are to leave the stop and target untouched until one is hit, or to move the stop to breakeven once price has travelled 1R in your favour. Some traders take partial profit at the first level and let the rest run to the second.
Whichever you choose, decide it before the trade and apply it the same way every time. Changing management mid-trade, especially moving a stop further away, is one of the most common ways a good setup turns into a large loss.
What Our Tests Say About Each Setup
Each setup in this lesson uses a trigger tested earlier in the Candlestick course, on about two years of real daily candles for 20 large NSE stocks, NIFTY 50, four currency pairs and gold, and six months of hourly candles for the five markets. The table below collects the most relevant results. None of them tests a full setup with its context and target rules, which is the work this lesson asks you to do yourself, but they show what each trigger contributes.
| Setup | Trigger tested | Daily | Hourly |
|---|---|---|---|
| Setup 1 | Hammer, entry after a close above its high | 14 trades, +0.07R | 9 trades, +1.00R |
| Setup 1 | Bullish pin bar, entry at its close | 145 trades, −0.01R | 246 trades, −0.13R |
| Setup 2 | Bullish engulfing at a 20-candle low | 18 trades, 0.00R | 23 trades, −0.35R |
| Setup 2 | Bearish engulfing at a 20-candle high | 20 trades, +0.50R | 24 trades, +0.13R |
| Setup 3 | Inside bar breakout with the trend, long / short | 11 trades, −0.73R / 15 trades, +0.40R | 13 trades, +0.15R / 18 trades, 0.00R |
| Control | Any candle, same trade | about −0.03R | about −0.10R |
Three practical points follow from these numbers.
Setup 1's buy-stop entry is a sensible choice. Entering above the trigger candle's high, rather than at its close, did better for hammers in our data, on small samples. It means the market has to move your way before you are in.
Setup 2 behaved differently by direction. Bearish engulfing patterns at 20-day highs were among the better results in the course; bullish engulfing patterns at 20-day lows were not. If you start with Setup 2, test the long and short versions separately.
Setup 3 needs a plan for false breaks. In our data, 64% of inside bars in a trend broke the wrong way first. The stop order protects you from entering on those, but the setup will trigger less often than you expect, and its results were mixed.
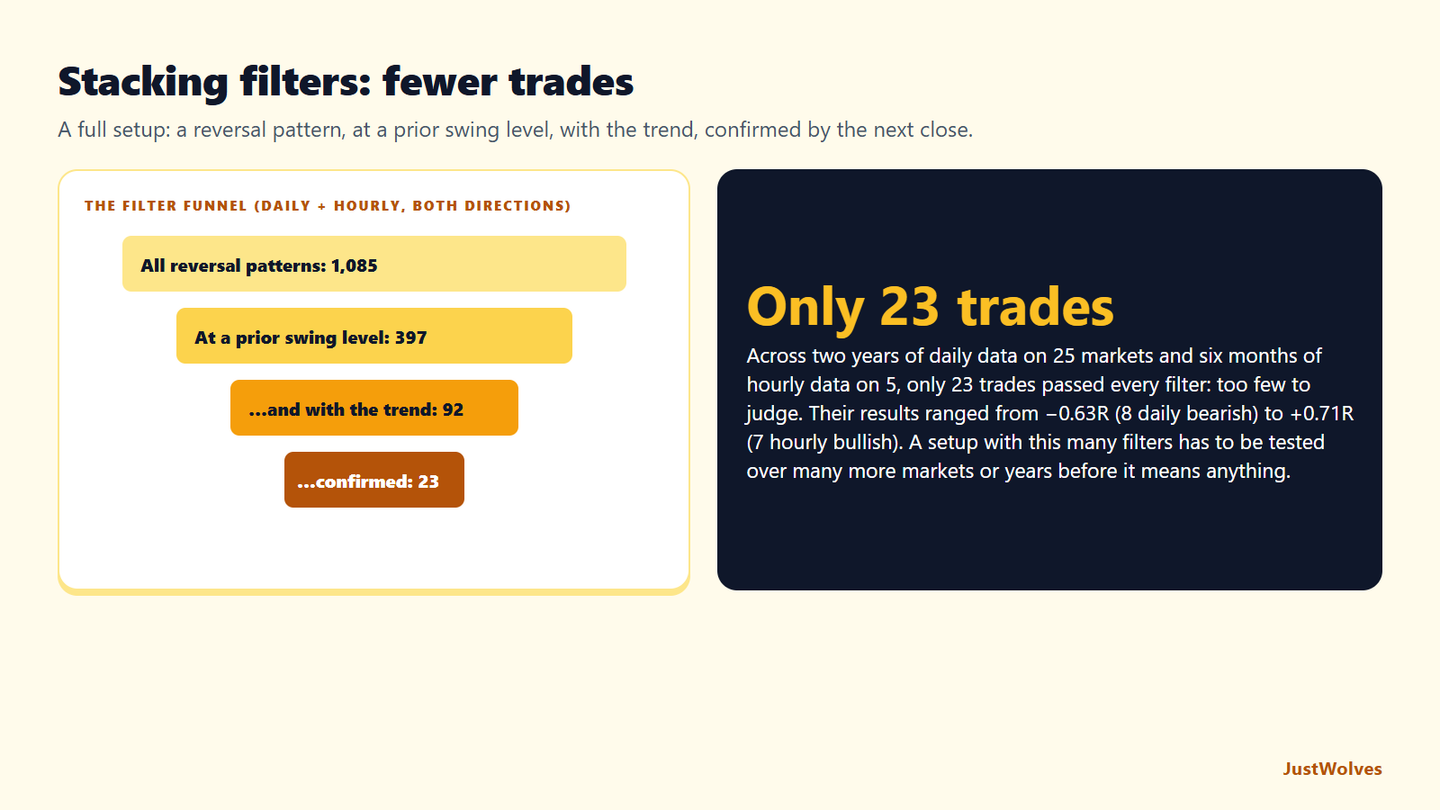
We also tested what happens when you stack several filters, as a full setup does: a reversal pattern, at a prior swing level, in the direction of a simple trend, confirmed by the next candle's close. Out of 1,085 reversal patterns, 397 were at a prior swing level, 92 were also with the trend, and only 23 were also confirmed. Their results ranged from −0.63R to +0.71R depending on the group: far too few trades to say anything.
That is the most useful lesson for building setups. Every rule you add makes the setup more selective, which feels safer, but it also leaves fewer trades to learn from. A setup that triggers ten times a year needs years of data, or many markets, before its results mean anything. This lesson's advice to test one setup on thirty instances, with costs, before trading it is the minimum, not a formality.
Practical Example
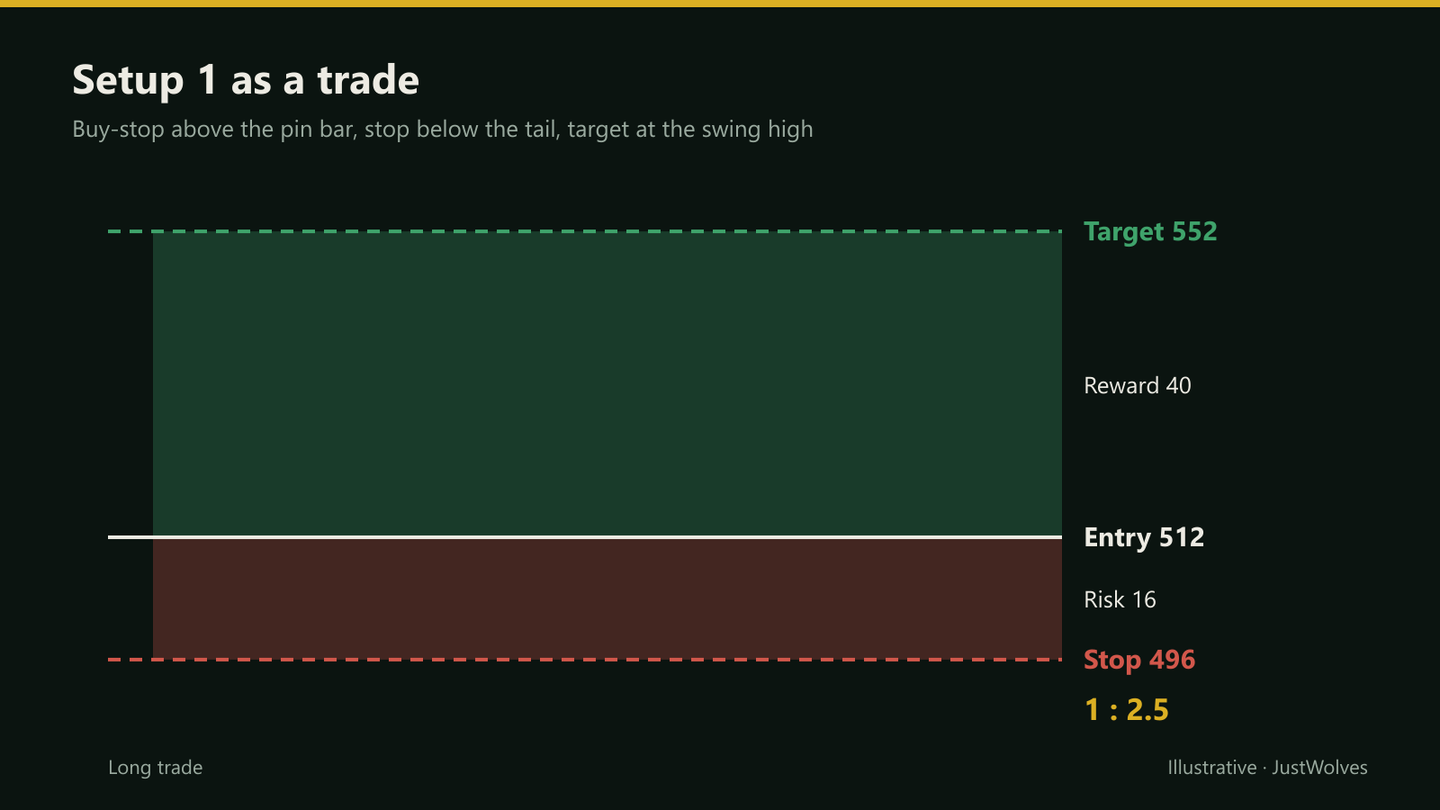
Hypothetically, Rhea risks ₹4,000 per trade. A stock in a daily uptrend pulls back to broken resistance at ₹500 and forms a bullish pin bar with a low of ₹498 and a high of ₹511. Her buy-stop goes at ₹512, her stop at ₹496, and the swing high is ₹552.
Risk is ₹16 per share and reward ₹40, so 2.5R, which passes her filter. Position size is ₹4,000 ÷ ₹16 = 250 shares. She records the setup, the screenshots and the planned levels before the order triggers.
Sizing the Titan Trade
| Item | Calculation | Result |
|---|---|---|
| Entry (buy-stop) | Above the 4,935 high | 4,936 |
| Stop | Below the 4,862 tail | 4,855 |
| Risk per share | 4,936 − 4,855 | ₹81 |
| Shares | ₹4,000 ÷ ₹81 | 49 shares |
| Position value | 49 × ₹4,936 | about ₹2.42 lakh |
| Result at 2R | 49 × (5,098 − 4,936) | about +₹7,900 |
Compare this with Rhea's example below. Her pin bar had a ₹16 stop on a ₹512 stock, so ₹4,000 of risk bought 250 shares worth about ₹1.3 lakh. Titan's ₹81 stop on a ₹4,936 stock bought only 49 shares, but worth almost twice as much, because the stop was a smaller share of the price (1.6% against 3.1%). Sizing from the stop keeps the rupee risk the same in both trades even though the positions look very different.
The Titan example also shows why the target rule needs to be decided in advance. With Setup 1's swing-high target, the trade was skipped. With a fixed 2R target, it made about ₹7,900. Neither choice is right in general. Pick one, write it into the setup, and judge it over at least thirty trades rather than this one.
Common Mistakes
- Trading all three setups at once before testing any.
- Loosening the trigger rules when no setup appears.
- Fixed share sizes regardless of stop distance.
- Ignoring the reward filter.
- No journal, so results can't be reviewed.
Professional Insight
The setups themselves are simple. What separates consistent traders is applying them the same way every time, sizing every trade from the stop, and reviewing results in a trading journal.
Risk Considerations
- Losing streaks happen with any setup; size for them.
- Stop orders can slip in fast markets.
- Untested setups carry unknown risk.
Important Terminology
| Term | Meaning |
|---|---|
| Setup | A complete set of rules for one type of trade. |
| Trigger | The pattern that times the entry. |
| Buy-stop | An order that buys once price rises to a level. |
| Reward filter | A minimum reward-to-risk required to take a trade. |
| Position size | Amount at risk divided by stop distance. |
What is a candlestick trading strategy?
A set of rules that uses a candlestick pattern as the entry trigger, combined with trend, level, stop, target and position size.
Which candlestick setup is best for beginners?
Many find the pin bar pullback in an uptrend easiest to recognise, but test any setup before trading it.
How do I size a candlestick trade?
Divide the amount you're willing to lose by the distance from entry to stop.
Should I trade all three setups?
Start with one, test it and follow it consistently before adding another.
What reward-to-risk should I require?
Many traders use a minimum of about 2R; your own testing should guide this.
What is the best candlestick trading setup?
There is no single best one. In our tests, the triggers behind the three common setups performed differently: bearish engulfing patterns at 20-day highs did well (+0.50R daily on 20 trades), bullish pin bars at their close were close to chance, and inside bar breakouts were mixed. Test one setup on your own market first.
Should I skip a candlestick setup if the target is less than 2R away?
Many traders do, to avoid trades with little room. It will sometimes skip winners: in a real Titan example from August 2026, the swing high was only 0.8R away, but price went on to reach 2R within three sessions. Decide your rule in advance and judge it over many trades.
Practical Exercise
Write and test one setup.
Your task
Step 1: Choose a setup
One of the three, or your own.
Step 2: Write the rules
Every row of the anatomy table.
Step 3: Backtest
Thirty instances with bar replay, including costs.
Step 4: Paper trade
Twenty trades before using real money.
Check Your Understanding
Which is NOT part of a complete setup?
Related Lessons
Previous: How Reliable Are Candlestick Patterns?. This completes the Candlestick course. See also Building a Price Action Strategy and Trading Plan and Position Sizing.