Candlestick Patterns and Market Structure
JustWolves is an educational platform and is not a SEBI-registered investment advisor. Trading financial instruments involves significant risk of loss and may not be suitable for all investors. Past performance is not indicative of future results. Read our full disclaimer →
What you'll learn
- Market structure (highs and lows) sets the trend; candlestick patterns show the reaction at each swing
- In uptrends, bullish patterns at higher lows are with-trend; bearish patterns at highs are counter-trend
- With-trend patterns are generally more useful; counter-trend patterns need stronger evidence
- A pattern that breaks structure, such as a bearish engulfing below the last higher low, is especially informative
- Align the pattern timeframe with a higher-timeframe trend
In this article · 17 sections
Levels tell you where to look. Market structure, the sequence of swing highs and lows, tells you which direction to favour. A bullish engulfing candle at a higher low in an uptrend is a very different trade from a bullish engulfing candle in the middle of a steep downtrend. This lesson shows how to read candlestick patterns in the context of trend structure and across timeframes.
What You Will Learn
- How patterns fit into trend structure
- With-trend versus counter-trend patterns
- Patterns that break structure
- How to align timeframes
Before You Start
Read Candlestick Patterns at Support and Resistance and Market Trends first.
Structure Sets the Direction
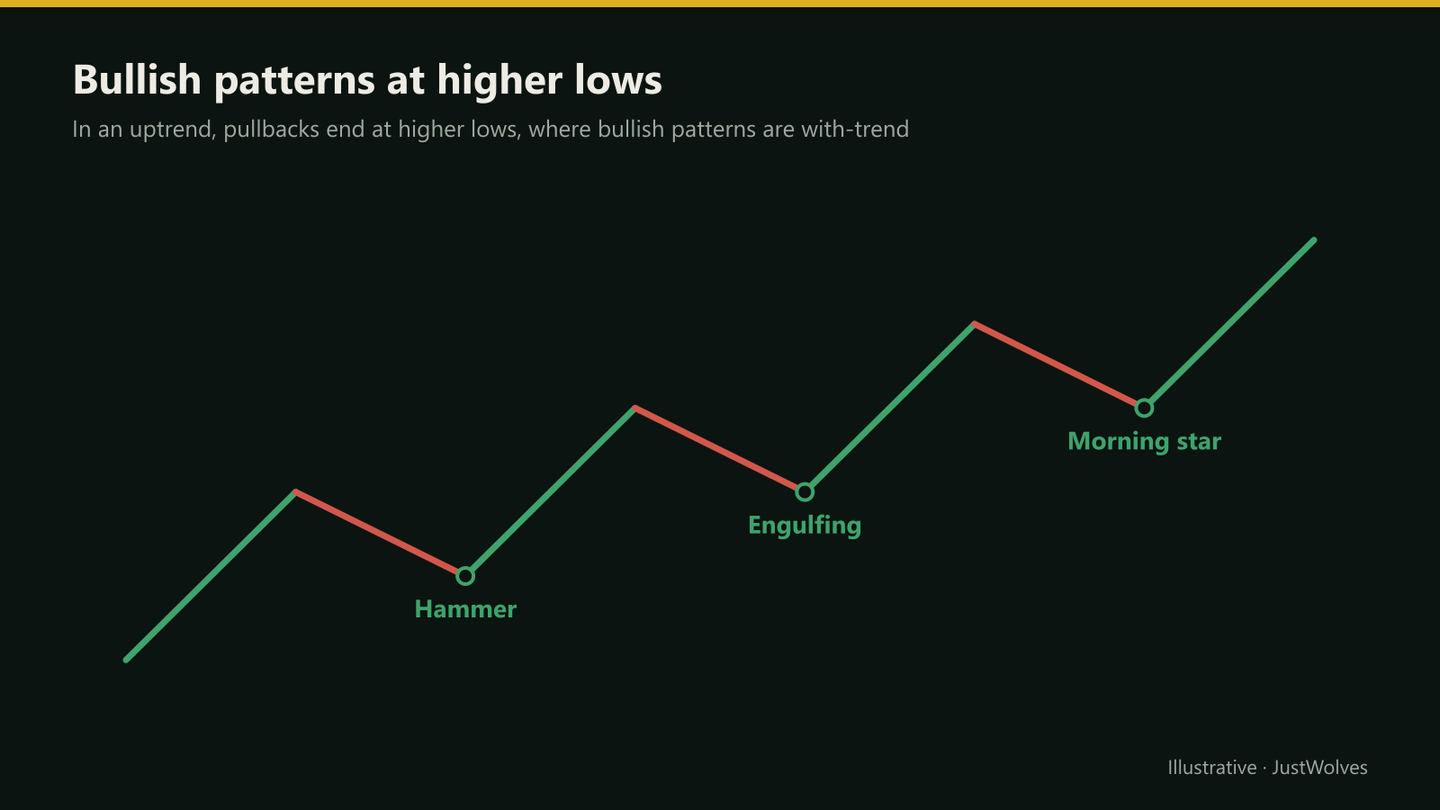
An uptrend is a sequence of higher highs and higher lows; a downtrend, lower highs and lower lows. Every swing point is a place where one side took over from the other, and that handover often shows up as a candlestick pattern.
In an uptrend, each higher low is a pullback ending: often marked by a hammer, bullish engulfing candle or morning star. Each higher high is a rally pausing: sometimes marked by a shooting star or doji that doesn't lead anywhere because the trend resumes.
With-Trend and Counter-Trend
| Pattern | Where | Type | Typical use |
|---|---|---|---|
| Bullish (hammer, engulfing, star) | At a higher low or support | With-trend | Entry signal for longs |
| Bearish (shooting star, evening star) | At a high | Counter-trend | Warning; manage longs, rarely a short on its own |
| Bearish engulfing below the last higher low | Breaking structure | Possible reversal | Evidence the trend may be ending |
Patterns That Break Structure
The most informative counter-trend patterns are those that also break structure. A large bearish candle that closes below the last higher low in an uptrend combines a candlestick signal with a break of structure. That's much stronger evidence than a shooting star at a high.
Many traders then wait for a lower high, often marked by a bearish pattern such as an evening star, before treating the trend as reversed.
Real Case: A Pin Bar at the Higher Lows of an Uptrend
The chart below uses real daily candles for State Bank of India from January and February 2026. Step through it to see an uptrend's structure, a sharp gap that broke below the higher lows during the day, and the pin bar that closed back above them.
Real case: a pin bar that undercut a higher low, State Bank of India, January–February 2026
Step 1 of 5
A clear uptrend
State Bank of India builds higher lows (994.0 on 9 January 2026, 1,022.0 on 21 January, 1,025.6 on 23 January) and higher highs, up to 1,082.5 on 30 January.
- What to observe
- Structure favours longs.
- Condition
- Look for a with-trend pattern at a pullback.
This example adds a nuance to "patterns that break structure". Intraday, the 2 February candle broke every recent higher low. On a closing basis, it broke none of the two most recent ones. Many traders judge structure on closes for exactly this reason: wicks through swing points are common, especially on gaps, and a strong recovery within the same candle is itself a sign that the trend's buyers are still active.
Aligning Timeframes
Top-down with candles
Step 1: Weekly or daily
Define the trend from structure.
Step 2: Daily
Mark the pullback zone and levels.
Step 3: Daily or 4-hour
Look for a with-trend pattern in the zone.
Step 4: Lower timeframe (optional)
Refine the entry if the pattern's stop is too wide.
This follows the method in Multi-Timeframe Analysis: the higher timeframe decides direction, the lower one decides timing.
Ranges
In a sideways range there is no trend to align with. Patterns are useful at the range edges, bullish at the low and bearish at the high, and close to useless in the middle. A pattern that closes outside the range suggests the range may be ending.
When Structure Is Unclear
Some charts don't show clean highs and lows: swings overlap, new highs fail immediately, and the trend changes every few days. In those conditions candlestick patterns have no structure to anchor them, and most of them will be noise. Many traders simply skip such charts and look for instruments where the structure is clear, rather than forcing patterns into a confusing picture.
With-Trend or Counter-Trend? Our Test
This lesson suggests that with-trend patterns are generally more useful than counter-trend ones. JustWolves tested that on about two years of real daily candles for 20 large NSE stocks, NIFTY 50, four currency pairs and gold, and six months of hourly candles for the five markets.
Patterns: bullish pin bars, bullish engulfing patterns, tweezer bottoms and morning stars, with bearish versions on mirrored prices. Trend: an uptrend when the close is above the 50-candle average and that average is higher than 10 candles earlier; a downtrend when both point down. With-trend means a bullish pattern in an uptrend or a bearish pattern in a downtrend. Trade: at the pattern's close, stop beyond the pattern, 2R target.
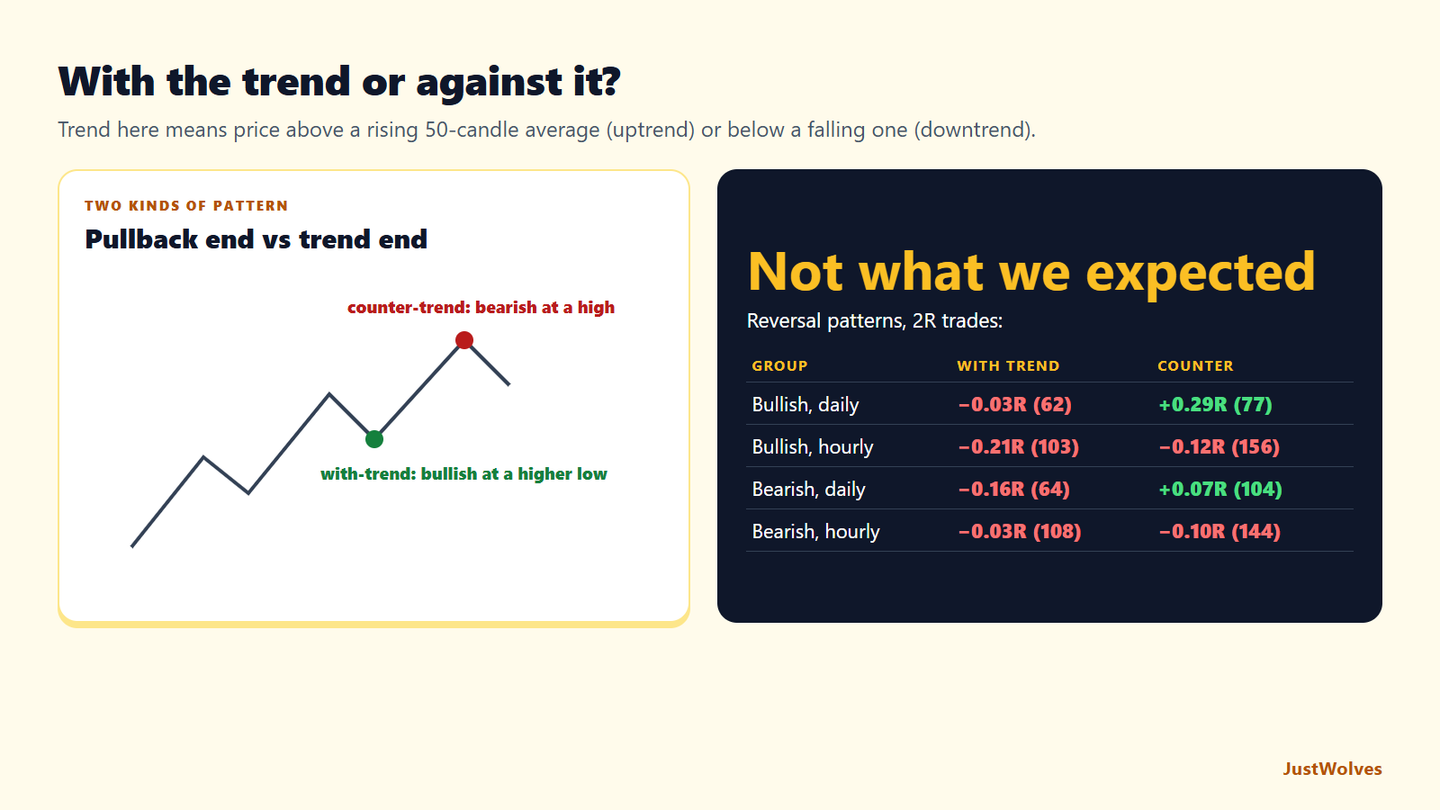
| Group | With the trend | Against the trend |
|---|---|---|
| Bullish patterns, daily | 62 trades, 32% wins, −0.03R | 77 trades, 43% wins, +0.29R |
| Bullish patterns, hourly | 103 trades, 26% wins, −0.21R | 156 trades, 29% wins, −0.12R |
| Bearish patterns, daily | 64 trades, 28% wins, −0.16R | 104 trades, 36% wins, +0.07R |
| Bearish patterns, hourly | 108 trades, 32% wins, −0.03R | 144 trades, 30% wins, −0.10R |
| Control: any candle, same trade | −0.03 to −0.04R daily, −0.03 to −0.17R hourly | −0.03 to −0.08R daily, −0.05 to −0.14R hourly |
This is not what the textbook idea predicts. With-trend patterns did not beat counter-trend patterns in our data. On daily charts, counter-trend patterns did clearly better, for both bullish and bearish versions. On hourly charts the bearish group leaned slightly the other way, and the bullish group was negative both ways.
There are good reasons not to over-read this. First, our trend rule is a simple moving-average test, not the swing-by-swing structure this lesson teaches; a pattern at a clean higher low is a narrower thing than "a bullish pattern while price is above a rising average". Second, most of our reversal patterns require a short decline before them (or a rise, for bearish ones), so a "with-trend" pattern here is always a pullback, while a "counter-trend" one comes after a longer move that may simply be stretched. Stretched moves snapping back is a well-known short-term tendency, and that is a plausible reason for the daily counter-trend results.
What the data supports is narrower than the usual rule: being with the trend, measured simply, did not make candlestick patterns better on its own. If structure is central to your trading, as this lesson recommends, test your own definition of it, for example only patterns that hold above the last higher low on a closing basis, against patterns elsewhere.
Practical Example
Hypothetically, a stock's weekly chart shows higher highs and higher lows. On the daily chart, it pulls back from ₹940 to ₹872, near the last higher low of ₹865, and forms a bullish engulfing candle closing at ₹889 with a low of ₹868.
Divya buys at ₹890 with a stop at ₹860, below both the pattern and the prior higher low, targeting ₹940 at the recent high: ₹30 of risk for ₹50 of reward. If the stock had instead closed below ₹865 on a large red candle, she would have read that as a possible structural break and stayed out.
Reading the SBI Structure
| Swing point | Price | Comment |
|---|---|---|
| Higher low | 994.0 (9 Jan) | Start of the leg |
| Higher low | 1,022.0 (21 Jan) | Pullback after 1,047.4 |
| Higher low | 1,025.6 (23 Jan) | Pullback after 1,055.5 |
| Higher high | 1,082.5 (30 Jan) | Last high before the gap |
| Pin bar low / close | 990.0 / 1,028.7 (2 Feb) | Wick below all three lows; close above the last two |
Laid out this way, the structure question becomes simple. A trader judging on wicks would say the uptrend broke on 2 February, since price traded below every higher low of the leg. A trader judging on closes would say it held, since the stock closed above the two most recent lows. The pin bar gives the second trader a natural trade: a stop just below the wick, where the closing-basis reading would finally be wrong.
The Divya example in this lesson uses the same logic: her stop sits below both the pattern and the prior higher low, and she would read a large red close below that low as a structural break. Whichever rule you use, wicks or closes, write it down. Structure is only useful if you apply it the same way every time.
Common Mistakes
- Trading every counter-trend pattern at highs and lows.
- Ignoring the higher-timeframe trend.
- Trading patterns mid-range.
- Missing structural breaks because no named pattern formed.
- Confusing a pullback low with a reversal.
Professional Insight
A common professional habit is to decide the direction before looking at candles at all. Once the bias is set from structure, candlestick patterns are only used to time entries in that direction, which removes many tempting but low-quality counter-trend trades.
Risk Considerations
- Trends end; with-trend patterns fail at turning points.
- Structure can be ambiguous in choppy markets.
- Higher-timeframe stops can be wide.
Important Terminology
| Term | Meaning |
|---|---|
| Market structure | The sequence of swing highs and lows. |
| Higher low | A pullback low above the previous one. |
| With-trend pattern | A pattern in the direction of the trend. |
| Counter-trend pattern | A pattern against the trend. |
| Break of structure | A close beyond the swing that defined the trend. |
How do candlestick patterns relate to trends?
They often mark the swing points where the trend pauses or resumes. Patterns in the trend's direction at those points tend to be more useful.
Should I trade reversal patterns against the trend?
Only with strong additional evidence, such as a break of structure. On their own they fail more often.
What is a with-trend candlestick pattern?
A pattern in the trend's direction, such as a bullish engulfing at a higher low in an uptrend.
Which timeframe should I use?
Define the trend on a higher timeframe and look for patterns on your trading timeframe.
Do candlestick patterns work in ranges?
At the range edges they can be useful; in the middle, rarely.
Are with-trend candlestick patterns more reliable?
Not in our test. Using a 50-candle moving-average trend, bullish and bearish reversal patterns in the trend's direction did no better than counter-trend ones, and on daily charts did worse (for example −0.03R against +0.29R for bullish patterns). Precise swing-based structure may behave differently.
Does a wick below a higher low break the uptrend?
It depends on your rule. Many traders judge structure on closes, because wicks through swing points are common on gaps. In a real State Bank of India example from February 2026, a candle wicked below every recent higher low, closed back above them, and the uptrend continued.
Practical Exercise
Label structure and patterns.
Your task
Step 1: Pick a trending daily chart
At least six months of data.
Step 2: Mark swing points
Every higher high and higher low (or the reverse).
Step 3: Label patterns
Note any pattern at each swing point.
Step 4: Classify
With-trend or counter-trend, and what happened next.
Check Your Understanding
In an uptrend, a bullish engulfing at a higher low is:
Related Lessons
Previous: Candlestick Patterns at Support and Resistance. Next: How Reliable Are Candlestick Patterns?. See also Swing Highs and Swing Lows.