Three White Soldiers and Three Black Crows
JustWolves is an educational platform and is not a SEBI-registered investment advisor. Trading financial instruments involves significant risk of loss and may not be suitable for all investors. Past performance is not indicative of future results. Read our full disclaimer →
What you'll learn
- Three white soldiers: three consecutive large bullish candles, each opening within the previous body and closing near its high
- Three black crows: the bearish mirror, three large bearish candles closing near their lows
- They show sustained control by one side over three periods
- Shrinking bodies or growing wicks within the pattern are warning signs
- Entries usually come on a pullback, since the pattern ends far from its start
In this article · 17 sections
One strong candle can be an accident. Three in a row, each opening inside the previous body and closing near its extreme, show one side controlling the market for three straight periods. After a decline, three strong green candles are called three white soldiers; after a rise, three strong red candles are three black crows. This lesson covers how to identify them, how to spot weakness inside them, and how to trade them without chasing.
What You Will Learn
- How three white soldiers and three black crows form
- What separates a strong version from a weak one
- Why entries are tricky
- How to trade them
Before You Start
Read Morning Star and Evening Star and Marubozu Candles first.
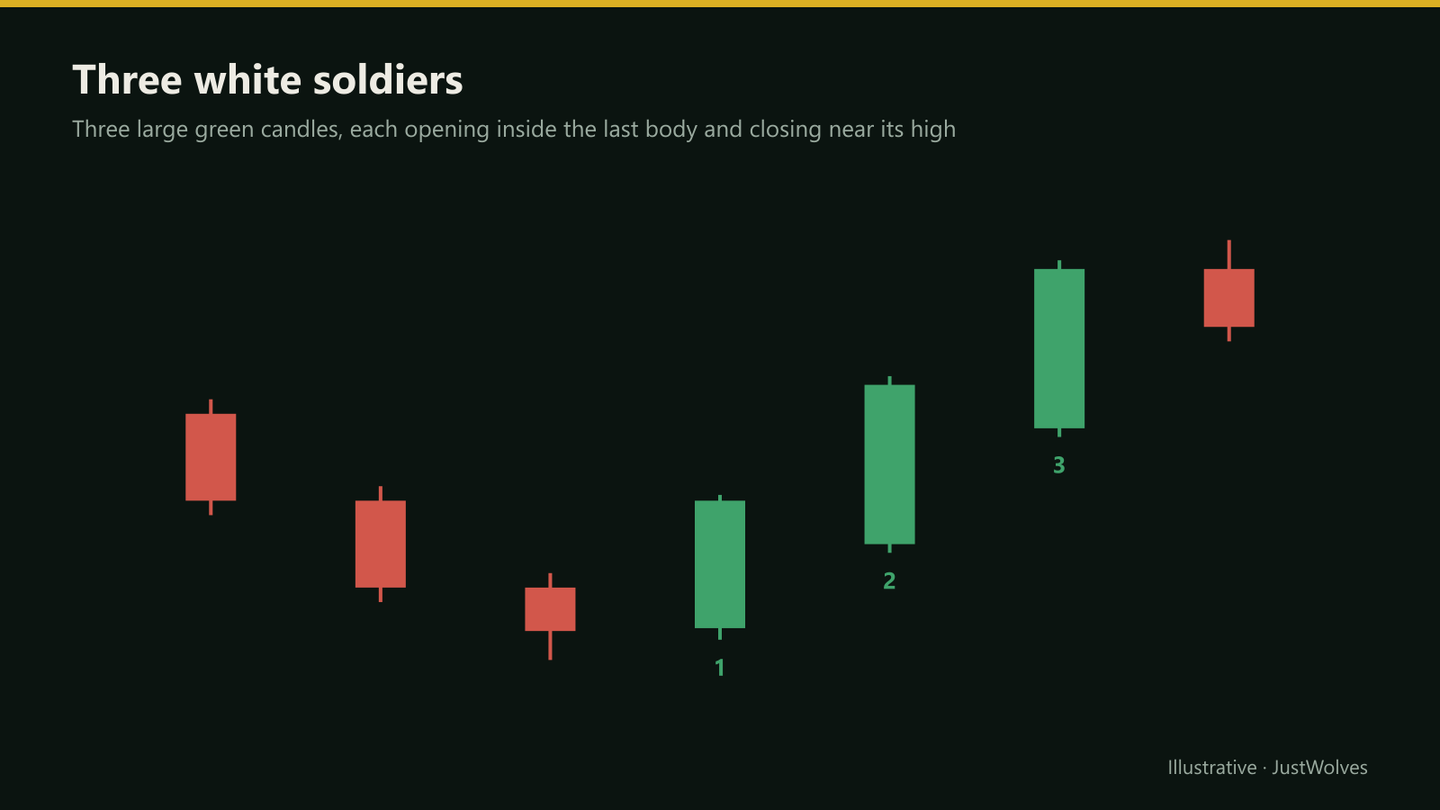
Three White Soldiers
- Appears after a decline or a period of consolidation.
- Three consecutive bullish candles with large bodies.
- Each opens within the previous candle's body and closes near its high, above the previous close.
- Small or no upper wicks.
Three Black Crows
The bearish mirror: after a rise, three consecutive large bearish candles, each opening within the previous body and closing near its low, with small lower wicks. It suggests sellers have taken firm control.
Signs of Weakness
| Feature | Strong | Weak (warning) |
|---|---|---|
| Body sizes | Similar or growing | Shrinking with each candle |
| Wicks | Small, especially in the trend's direction | Long upper wicks on soldiers (lower wicks on crows) |
| Location | Leaving a base or key level | Running into major resistance (or support) |
| Extension | Moderate total move | Huge candles after an already long run |
Soldiers with shrinking bodies and lengthening upper wicks are sometimes called an advance block: the rally is still making progress, but with less force each period. It's a sign of exhaustion, not strength.
The Entry Problem
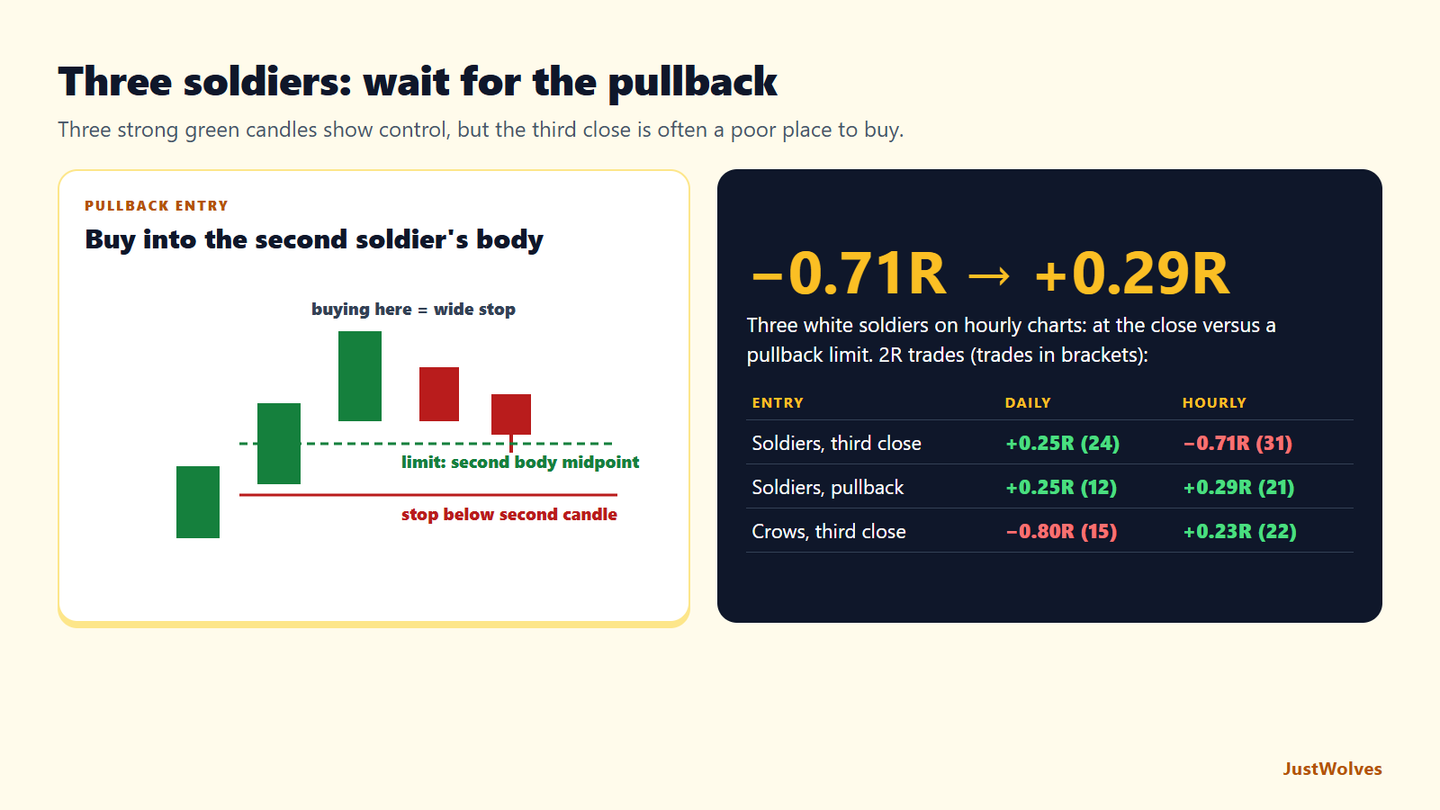
By the time the third soldier closes, price is often far above where the move began. Buying the close means a wide stop below the pattern, or a tight stop that sits in empty space with no structural reason.
That's why many traders treat the pattern as evidence of a shift in control, then wait for the first pullback, often toward the second candle's body or a broken level, before entering.
Trading Three White Soldiers
Pullback entry
Step 1: Context
The pattern forms leaving a support level or a base after a decline.
Step 2: Check quality
Similar or growing bodies, small upper wicks.
Step 3: Wait
For a pullback toward the second candle's body or a broken level.
Step 4: Entry and stop
Enter on a bullish candle in the pullback; stop below the pullback low or the second candle's low.
Step 5: Target
The next resistance.
Real Case: Soldiers and a Pullback on Hindustan Unilever
The chart below uses real daily candles for Hindustan Unilever from December 2025 and January 2026. Step through it to compare the two entries this lesson discusses: buying the third soldier's close, and waiting for a pullback into the second soldier's body.
Real case: three white soldiers and a pullback entry, Hindustan Unilever, January 2026
Step 1 of 5
A two-week base
From 18 December 2025 to 1 January 2026, Hindustan Unilever trades in a narrow band between about 2,255 and 2,326.
- What to observe
- A quiet base.
- Condition
- Watch for a strong move out of it.
Three Black Crows in Practice
After an extended rally, three large red candles closing near their lows show sellers taking control for three straight sessions. The same entry problem applies: the third crow often closes far below the top. Many traders wait for a bounce toward the second crow's body, then look for a bearish candle there, with the stop above the bounce high.
Crows that form right at major support deserve caution, because the decline may simply be running into buyers. Crows that break down through support, by contrast, show sellers overpowering a level that previously held.
Chase or Wait? Our Test
JustWolves tested both patterns on about two years of real daily candles for 20 large NSE stocks, NIFTY 50, four currency pairs and gold, and six months of hourly candles for the five markets. Three white soldiers: three green candles, each with a body of at least 0.6 average ranges, each closing in the top 40% of its range and above the previous close, each opening no lower than just below the previous open. Three black crows: the mirror image, tested on mirrored prices. Entries: at the third close with the stop below the first candle, or a limit at the second candle's body midpoint within five candles with the stop below the second candle. 2R targets.
We loosened the textbook rule that each candle must open inside the previous body. With the strict rule, we found only four cases in two years of daily data for the 20 stocks and NIFTY 50: far too few to measure. The looser rule keeps the idea, three strong closes in a row, and gives usable samples.
| Setup | Daily | Hourly |
|---|---|---|
| Soldiers, at the third close | 24 trades, 42% wins, +0.25R | 31 trades, 10% wins, −0.71R |
| Soldiers, pullback limit | 12 trades, 42% wins, +0.25R | 21 trades, 43% wins, +0.29R |
| Crows, at the third close | 15 trades, 7% wins, −0.80R | 22 trades, 41% wins, +0.23R |
| Crows, pullback limit | 11 trades, 18% wins, −0.45R | 16 trades, 31% wins, −0.06R |
| Control: any candle, same trade | about 2,200 trades, −0.02 to −0.03R | about 2,500 trades, −0.07 to −0.10R |
The clearest result supports this lesson's "Don't chase" warning. On hourly charts, buying the third soldier's close lost heavily (−0.71R, with only one trade in ten reaching 2R), while waiting for a pullback to the second body turned a profit (+0.29R). On daily charts both entries averaged +0.25R, but the pullback entry got there with a stop about a third the size, as the Hindustan Unilever example shows.
Three black crows were inconsistent: very poor on daily charts (−0.80R over 15 trades) and positive on hourly charts (+0.23R over 22). With samples this small, the honest reading is that we cannot say whether crows predict anything.
We also checked direction alone: were prices higher five candles after the pattern? After three white soldiers, 23 of 40 daily cases (58%) and 25 of 58 hourly cases (43%) were higher, against 49% for all candles. After three black crows, prices were lower in 9 of 22 daily cases (41%) and 17 of 45 hourly cases (38%), so crows were more often followed by a bounce than by further decline.
Practical Example
Hypothetically, a capital-goods stock bases near ₹2,400 for two weeks, then prints three large green candles closing at ₹2,465, ₹2,530 and ₹2,590, each opening inside the previous body. The second candle's body runs from ₹2,455 to ₹2,530.
Two days later, the stock pulls back to ₹2,520 and forms a hammer. Aryan buys at ₹2,535 with a stop at ₹2,495, below the hammer and inside the second candle's body, targeting ₹2,650 at the next resistance: ₹40 of risk for ₹115 of reward.
Measuring the Hindustan Unilever Soldiers
| Candle | Open → close | Body | Close location in range |
|---|---|---|---|
| Soldier 1 (2 Jan) | 2,326.0 → 2,348.0 | 22.0 | 73% |
| Soldier 2 (5 Jan) | 2,341.5 → 2,384.1 | 42.6 | 83% |
| Soldier 3 (6 Jan) | 2,398.8 → 2,424.7 | 25.9 | 94% |
Grade it with this lesson's "Signs of Weakness" table. The closes are strong and get stronger (73%, 83%, 94% of the way up each range). The bodies are mixed: the second is the largest, and the third is smaller and opened on a small gap above the second close. A smaller third body is a mild warning of the kind this lesson calls an advance block. In this case the stock did pause for a week, which is exactly what gave the pullback entry its chance.
The comparison of entries is the main lesson. Entering at the third close meant a 105-point stop and a 2R target at 2,635 that was never close. Entering on the pullback meant a 29-point stop and a target reached in three sessions. Same pattern, same stock, same week.
Common Mistakes
- Buying the third candle's close without a stop plan.
- Ignoring shrinking bodies and growing wicks.
- Trading the pattern into major resistance.
- Counting small candles as soldiers.
- Shorting three black crows at major support without confirmation.
Professional Insight
Experienced traders often use these patterns to change their bias rather than to time an entry. Three black crows after a long rally tell them to stop looking for longs; three white soldiers off a base tell them to start looking for pullbacks to buy.
Risk Considerations
- Extended moves often pull back sharply.
- Wide patterns mean wide stops.
- News-driven runs can reverse fully.
Important Terminology
| Term | Meaning |
|---|---|
| Three white soldiers | Three consecutive strong bullish candles after a decline. |
| Three black crows | Three consecutive strong bearish candles after a rise. |
| Advance block | Soldiers with shrinking bodies and growing upper wicks. |
| Extension | How far price has moved from its starting point. |
| Pullback entry | Entering on a retracement after the pattern. |
What is three white soldiers?
Three consecutive large bullish candles, each opening within the previous body and closing near its high, usually after a decline.
What is three black crows?
The bearish mirror: three consecutive large bearish candles closing near their lows, usually after a rise.
Should I buy right after three white soldiers?
Many traders wait for a pullback, because the pattern often ends far from a logical stop.
What is an advance block?
A weaker version of three white soldiers with shrinking bodies and growing upper wicks, suggesting the rally is losing force.
Are these reversal or continuation patterns?
Classically reversal patterns after a decline or rise, but similar sequences also appear as continuation in trends.
Should I buy three white soldiers at the close of the third candle?
Our data says waiting is usually better. On hourly charts, buying the third close averaged −0.71R with 2R targets, while a limit at the second candle's body midpoint averaged +0.29R. On daily charts both averaged +0.25R, but the pullback entry used a much smaller stop.
Are three black crows a reliable sell signal?
Not in our data. Shorting at the third crow's close averaged −0.80R on daily charts and +0.23R on hourly charts, on small samples, and prices were lower five candles later less than half the time.
Practical Exercise
Study pullbacks after the pattern.
Your task
Step 1: Find ten examples
Three white soldiers or three black crows on daily charts.
Step 2: Grade quality
Body sizes, wicks and location.
Step 3: Measure pullbacks
How far did price retrace within the next five candles?
Step 4: Compare
Chasing the close versus waiting for the pullback.
Check Your Understanding
Each of three white soldiers:
Related Lessons
Previous: Morning Star and Evening Star. Next: Other Multi-Candle Formations. See also Reversals, Momentum and Exhaustion.