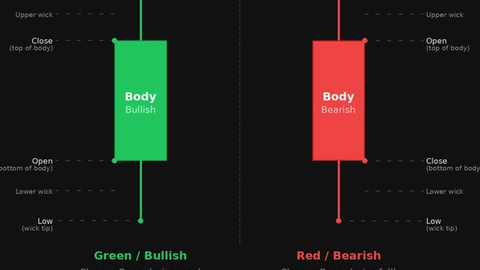
Morning Star and Evening Star Patterns
JustWolves is an educational platform and is not a SEBI-registered investment advisor. Trading financial instruments involves significant risk of loss and may not be suitable for all investors. Past performance is not indicative of future results. Read our full disclaimer →
What you'll learn
- Morning star: a large bearish candle, a small 'star' candle, then a large bullish candle closing well into the first body
- Evening star: the bearish mirror after a rise
- The three candles show momentum, then indecision, then a shift in control
- A doji as the middle candle forms a morning or evening doji star
- The third candle's close is the confirmation; the stop goes beyond the star
In this article · 17 sections
Star patterns tell a three-part story. A strong candle continues the trend, a small candle shows the move stalling, and a strong candle in the opposite direction shows control changing hands. After a decline it's a morning star; after a rise, an evening star. This lesson covers how they form, what each candle contributes, and how to trade them.
What You Will Learn
- How morning and evening stars form
- What each of the three candles shows
- Doji star variations
- How to trade star patterns
Before You Start
Read Doji Candlestick Patterns and Piercing Line and Dark Cloud Cover first.
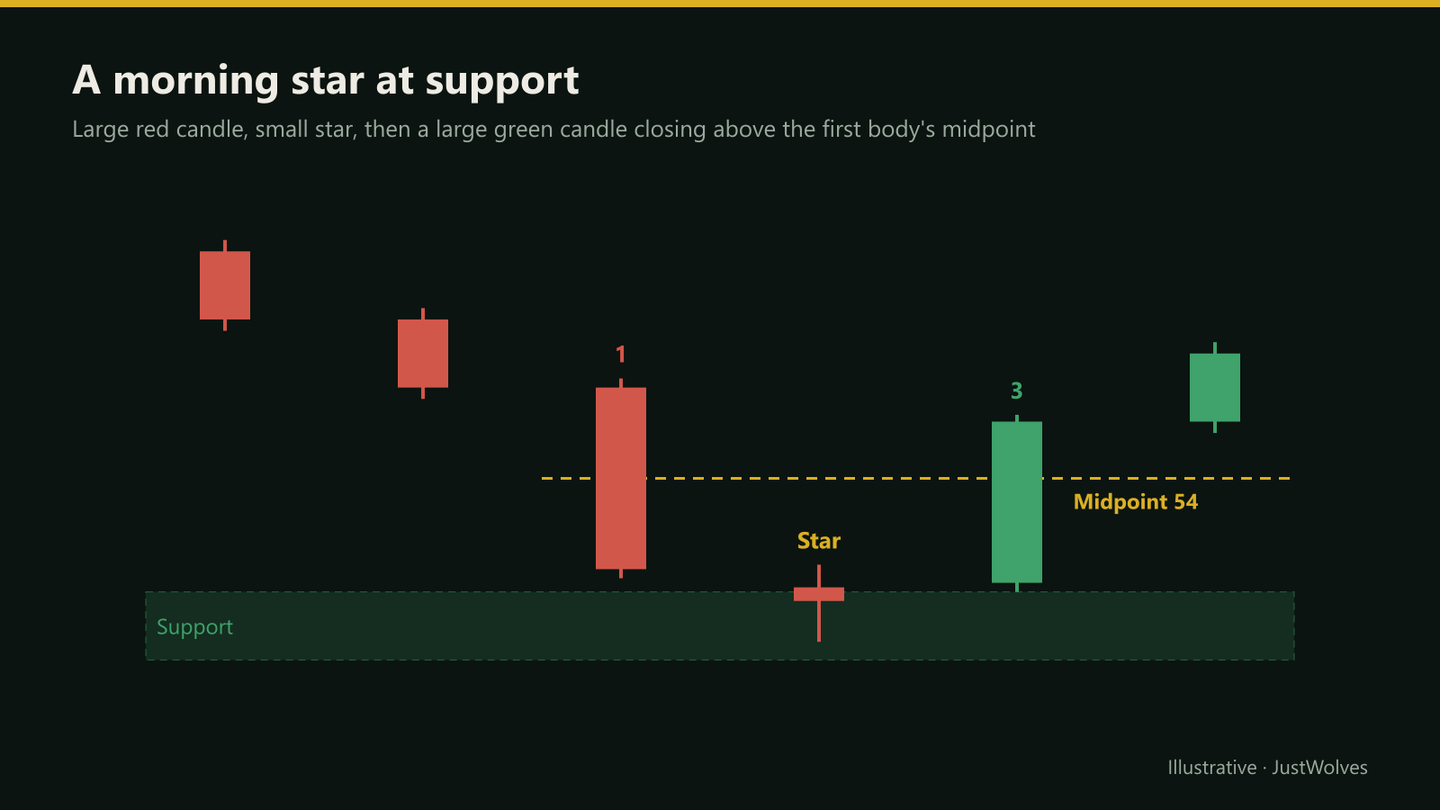
The Morning Star
Three candles after a decline
Step 1: Candle 1
A large bearish candle: sellers are in control.
Step 2: Candle 2 (the star)
A small-bodied candle, either colour, often gapping below the first body in stocks. Selling momentum stalls.
Step 3: Candle 3
A large bullish candle closing well into the first candle's body, commonly above its midpoint. Buyers take control.
The Evening Star
The evening star is the mirror after a rise: a large bullish candle, a small star at the top (often gapping above the first body in stocks), then a large bearish candle closing well into the first body, commonly below its midpoint. It suggests buyers have lost control at the high.
Doji Stars
When the middle candle is a doji, the patterns are called a morning doji star or evening doji star. Many traders consider these stronger, because the doji shows a more complete balance between buyers and sellers before the shift.
A related, rarer pattern is the abandoned baby, where the doji gaps away from both the first and third candles, leaving it isolated. It's seen mostly on stocks, since continuous markets rarely gap.
What Makes a Strong Star
- A clear prior move into a key level.
- A genuinely small middle candle, ideally a doji.
- A strong third candle that closes deep into, or beyond, the first body.
- Higher timeframe agreement, such as a morning star at daily support in a weekly uptrend.
Trading a Morning Star
Morning star at support
Step 1: Context
A decline into a marked support level or demand zone.
Step 2: Pattern
All three candles complete; the third closes above the first body's midpoint.
Step 3: Entry
On the third candle's close, or on a pullback toward its midpoint.
Step 4: Stop
Below the star's low.
Step 5: Target
The next resistance.
Real Case: A Morning Star on Mahindra & Mahindra
The chart below uses real daily candles for Mahindra & Mahindra from July 2025. Step through it to see a range break down, a morning star form just below the old range, and the trade that followed. It also shows a combination this lesson describes for evening stars, in mirror image: a failed breakout (here, a failed breakdown) together with a star pattern.
Real case: a morning star after a false breakdown, Mahindra & Mahindra, July 2025
Step 1 of 5
A range, then a breakdown
In early July 2025, Mahindra & Mahindra trades between about 3,123 and 3,221. On 11 July it breaks down hard: a large red candle from 3,158 to 3,073.2, closing below the range low.
- What to observe
- A large bearish candle: candle 1 of a possible morning star.
- Condition
- Watch whether selling continues.
Trading an Evening Star
The evening star is traded the same way in reverse. After a rally into resistance or a supply zone, wait for all three candles to complete. The third, bearish candle should close well into the first green body, ideally below its midpoint. Enter on that close or on a small bounce afterwards, with the stop above the star's high, and target the next support.
Evening stars that form at a prior swing high, where the star's wick briefly pokes above the earlier high before the third candle sells off, combine a failed breakout with the star pattern. Many traders find that combination more convincing than a star forming in open space below resistance.
Do Star Patterns Work? Our Test
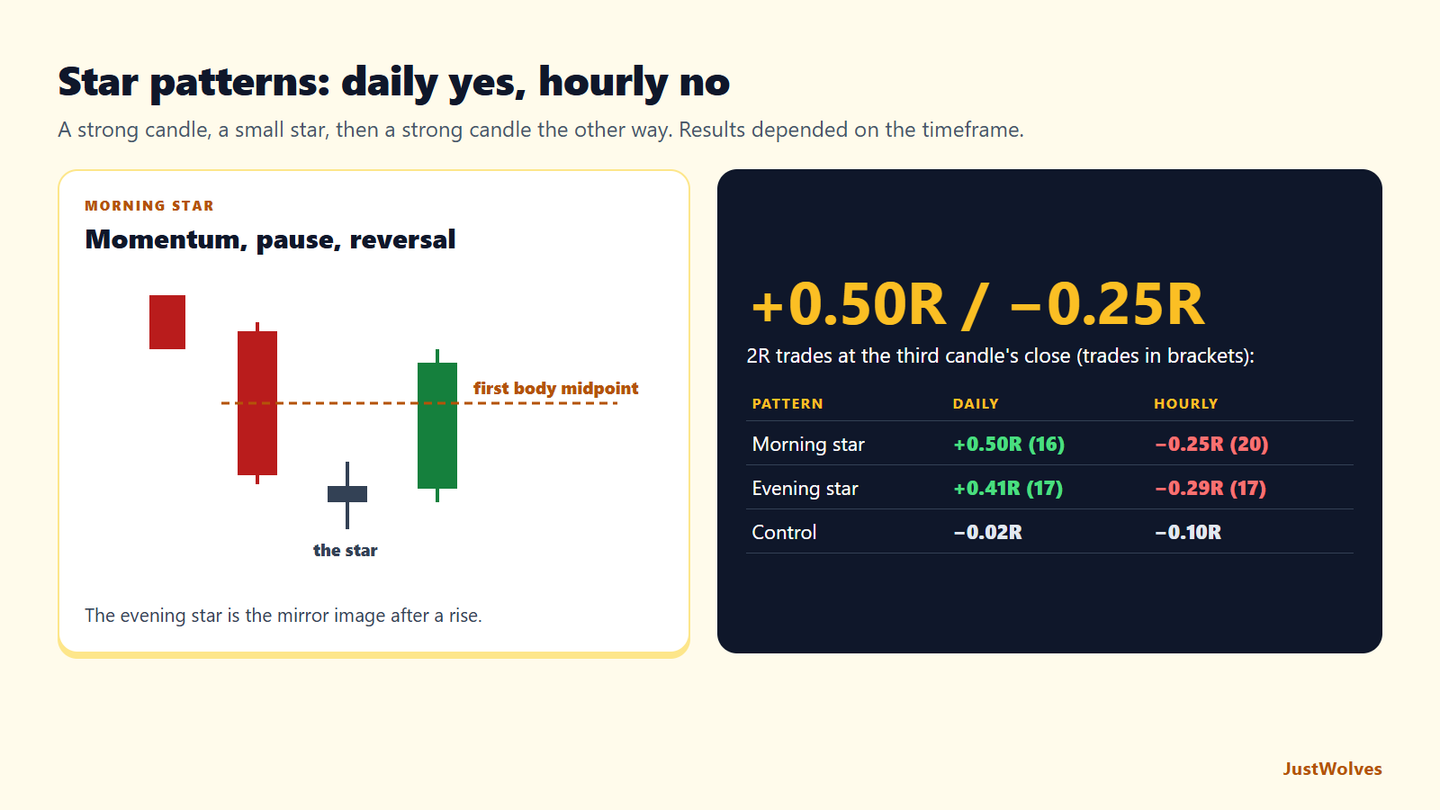
JustWolves tested both patterns on about two years of real daily candles for 20 large NSE stocks, NIFTY 50, four currency pairs and gold, and six months of hourly candles for the five markets. Morning star: after a fall of at least 1.5 average ranges, a red candle with a body of at least one average range; a star whose body is no more than 40% of the first body; and a green candle with a body of at least 0.7 average ranges, closing above the first body's midpoint. Gaps were not required, so the rule works in forex too. Evening star: the mirror image, tested on mirrored prices. Trades: at the third candle's close, stop beyond the whole pattern, 2R target.
| Setup | Daily | Hourly |
|---|---|---|
| Morning star, at the close | 16 trades, 50% wins, +0.50R | 20 trades, 25% wins, −0.25R |
| Evening star, at the close | 17 trades, 47% wins, +0.41R | 17 trades, 24% wins, −0.29R |
| Control: any candle, same trade | about 2,200 trades, −0.02 to −0.03R | about 2,500 trades, −0.07 to −0.10R |
The timeframe made the difference. On daily charts, both star patterns did clearly better than the control, with about half the trades reaching 2R. On hourly charts, both did worse than the control. That matches this lesson's point that higher-timeframe patterns carry more weight: a daily star records three full sessions of trading, while an hourly star can form from a few minutes of noise around a news release.
The samples are small (16 to 20 trades per group), so a few trades either way would change the numbers. Two practical conclusions still hold. First, if you trade stars, the daily chart is where our evidence supports them. Second, the three-candle confirmation makes the stop wide, as the Mahindra & Mahindra example shows: 81 points on a ₹3,128 stock, about 2.6%. Size the position to that stop, not to the size you would like to trade.
Practical Example
Hypothetically, a pharma stock falls into support at ₹980. A large red candle runs from ₹1,032 to ₹988. The next session opens at ₹985, trades between ₹974 and ₹990, and closes at ₹984: a small star. The third session opens at ₹986 and closes at ₹1,022, above the first body's midpoint of ₹1,010.
Sneha buys at ₹1,022 with a stop at ₹969, below the star's low, targeting ₹1,100 at the prior swing high: ₹53 of risk for ₹78 of reward.
Measuring the Mahindra & Mahindra Morning Star
| Measure | Calculation | Result |
|---|---|---|
| Candle 1 body | 3,158.0 − 3,073.2 | 84.8 points, about 1.6 average ranges |
| Star body | 3,092.1 − 3,072.8 | 19.3 points, 23% of candle 1 |
| Midpoint of candle 1 body | (3,158.0 + 3,073.2) ÷ 2 | 3,115.6 |
| Candle 3 close vs midpoint | 3,128.6 vs 3,115.6 | 13 points above it |
| Penetration of candle 1 body | (3,128.6 − 3,073.2) ÷ 84.8 | 65% |
The pattern passes every rule, but it is not a perfect textbook example. The star did not gap below the first body; it opened almost exactly at the first close, which is typical of liquid stocks in calm conditions. The third candle closed 65% of the way into the first body, not near its top. What made this one convincing was location: candle 1 had broken below a two-week range, and candle 3 closed back above that range low, showing that the breakdown had failed. Location and a failed break added more evidence than the shape alone.
Common Mistakes
- Entering on the star before the third candle confirms.
- Accepting a weak third candle that closes only slightly into the first body.
- Ignoring location.
- Requiring gaps in forex, where they rarely occur.
- Stops inside the pattern.
Professional Insight
The morning star is popular because it waits for confirmation by design. The cost is a later entry and a wider stop than a two-candle pattern. Experienced traders often refine the entry on a lower timeframe during the third candle, or wait for a pullback after it.
Risk Considerations
- Three-candle patterns mean wider stops.
- News-driven third candles can reverse quickly.
- Counter-trend stars fail more often.
Important Terminology
| Term | Meaning |
|---|---|
| Morning star | Bullish three-candle reversal after a decline. |
| Evening star | Bearish three-candle reversal after a rise. |
| Star | The small middle candle. |
| Doji star | A star pattern with a doji in the middle. |
| Abandoned baby | A doji star with gaps on both sides of the doji. |
What is a morning star pattern?
A three-candle bullish reversal: a large red candle, a small star candle, then a large green candle closing well into the first body.
What is an evening star?
The bearish mirror after a rise: a large green candle, a small star, then a large red candle closing well into the first body.
Does a morning star need a gap?
The classic definition includes a gap, common in stocks. In continuous markets, many traders accept the pattern without one.
What is a morning doji star?
A morning star where the middle candle is a doji.
Where does the stop go?
Usually beyond the star's extreme: below its low for a morning star, above its high for an evening star.
Is the morning star pattern reliable?
On daily charts it did well in our data: +0.50R per trade over 16 trades, with half reaching a 2R target. On hourly charts it averaged −0.25R over 20 trades. The sample is small, so test it on your own market and timeframe.
Practical Exercise
Find ten star patterns.
Your task
Step 1: Find ten
Morning or evening stars on daily charts.
Step 2: Measure
How far into the first body did the third candle close?
Step 3: Check location
At a marked level or not?
Step 4: Track outcomes
Did deeper closes and better locations lead to better follow-through in your sample?
Check Your Understanding
The middle candle of a star pattern shows:
Related Lessons
Previous module: Inside Bars and Outside Bars. Next: Three White Soldiers and Three Black Crows. See also Doji Candlestick Patterns.