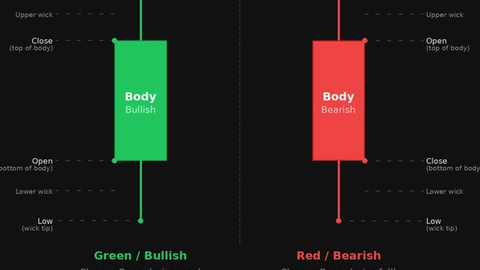
Candlestick Patterns: Complete Guide and Cheat Sheet
JustWolves is an educational platform and is not a SEBI-registered investment advisor. Trading financial instruments involves significant risk of loss and may not be suitable for all investors. Past performance is not indicative of future results. Read our full disclaimer →
What you'll learn
- Patterns can be grouped by number of candles, direction (bullish or bearish) and type (reversal, continuation or indecision)
- Every pattern describes who controlled the period and how much ground was held at the close
- The same pattern means different things in different places; location and trend come first
- Most patterns need confirmation from the next candle
- Use this page as a reference; each pattern has its own full lesson
In this article · 16 sections
This page brings the Candlestick course together in one place. It groups every pattern covered so far, summarises what each suggests, and links to the full lesson for each one. It also repeats the rules that apply to every pattern, because a cheat sheet without context is how most traders end up trading candles in the wrong places.
What You Will Learn
- How candlestick patterns are classified
- A summary of every major pattern
- The context rules that apply to all of them
- Where to go for the full lesson on each
Before You Start
This page summarises Modules 05.01 to 05.04. If you're new to candles, start with Candlestick Anatomy and Bullish vs Bearish Candles and Candle Strength.
How Patterns Are Classified
| Dimension | Categories | Examples |
|---|---|---|
| Number of candles | Single, two-candle, three-candle and more | Doji; engulfing; morning star |
| Direction | Bullish, bearish, neutral | Hammer; shooting star; doji |
| Type | Reversal, continuation, indecision | Engulfing; rising three methods; harami |
Single-Candle Patterns
| Pattern | Shape | Usually suggests |
|---|---|---|
| Doji | Open ≈ close; tiny body | Indecision |
| Hammer | Small body high, long lower wick, after a fall | Possible bullish reversal |
| Hanging man | Same shape after a rise | Warning of selling |
| Shooting star | Small body low, long upper wick, after a rise | Possible bearish reversal |
| Inverted hammer | Same shape after a fall | Early, weaker bullish hint |
| Marubozu | Full body, no wicks | Strong control by one side |
| Pin bar | Long tail, small body at the other end | Rejection of a price area |
Full lessons: Doji, Hammer and Hanging Man, Inverted Hammer and Shooting Star, Marubozu, Pin Bars.
Two-Candle Patterns
| Pattern | Shape | Usually suggests |
|---|---|---|
| Bullish / bearish engulfing | Second body covers the first, opposite direction | Strong shift in control |
| Harami | Small body inside the previous large body | Momentum stalling |
| Piercing line / dark cloud cover | Second candle closes past the first body's midpoint | Moderate shift in control |
| Tweezer top / bottom | Matching highs or lows | Price rejected twice |
| Inside bar / outside bar | Range inside / covering the previous range | Contraction / expansion |
Full lessons: Engulfing, Harami, Piercing Line and Dark Cloud Cover, Tweezers, Inside and Outside Bars.
Three-Candle and Longer Patterns
| Pattern | Shape | Usually suggests |
|---|---|---|
| Morning / evening star | Strong candle, small star, strong opposite candle | Reversal with built-in confirmation |
| Three white soldiers / black crows | Three strong candles in one direction | Sustained control |
| Three line strike | Three trend candles reversed by one large candle | Sharp swing; context decides |
| Rising / falling three methods | Strong candle, small pause, strong candle | Continuation |
| Three inside / outside up and down | Harami or engulfing plus confirmation | Confirmed reversal |
Full lessons: Morning and Evening Star, Three White Soldiers and Three Black Crows, Three Line Strike and Others.
Patterns in a Market Cycle
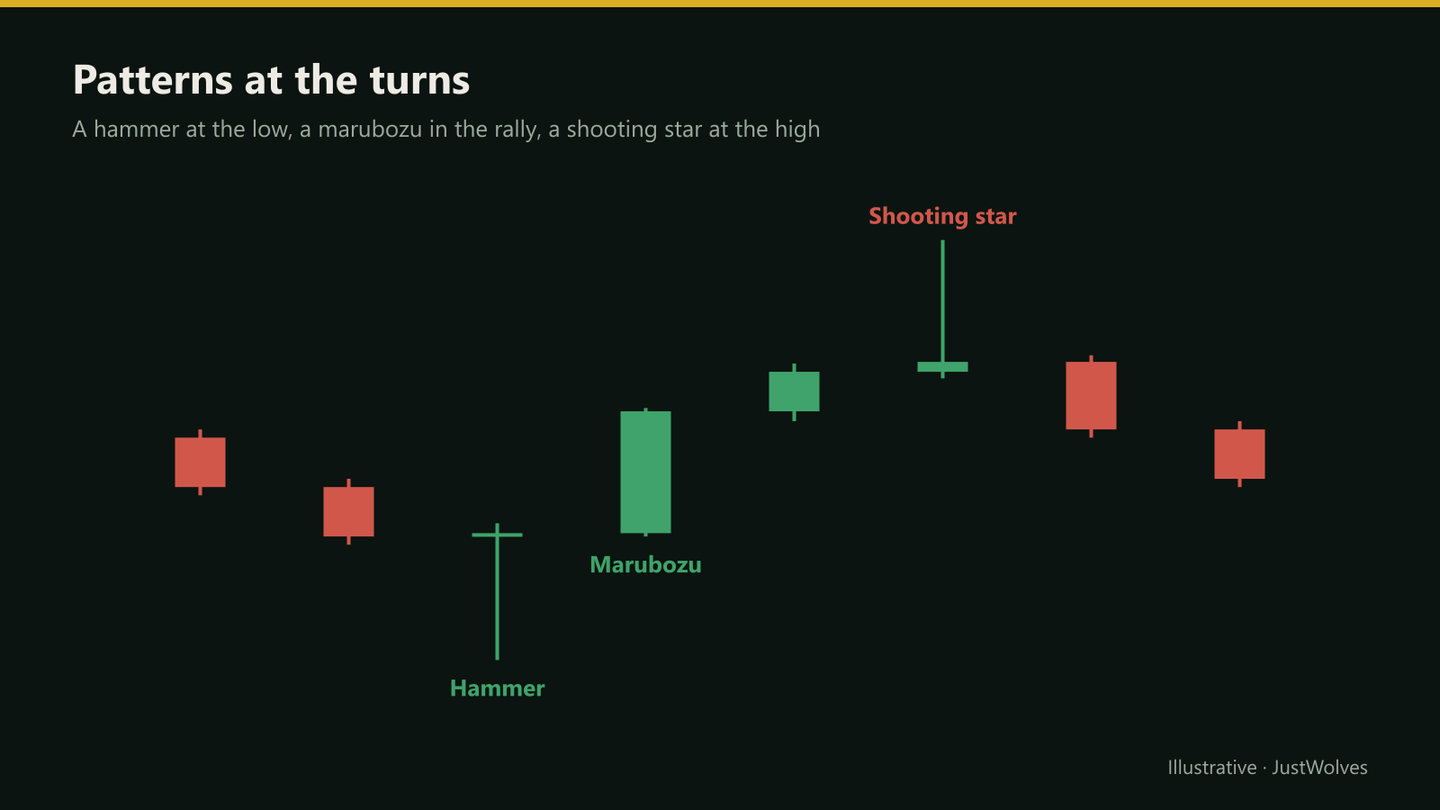
Real Chart: Five Patterns in One Month
Cheat sheets show patterns one at a time, on clean schematic charts. Real charts are messier. The chart below uses real daily candles for Reliance Industries from December 2025 and January 2026, a period that contains five of the patterns on this page. Step through it and notice how differently each one turned out.
Real chart: five patterns in one month, Reliance Industries, December 2025 – January 2026
Step 1 of 5
A drift higher
Through late December 2025, Reliance trades between about 1,537 and 1,581, then jumps to 1,570.4 on 31 December.
- What to observe
- No clear trend, then a push higher.
- Condition
- Nothing to read yet.
The lesson from this month is the one this page keeps repeating. The shooting star was cancelled by the next close. The bearish engulfing pattern formed at the high and marked the start of a 15% decline. The inside bar broke in the direction of the trend. The hammer, which looks like a buying signal on any cheat sheet, failed within a day because it formed in the middle of a strong decline, not at a level after the move had run its course.
Rules That Apply to Every Pattern
- Location first: a pattern at a meaningful level after a clear move is worth noting; the same pattern mid-range usually isn't.
- Trend matters: reversal patterns against a strong trend fail more often; patterns in the trend's direction tend to be more useful.
- Confirmation: most patterns become more useful once the next candle closes in the expected direction.
- Timeframe: daily and higher-timeframe patterns carry more weight than very short-timeframe ones.
- Risk: every pattern gives a natural stop beyond its extreme; size your position from that distance.
The Scorecard: How Every Pattern Performed in Our Tests
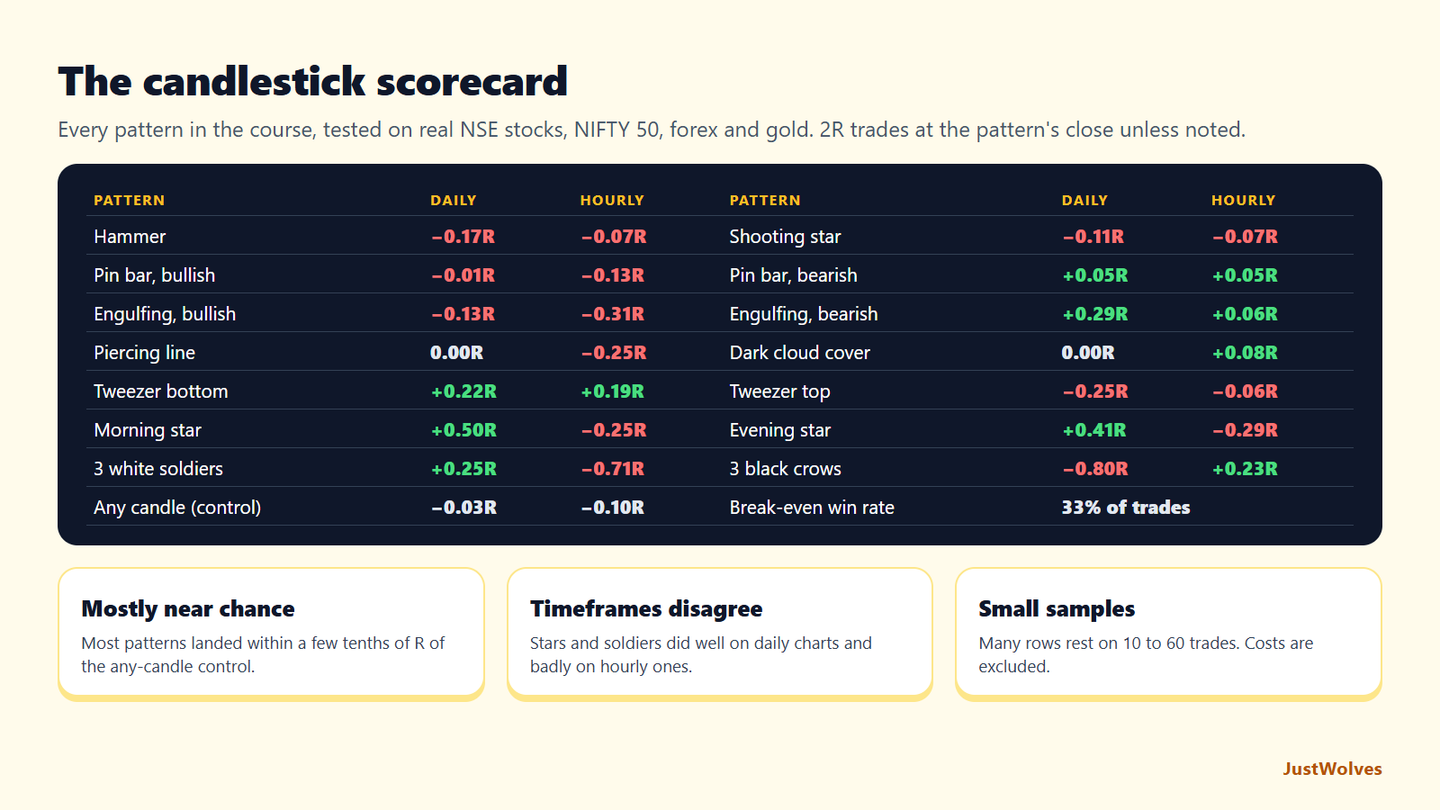
Throughout this course, JustWolves tested each pattern on about two years of real daily candles for 20 large NSE stocks, NIFTY 50, four currency pairs and gold, and six months of hourly candles for the five markets. Each pattern lesson explains its exact definition. The table below brings the main results together in one place. Every row is a 2R trade entered at the pattern's close, with the stop just beyond the pattern; bearish patterns were tested as short trades.
| Pattern | Daily | Hourly | Verdict |
|---|---|---|---|
| Hammer | −0.17R (47) | −0.07R (55) | No better than chance |
| Shooting star | −0.11R (37) | −0.07R (45) | No better than chance |
| Pin bar, bullish / bearish | −0.01R / +0.05R | −0.13R / +0.05R | Close to the control |
| Engulfing, bullish / bearish | −0.13R / +0.29R | −0.31R / +0.06R | Bearish version better, small samples |
| Piercing line / dark cloud cover | 0.00R / 0.00R | −0.25R / +0.08R | Rare; about break-even |
| Tweezer bottom / top | +0.22R / −0.25R | +0.19R / −0.06R | Bottoms positive on both timeframes |
| Morning / evening star | +0.50R / +0.41R | −0.25R / −0.29R | Daily only, small samples |
| Three white soldiers (at close / pullback) | +0.25R / +0.25R | −0.71R / +0.29R | Wait for the pullback |
| Control: any candle, same trade | −0.02 to −0.03R | −0.07 to −0.10R | The benchmark |
Three things stand out when you see everything together.
Most patterns are close to chance. The control row shows what happens if you place the same trade on any candle at all. Many famous patterns, including the hammer, shooting star and pin bar, landed within a few tenths of R of that benchmark. A pattern can look convincing on a chart and still add little on its own.
The few positive results are fragile. Tweezer bottoms were positive on both timeframes. Morning and evening stars were strongly positive on daily charts, but negative on hourly ones. Bearish engulfing patterns beat bullish ones. Most of these rows rest on 15 to 60 trades, so a different two years could look quite different.
How you enter matters as much as what you see. The clearest improvement in the whole course came from entry method, not from the pattern: waiting for a pullback after three white soldiers turned a heavy loss into a gain on hourly charts, and waiting for a pullback after a marubozu helped in every group we tested. The same idea, a better price and a smaller stop, applies to many patterns.
Use the scorecard alongside the classification tables above. The tables tell you what a pattern is; the scorecard tells you how much weight it carried in real markets, at least in the period we tested.
Practical Example
Hypothetically, Pooja keeps this page open while reviewing a daily chart of a bank stock. Price has fallen to a support level at ₹780 marked last month. She sees a candle with a small body near ₹792 and a lower wick to ₹776: a hammer at support.
The cheat sheet tells her the name and the usual reading. The rules section reminds her to check the trend (a pullback inside a weekly uptrend), wait for confirmation (the next candle closes at ₹801, above the hammer's high), and plan risk (stop below ₹776, about ₹25 from a ₹801 entry). Only then does she consider the trade.
Common Mistakes
- Using a cheat sheet without context.
- Memorising names instead of reading candles.
- Counting overlapping patterns as separate confirmations.
- Ignoring timeframe.
- Trading patterns without a stop.
Professional Insight
Many experienced traders focus on three or four patterns they understand deeply, usually engulfing patterns, pin bars and stars, and read everything else candle by candle. A cheat sheet is most useful for recognising patterns, not for choosing which ones to trade.
Risk Considerations
- Pattern reliability varies by market, timeframe and context.
- Clear patterns are easier to spot in hindsight than in real time.
- Stops beyond pattern extremes can be wide on volatile days.
Important Terminology
| Term | Meaning |
|---|---|
| Reversal pattern | A pattern suggesting the prior move may end. |
| Continuation pattern | A pattern suggesting the trend will resume. |
| Indecision pattern | A pattern showing balance between buyers and sellers. |
| Confirmation | A following candle closing in the expected direction. |
| Context | The trend, level and timeframe a pattern forms in. |
What are candlestick patterns?
Recognisable shapes formed by one or more candles that traders use to read the balance between buyers and sellers.
Which candlestick patterns are most important?
Engulfing patterns, pin bars (including hammers and shooting stars), dojis and morning and evening stars are among the most widely used.
Do candlestick patterns work?
They can be useful as evidence in context, but no pattern guarantees direction. The reliability lesson in this module covers their limits.
How many candlestick patterns should I learn?
A handful learned well, combined with an understanding of body, wicks and close location, covers most situations.
Do candlestick patterns work in forex and crypto?
The same patterns appear in every market. Gap-based patterns are less common in continuous markets like forex.
Which candlestick pattern is the most reliable?
In our tests, no single pattern was reliable on its own. The best results came from tweezer bottoms (+0.22R daily, +0.19R hourly) and from morning and evening stars on daily charts, but those were small samples. Most famous patterns, such as the hammer and pin bar, performed close to the same trade on any candle.
What is a candlestick pattern success rate?
It is the share of pattern trades that reach their target. A 2R trade needs about 33% winners to break even, and in our data any random candle traded the same way already won about 30–33% of the time, so a success rate only means something when compared with that benchmark.
Practical Exercise
Build your own cheat sheet.
Your task
Step 1: Choose five patterns
The ones you find easiest to recognise.
Step 2: Find two examples of each
On daily charts you follow.
Step 3: Note the context
Trend, level and the next candle for each.
Step 4: Keep the best
Save screenshots as your personal reference.
Check Your Understanding
A harami is classified as:
Related Lessons
Previous module: Other Multi-Candle Formations. Next: Candlestick Patterns at Support and Resistance. See also How Reliable Are Candlestick Patterns?.