Harami Patterns: Bullish, Bearish and Harami Cross
JustWolves is an educational platform and is not a SEBI-registered investment advisor. Trading financial instruments involves significant risk of loss and may not be suitable for all investors. Past performance is not indicative of future results. Read our full disclaimer →
What you'll learn
- A harami is a large candle followed by a small candle whose body sits inside the first body
- Bullish harami follows a decline; bearish harami follows a rise
- A harami cross has a doji as the second candle
- It shows momentum stalling, not a confirmed reversal
- Most traders wait for a break of the first candle's range before acting
In this article · 16 sections
The harami is the opposite of the engulfing pattern. Instead of a second candle overwhelming the first, the second candle is small and sits inside the first candle's body. The name comes from a Japanese word often translated as 'pregnant', describing the small candle held within the large one. This lesson covers how to identify the harami, what it suggests, and how to trade it with confirmation.
What You Will Learn
- How bullish and bearish harami patterns form
- What a harami cross is
- What the pattern does and doesn't tell you
- How to trade it with confirmation
Before You Start
Read Bullish and Bearish Engulfing Patterns and Doji Candlestick Patterns first.
The Pattern
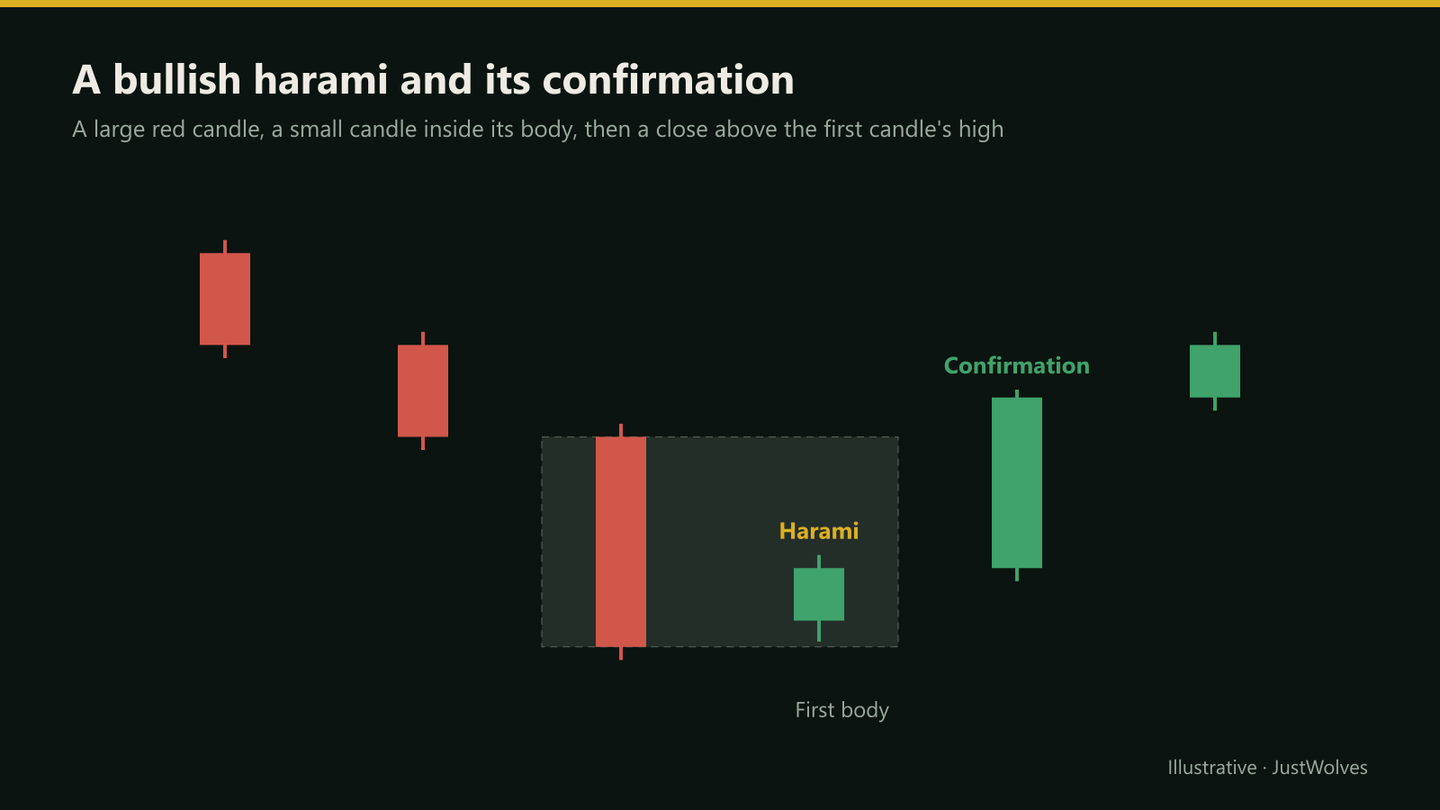
- Bullish harami: after a decline, a large bearish candle is followed by a small candle whose body lies entirely within the first body. The second candle is often, but not necessarily, bullish.
- Bearish harami: after a rise, a large bullish candle is followed by a small candle whose body sits inside the first body.
- Harami cross: a harami where the second candle is a doji. Many traders consider it a stronger sign of stalling.
What It Suggests
A large candle shows strong momentum. A small candle inside it shows that momentum stalling: the next period couldn't extend the move and traded in a much narrower band. That's all the harami says directly.
It doesn't show the other side taking control, which is why the harami is generally considered a weaker reversal signal than the engulfing pattern. It's best read as a warning that the move may be pausing.
Trading the Harami
Bullish harami at support
Step 1: Context
A decline into a marked support level.
Step 2: Pattern
A large red candle, then a small candle inside its body.
Step 3: Confirmation
A later candle closes above the first (large) candle's high, or at least above its midpoint.
Step 4: Stop
Below the pattern's low.
Step 5: Target
The next resistance level.
Harami Versus Continuation
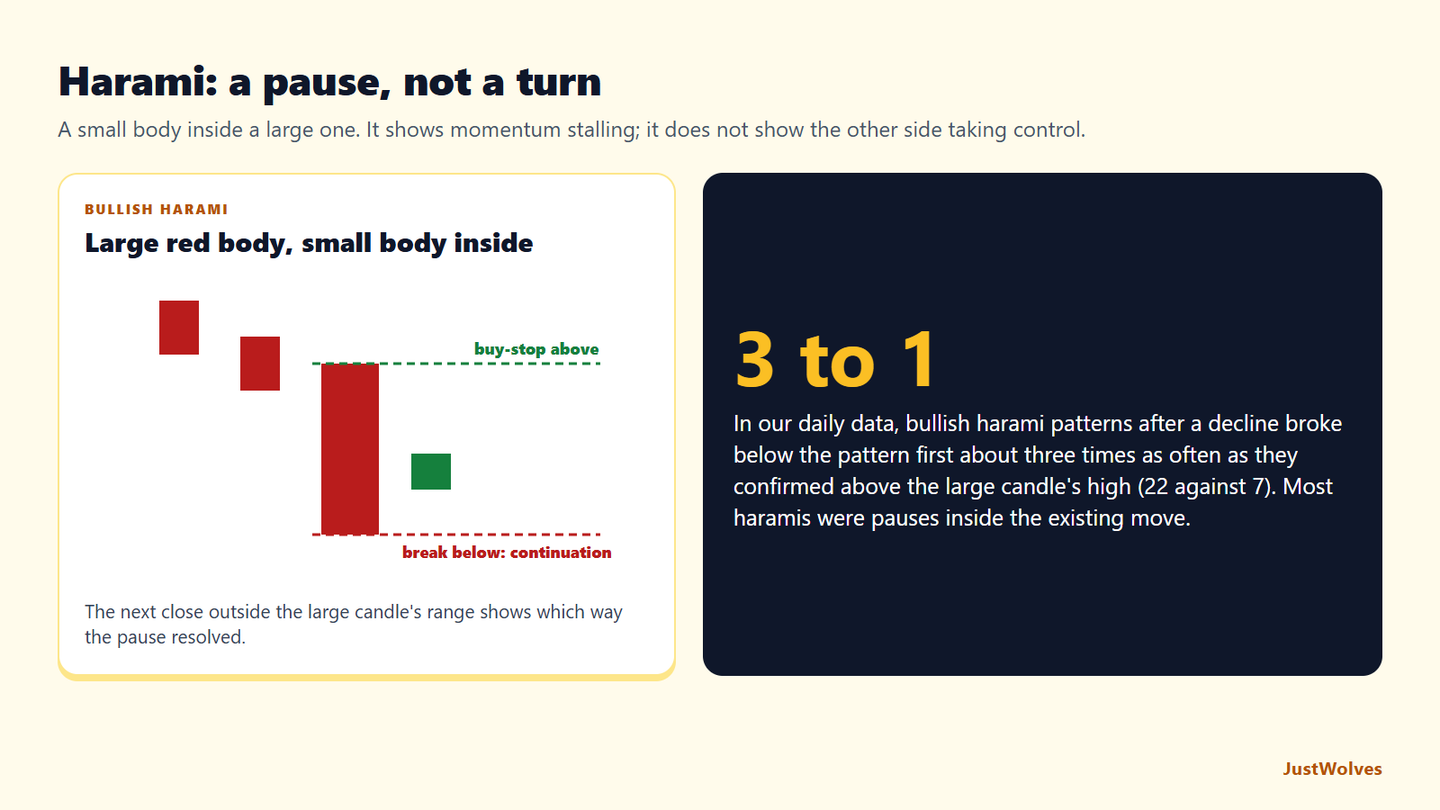
Many harami patterns resolve in the direction of the original move rather than reversing it. A large red candle followed by a small candle is, after all, also how a pause in a downtrend looks. When the next candle breaks below the first candle's low, the harami has become a continuation signal.
That's why the confirmation step matters. The harami tells you the market is pausing; the break out of the first candle's range tells you which way it resolved. Some traders trade both outcomes, placing a buy-stop above the first candle's high and a sell-stop below its low, and cancelling whichever doesn't trigger.
Real Case: A Harami That Broke Both Ways
The chart below uses real daily candles for Reliance Industries from August and September 2026. It is an uncomfortable but honest example of why this lesson calls the harami a weak signal: the pattern broke down, then up, then down again within a week.
Real case: a harami that broke both ways, Reliance, August–September 2026
Step 1 of 5
A drift lower
Through August 2026, Reliance drifts down from about 1,329 to 1,298.
- What to observe
- A gentle decline.
- Condition
- Nothing to do yet.
Bearish Harami in Practice
The bearish harami mirrors everything above. After a strong rally into resistance, a large green candle is followed by a small candle sitting inside its body. Buying momentum has stalled. A later close below the large candle's low, or at least below its midpoint, is the confirmation many traders want before shorting, with the stop above the pattern's high.
If instead price closes above the large green candle's high, the pause has resolved upward and the harami has become a continuation signal. Recording which way each harami resolves in your own markets is the best way to learn how much weight to give it.
Do Haramis Reverse or Continue? Our Test
JustWolves tested harami patterns on about two years of real daily candles for 20 large NSE stocks, NIFTY 50, four currency pairs and gold, and six months of hourly candles for the five markets. Bullish harami: after a fall of at least 1.5 average ranges, a large red candle (body at least one average range) followed by a candle whose body sits inside it. We then watched the next three candles: did price first close above the large candle's high (confirmation) or below the pattern's low (continuation)?
| Pattern | Confirmed first | Broke the other way first |
|---|---|---|
| Bullish harami, daily | 7 | 22 |
| Bullish harami, hourly | 9 | 24 |
| Bearish harami, daily (mirror image) | 5 | 15 |
| Bearish harami, hourly (mirror image) | 12 | 16 |
Haramis resolved in the direction of the existing move more often than they reversed it: roughly three times as often for bullish haramis. That is exactly what this lesson's "Harami Versus Continuation" section warns about: a large candle followed by a small one is also what an ordinary pause in a trend looks like.
The confirmed reversals that did happen were too few to measure reliably (5 to 12 trades per group, with mixed results). The practical takeaway: use a harami as a warning that momentum has stalled, for example to tighten a stop on an existing trade, and let the next close outside the large candle decide the direction.
Practical Example
Hypothetically, a telecom stock falls into support at ₹1,180. A large red candle runs from ₹1,232 to ₹1,186, with a low of ₹1,180. The next candle opens at ₹1,190 and closes at ₹1,201: a bullish harami.
Two sessions later, the stock closes at ₹1,240, above the large candle's high of ₹1,236. Nikhil buys at ₹1,240 with a stop at ₹1,176, below the pattern's low, targeting ₹1,330 at the next resistance: ₹64 of risk for ₹90 of reward.
Harami vs Engulfing: Opposite Messages
| Engulfing | Harami | |
|---|---|---|
| Second body vs first body | Larger, covers it | Smaller, inside it |
| What it shows | The other side took control | Momentum stalled |
| Strength as a reversal | Stronger | Weaker |
| What to do next | Plan an entry at the level | Wait for a break out of the large candle |
It helps to see the two patterns as opposites. An engulfing pattern shows the second session overpowering the first; a harami shows the second session failing to go anywhere. Both appear after strong moves, but only the engulfing pattern shows a change of control. In our data, neither was a reliable signal on its own, but the harami was especially prone to resolving in the original direction.
Common Mistakes
- Treating a harami as a confirmed reversal.
- Ignoring the size of the first candle; the pattern needs a large first candle.
- Trading harami mid-range.
- Confusing bodies and ranges when comparing with inside bars.
- Stops too tight inside the first candle.
Professional Insight
Experienced traders often treat the harami as a reason to stop trading in the direction of the large candle, rather than a reason to trade against it. The reversal trade only comes after price confirms by breaking the first candle's range.
Risk Considerations
- Confirmation entries can be far from the stop.
- Many harami resolve as continuation.
- Gaps can skip the confirmation level.
Important Terminology
| Term | Meaning |
|---|---|
| Harami | A small body inside the previous large body. |
| Bullish harami | A harami after a decline. |
| Bearish harami | A harami after a rise. |
| Harami cross | A harami whose second candle is a doji. |
| Inside bar | A candle whose full range is inside the previous range. |
What is a harami pattern?
A large candle followed by a small candle whose body lies within the first candle's body.
Is a bullish harami a buy signal?
Not on its own. It shows selling momentum stalling; most traders wait for a close above the first candle's high or midpoint. In our study of real daily data, bullish haramis after a decline broke below the pattern first 22 times and confirmed above the large candle's high only 7 times.
What is a harami cross?
A harami in which the second candle is a doji.
What is the difference between harami and engulfing?
In a harami the second body is inside the first; in engulfing the second body covers the first.
What does harami mean?
It's a Japanese word commonly translated as 'pregnant', describing the small candle within the large one.
What happens if a harami breaks both ways?
It happens. In a real Reliance example from August–September 2026, a harami broke down, reversed above the large candle the next day, then fell back below the pattern within a week, so orders on both sides would have lost.
Practical Exercise
Track ten harami patterns.
Your task
Step 1: Find ten
At support or resistance after clear moves.
Step 2: Wait for resolution
Which side of the first candle's range broke first?
Step 3: Record
Reversal or continuation?
Step 4: Summarise
How often did the harami lead to a reversal in your sample?
Check Your Understanding
In a harami, the second candle's body:
Related Lessons
Previous: Bullish and Bearish Engulfing Patterns. Next: Piercing Line and Dark Cloud Cover. See also Doji Candlestick Patterns.