Tweezer Tops and Bottoms
JustWolves is an educational platform and is not a SEBI-registered investment advisor. Trading financial instruments involves significant risk of loss and may not be suitable for all investors. Past performance is not indicative of future results. Read our full disclaimer →
What you'll learn
- A tweezer top is two or more adjacent candles with matching (or nearly matching) highs after a rise
- A tweezer bottom is the same with matching lows after a decline
- The matching extreme shows a price tested twice and rejected twice
- Tweezers are stronger when combined with another pattern, such as an engulfing or pin bar
- The stop goes just beyond the matched level
In this article · 17 sections
Sometimes two candles in a row reach exactly the same high or low and turn back both times. That matching extreme forms a tweezer top or bottom, named after the two prongs of a pair of tweezers. It's a simple, visual way to see a price being tested and rejected twice. This lesson covers how to identify tweezers, what makes them stronger, and how to trade them.
What You Will Learn
- How tweezer tops and bottoms form
- Why matching highs or lows matter
- How to judge their strength
- How to trade them
Before You Start
Read Piercing Line and Dark Cloud Cover first.
The Pattern
- Tweezer top: after a rise, two adjacent candles with the same (or nearly the same) high. Classically the first is bullish and the second bearish.
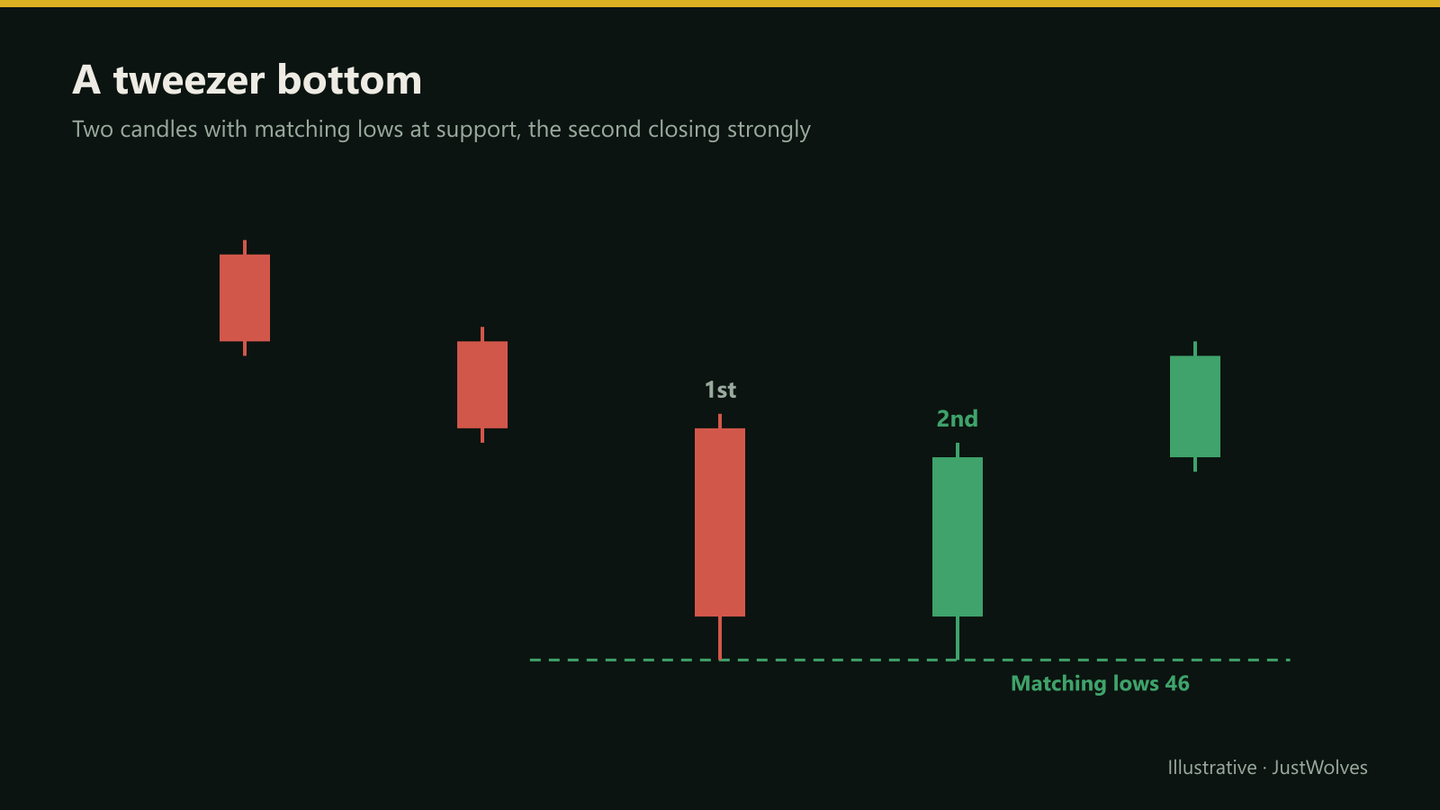
- Tweezer bottom: after a decline, two adjacent candles with the same or nearly the same low. Classically the first is bearish and the second bullish.
'Nearly the same' is a judgment call. Many traders accept a difference of a few ticks on liquid stocks, or a small fraction of the average range.
Why It Matters
A matching low means sellers pushed price to the same point in two consecutive periods and couldn't break it either time. That suggests buying interest at that exact price.
In smart money terms, matching highs and lows are also visible equal highs and equal lows, which can attract stop orders. A tweezer can be swept later, so the stop should sit beyond the level with a buffer.
Judging Strength
- Second candle quality: a second candle that's also an engulfing, piercing line or pin bar adds evidence.
- Location: at a marked level after a clear move.
- Exactness: truly matching extremes are more striking than loosely similar ones.
- Timeframe: daily tweezers carry more weight than intraday ones, where matching ticks are common by chance.
Beyond Two Candles
Tweezers don't have to be strictly adjacent. Some traders include matching highs or lows separated by one or two small candles, as long as nothing in between went beyond the level. When the same level is tested several times over a longer period, it starts to look more like a double top or bottom, covered in Reversal Chart Patterns.
The underlying idea is the same at every scale: a price that holds more than once is a level the market is defending, until it isn't.
Trading a Tweezer
Tweezer bottom at support
Step 1: Context
A decline into a marked support level.
Step 2: Pattern
Two adjacent candles with matching lows; the second closes in its upper half.
Step 3: Entry
On the second candle's close, or on a break of its high.
Step 4: Stop
Below the matched low, with a buffer for sweeps.
Step 5: Target
The next resistance.
Real Case: A Tweezer Bottom on NIFTY 50
The chart below uses real daily candles for NIFTY 50 from September 2026. Step through it to see two sessions reach the same low within 2.5 points, the trade that followed, and what happened to the level afterwards.
Real case: a tweezer bottom on NIFTY 50, September 2026
Step 1 of 5
A two-week decline
NIFTY 50 slides from 24,055.8 on 1 September 2026 to 23,398.1 on 11 September, with lower highs almost every day.
- What to observe
- A steady decline.
- Condition
- Watch for signs of support.
Tweezer Tops in Detail
Everything above applies in mirror image to tweezer tops. After a rally, the first candle makes a high, often closing strongly. The next candle reaches the same high, fails, and closes lower, ideally in its bottom half. Buyers tried twice to push through the same price and were turned back both times.
Tweezer tops are especially worth noting when the matched high sits at a previous swing high or a round number such as ₹1,000 or a Nifty level ending in 00. Those are prices where many traders already expect sellers, and where stop orders from short sellers often sit just above. A tweezer top that later breaks upward on a strong close is a useful signal too: it tells you the sellers who defended the level twice have been overwhelmed.
Do Tweezers Work? Our Test
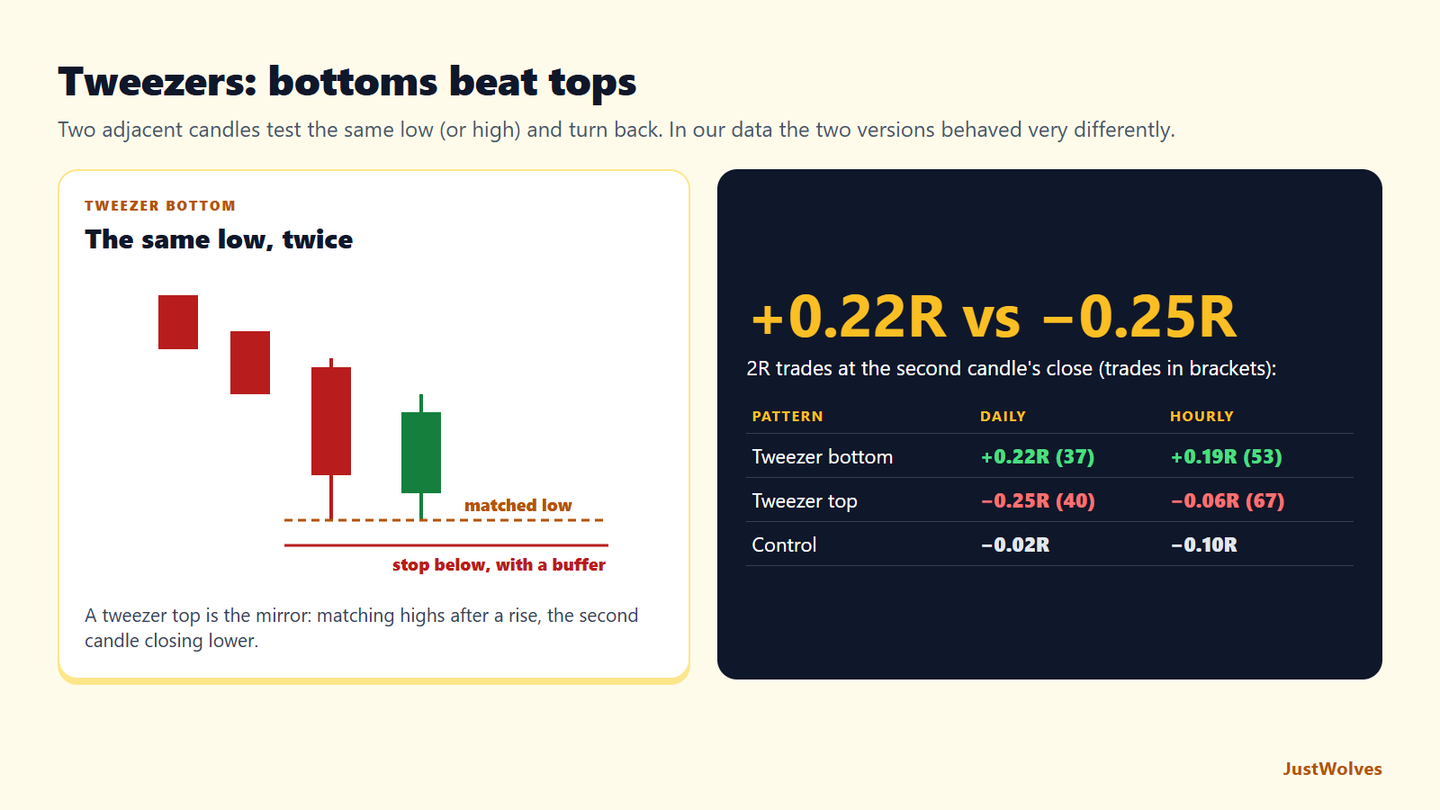
JustWolves tested tweezers on about two years of real daily candles for 20 large NSE stocks, NIFTY 50, four currency pairs and gold, and six months of hourly candles for the five markets. Tweezer bottom: after a fall of at least 1.5 average ranges over five candles, a red candle followed by a green candle whose low is within 5% of an average range of the red candle's low. Tweezer top: the mirror image after a rise, tested on mirrored prices. Trades: at the second candle's close, stop just beyond the matched extreme, 2R target.
| Setup | Daily | Hourly |
|---|---|---|
| Tweezer bottom, at the close | 37 trades, 41% wins, +0.22R | 53 trades, 40% wins, +0.19R |
| Tweezer top, at the close | 40 trades, 25% wins, −0.25R | 67 trades, 31% wins, −0.06R |
| Control: any candle, same trade | about 2,200 trades, −0.02 to −0.03R | about 2,500 trades, −0.07 to −0.10R |
This is one of the clearer results in our candlestick studies. Tweezer bottoms did better than the control on both timeframes, with about four in ten trades reaching 2R. Tweezer tops did worse than the control, especially on daily charts, where only a quarter reached the target.
Why the difference? It is not simply that markets drifted up during the test: the control trades did about equally badly in both directions. With 37 to 67 trades per group, part of the gap may be chance, and a different period could narrow it. So treat the result as useful but conditional. It fits this lesson's advice to judge a tweezer by the higher-timeframe trend and the level it forms at, rather than by the matching extremes alone, and it is a good reason to keep separate records for tops and bottoms.
A second, practical point: tweezers usually produce a tight stop. Because the stop sits just beyond a precise, twice-tested price, the risk per trade is often smaller than for patterns with long tails, such as hammers. A tight stop means each point of follow-through is worth more in R, but also that the stop is easier to reach, so the buffer beyond the level matters.
Practical Example
Hypothetically, Nifty falls into support at 23,650. One day's low is 23,612 and it closes at 23,640. The next day's low is also 23,612, but it closes at 23,745, near its high.
Aditi buys at 23,750 with a stop at 23,580, below the matched low with a buffer, targeting 24,050 at the prior swing high: 170 points of risk for 300 points of reward.
Measuring the NIFTY 50 Tweezer
| Measure | Values | Result |
|---|---|---|
| Prior decline | 24,055.8 (1 Sep) to 23,118.6 (15 Sep) | 937 points, about 3.9% |
| Low of the first (red) candle | 23,118.6 | Closed at its low |
| Low of the second (green) candle | 23,116.1 | 2.5 points lower |
| Difference vs the average range | 2.5 ÷ about 174 | 1.4% of an average day |
| Second candle close location | (23,217.6 − 23,116.1) ÷ 168.7 | 60% up its range |
The match is exceptionally close, well inside the tolerance this lesson suggests. The second candle is weaker than ideal, though: it closed only 60% of the way up its range, with a small body. The first candle closing at its very low was also a warning that sellers were still active. In this case, the bounce was enough to reach 2R before the level broke, but a trader who had waited for a stronger second candle would have had no trade at all. That trade-off, waiting for more evidence versus taking the setup as it is, is worth tracking in your own records.
Common Mistakes
- Forcing loose matches into tweezers.
- Ignoring the second candle's close.
- Stops exactly at the matched level, where sweeps are common.
- Trading intraday tweezers with no level behind them.
- Counting overlapping patterns as extra confirmation.
Professional Insight
Experienced traders tend to see tweezers less as a standalone pattern and more as a small double test of a level. The useful question is whether that level matters on the higher timeframe, and whether the second test ended with a strong close.
Risk Considerations
- Matched levels attract stops, making sweeps likely.
- Tweezers are common and often meaningless mid-range.
- Gaps can open through the level.
Important Terminology
| Term | Meaning |
|---|---|
| Tweezer top | Matching highs on adjacent candles after a rise. |
| Tweezer bottom | Matching lows on adjacent candles after a decline. |
| Equal highs/lows | Repeated extremes that may attract stop orders. |
| Sweep | A brief move beyond a level that then reverses. |
| Buffer | Extra distance added beyond a level for the stop. |
What is a tweezer top?
Two adjacent candles after a rise with the same or nearly the same high, showing a price rejected twice.
What is a tweezer bottom?
Two adjacent candles after a decline with matching lows.
How exact do the highs or lows need to be?
Many traders accept small differences relative to the instrument's typical range.
Are tweezers reliable?
They're more useful at key levels with a strong second candle. On their own, they're common and weak.
Where should the stop go?
Beyond the matched level with a buffer, since equal highs and lows often attract sweeps.
Is a tweezer bottom a good buy signal?
In our data, tweezer bottoms after a decline did better than the control: +0.22R on daily charts over 37 trades and +0.19R on hourly charts over 53, with 2R targets. That is encouraging but based on a specific two-year period, so confirm it on your own market.
Do tweezer tops work as well as tweezer bottoms?
Not in our sample. Tweezer tops shorted at the second candle's close averaged −0.25R on daily charts and −0.06R on hourly charts, worse than the control, on 40 and 67 trades.
Practical Exercise
Find tweezers at levels.
Your task
Step 1: Find ten
Tweezer tops or bottoms on daily charts.
Step 2: Check location
At a marked level or not?
Step 3: Check overlap
Is the pair also an engulfing or piercing pattern?
Step 4: Track sweeps
Was the matched level later swept?
Check Your Understanding
A tweezer bottom has:
Related Lessons
Previous: Piercing Line and Dark Cloud Cover. Next: Inside Bars and Outside Bars. See also Equal Highs and Equal Lows.