
How to Keep a Trading Journal: What to Record and How to Review It
JustWolves is an educational platform and is not a SEBI-registered investment advisor. Trading financial instruments involves significant risk of loss and may not be suitable for all investors. Past performance is not indicative of future results. Read our full disclaimer →
What you'll learn
- A journal is the only reliable record of what you actually do, as opposed to what you think you do
- Record the plan before the trade, the result after it, and how you felt during it
- Measure every trade in R so results are comparable regardless of size
- A short weekly review turns the journal into decisions
- Tag trades by setup and by rule-following to see what really makes or loses money
In this article · 15 sections
Memory is a poor record-keeper. It remembers the big win, softens the losses and forgets the trades you never meant to take. A trading journal fixes that. It is the raw material for every measurement in this course (expectancy, drawdown, rule adherence), and for most traders it is the single habit that most improves results.
What You Will Learn
- What a trading journal is for
- Exactly which fields to record, with a template you can copy
- How to measure trades in R and build an equity curve
- A weekly review routine that turns records into decisions
Before You Start
Read Win Rate, Expectancy and Profit Factor and Trading Discipline and Routines. The journal is where both are measured.
What a Journal Is For
A trading journal is a record of every trade: what you planned, what happened, and how you behaved. It does three jobs. It measures your edge (are your setups profitable?), it measures your execution (did you follow your rules?), and it reveals patterns you can't see trade by trade, such as losses clustering on expiry days or after two losses in a row.
Your broker statement records only the second part, the result. Without the plan and the context, a list of profits and losses can't tell you why.
What to Record
Record the plan before you enter, so hindsight can't change it. Fill in the rest after you exit.
| Field | Example | Why it matters |
|---|---|---|
| Date and time | 12 Nov, 10:20 | Finds time-of-day and day-of-week patterns |
| Instrument | Nifty futures | Compares markets |
| Setup name | Pullback to support | Measures each setup separately |
| Direction | Long | Spots directional bias |
| Entry, stop, target (planned) | 24,500 / 24,440 / 24,620 | Defines 1R and the plan |
| Position size and rupee risk | 1 lot · ₹3,900 | Checks sizing rules |
| Exit price and reason | 24,580 · trailed stop | Shows how you exit |
| Result in R (after costs) | +1.2R | Comparable across all trades |
| MFE / MAE | +1.8R / −0.4R | Shows how far trades went for and against you |
| Rules followed? | Yes · 5/5 | Feeds the adherence score |
| Emotion notes | Calm; urge to exit early at +1R | Reveals psychological patterns |
| Screenshot | Link to chart at entry and exit | Lets you review the setup later |
Measuring in R
Record every result as an R multiple: profit or loss divided by the amount you planned to risk. A ₹3,000 profit on a trade risking ₹2,000 is +1.5R; a ₹2,000 loss on the same risk is −1R.
R makes trades of different sizes, markets and account values comparable, and it's what expectancy, profit factor and drawdown are calculated from. Include costs in the result; a journal that ignores them flatters every number.
Real Prices: A Journal Entry
The fields in this lesson are easier to see on a real trade. The chart below records a Titan breakout from July 2026 the way this lesson suggests: the plan written before entry, the R values fixed at entry, and the result and notes after exit.
Real prices: one trade, recorded as a journal entry, Titan, July–August 2026
Step 1 of 4
Before the trade
Titan breaks out of a base in early July 2026 and holds above it. On 20 July it is just below its 20-day high. Journal, planned before entry: setup "20-day breakout"; market filter on (NIFTY above a rising 50-day average); risk 1%.
- What to observe
- This lesson's rule: record the plan before you enter.
- Condition
- Hindsight cannot change what is written now.
Your Journal's Equity Curve
Add up the R results in order and you get an equity curve in R. Here is the hypothetical 20-trade journal from lesson 12.01.05, in the order the trades happened.
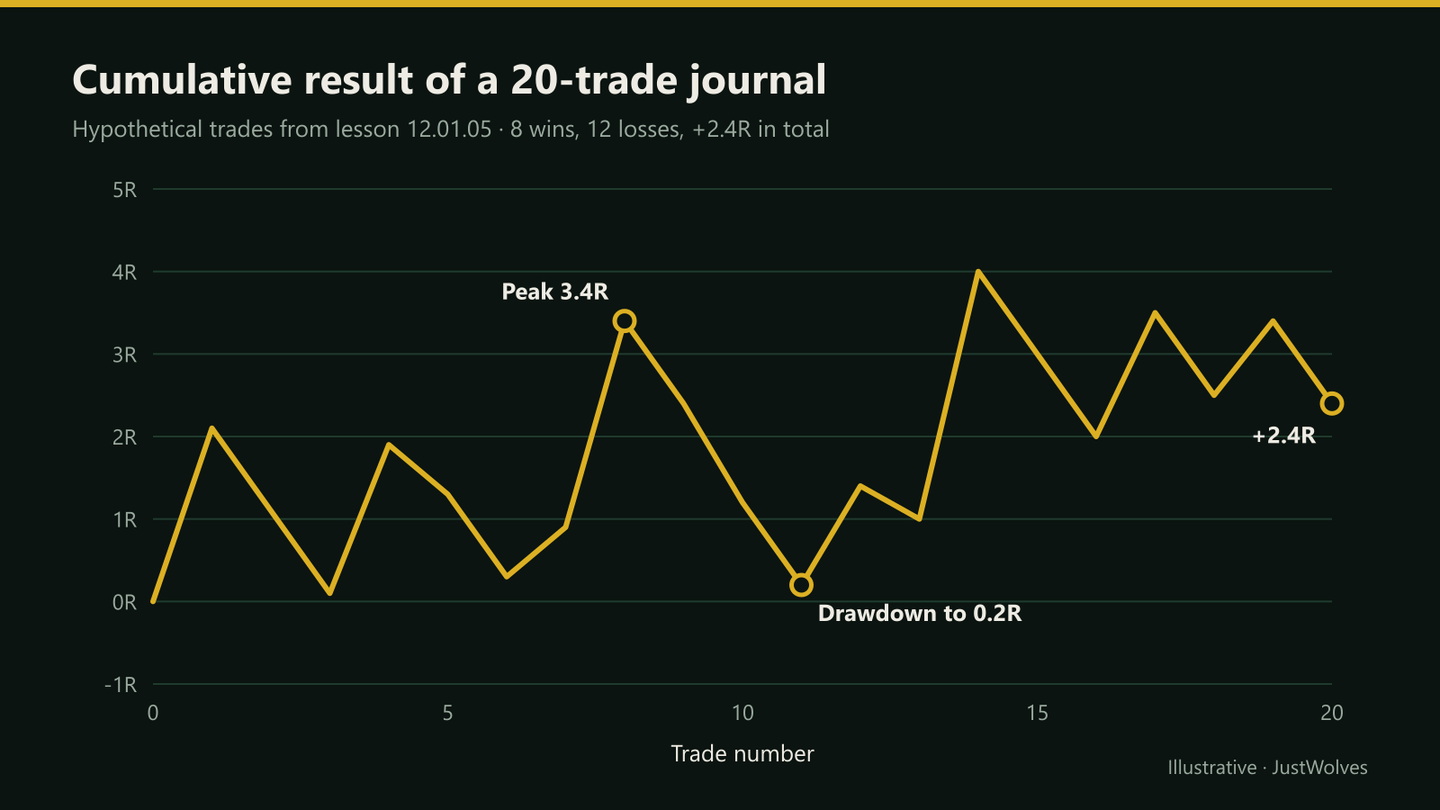
From these 20 trades the journal shows a longest losing streak of three trades and a maximum drawdown of 3.2R (from the 3.4R peak to 0.2R). Those two numbers are worth knowing before the next streak arrives.
The Weekly Review, Step by Step
Thirty minutes once a week
Step 1: Update the numbers
Trades, win rate, average win and loss, expectancy, total R, and your rule-adherence score.
Step 2: Split by setup
Which setups made money and which didn't? Keep at least 20–30 trades per setup in mind before judging.
Step 3: Split by rule-following
Compare trades that followed every rule with those that didn't.
Step 4: Look at your largest loss and largest win
Were both executed according to plan?
Step 5: Pick one change
One behaviour to improve next week, written at the top of next week's page.
Practical Example
Pooja has journaled 60 intraday trades. Overall she's at +1.8R, close to break-even after a lot of effort. Splitting by time of day, her trades before 11 am total +9.4R, while trades after 1 pm total −7.6R. Splitting by rules, almost all the afternoon losers were taken after a loss earlier in the day.
Her change: no new trades after 1 pm, and stop after two consecutive losses. She couldn't have seen either pattern from her broker statement.
Which Journal Splits Mean Something? Our Test
This lesson's review section suggests splitting results to find patterns, like Pooja's time-of-day finding. JustWolves tested how reliable such splits are on a real record: 419 breakout trades on 17 large NSE stocks from November 2024 to November 2026, after costs. We split the trades by breakout volume and by weekday, fields a journal would record, and, as a control, by a meaningless rule: odd-numbered and even-numbered trades.
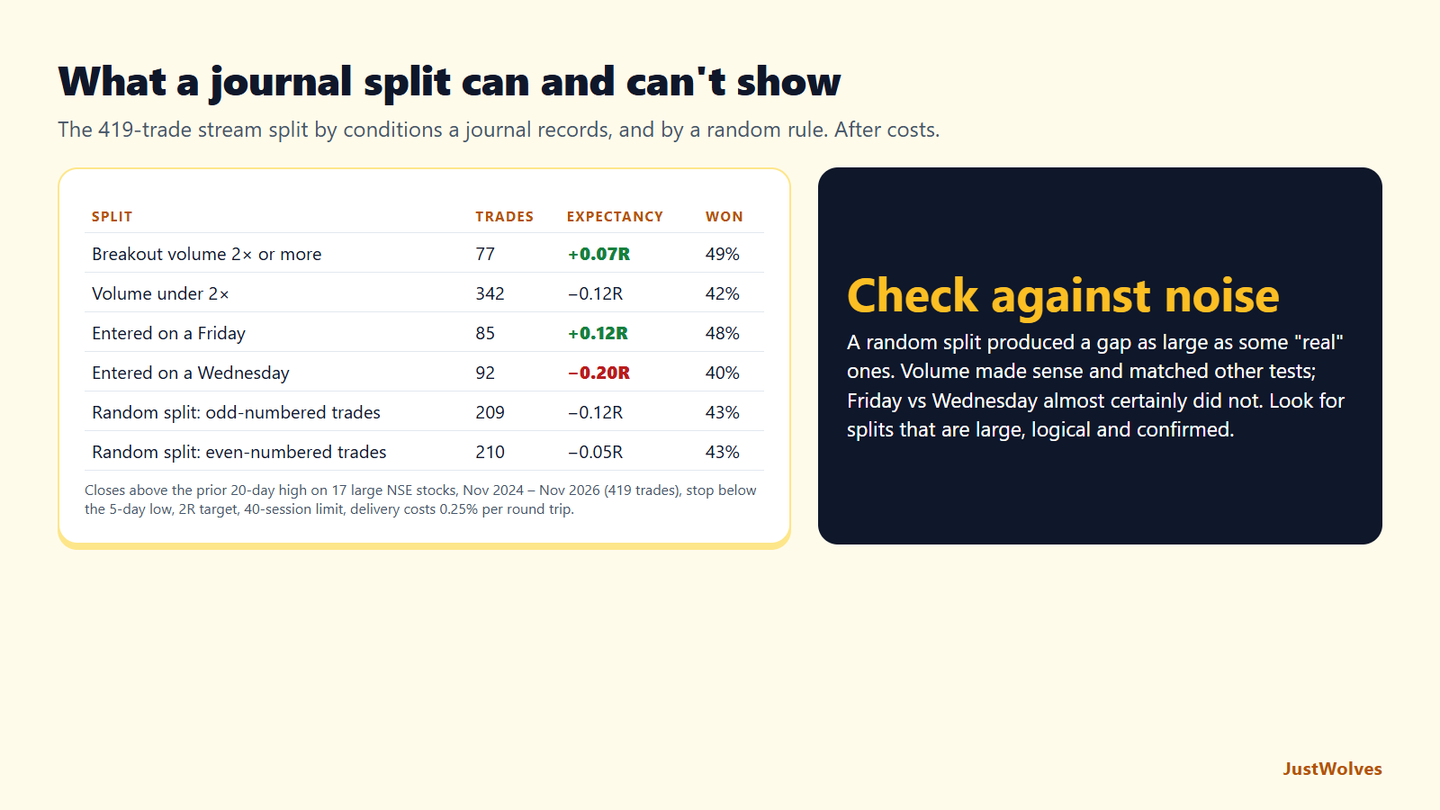
| Split | Trades | Expectancy | Won |
|---|---|---|---|
| Breakout volume 2× or more | 77 | +0.07R | 49% |
| Breakout volume under 2× | 342 | −0.12R | 42% |
| Entered on a Friday | 85 | +0.12R | 48% |
| Entered on a Wednesday | 92 | −0.20R | 40% |
| Random split: odd-numbered trades | 209 | −0.12R | 43% |
| Random split: even-numbered trades | 210 | −0.05R | 43% |
Some differences are just noise. Splitting the same trades into odd and even numbers, which cannot mean anything, produced a gap of 0.07R between the halves. Friday entries beat Wednesday entries by 0.32R, but there is no sensible reason for it, the samples are under 100 trades each, and our other tests found no weekday effect. A journal review that acted on it would be fitting noise.
Others are worth keeping. Breakouts on at least twice the usual volume did better than the rest, and that matches both logic and our separate volume test in the Breakout course. A split worth acting on is large, makes sense, and holds up on new trades.
The journal's real value is the record itself. This lesson's warning that small samples mislead applies to splits even more than to totals: each split has fewer trades than the whole. Record every trade, review monthly, and treat any pattern as a hypothesis to confirm on the next hundred trades, not a rule to adopt today.
Common Mistakes
- Journaling only winners, or skipping 'embarrassing' trades. Every trade goes in.
- Filling it in days later. Record the plan before entry and the rest the same day.
- Recording rupees only. Use R so results are comparable.
- Never reviewing it. A journal that isn't read is just data entry.
- Ignoring costs. Record results after brokerage, taxes and slippage.
Professional Insight
Professional traders treat their journal like a business ledger. The most useful field is often the simplest: whether the trade was part of the plan. Separating planned from unplanned trades usually explains more of a trader's results than any refinement to entries.
Risk Considerations
- Small samples mislead: a setup with 8 trades has no meaningful statistics yet (lesson 12.04.04).
- Survivorship in your own records: if you stop logging a strategy when it struggles, its history looks better than it was.
- Spreadsheets break: keep backups and check formulas against a hand calculation occasionally.
Important Terminology
| Term | Meaning |
|---|---|
| Trading journal | A record of every trade's plan, result and context. |
| R multiple | A trade's result divided by the amount planned to risk. |
| Equity curve | Cumulative results over time, in R or rupees. |
| MFE / MAE | Maximum favourable / adverse excursion during a trade. |
| Setup tag | A label for the strategy or pattern a trade used. |
| Weekly review | A regular session that turns journal data into decisions. |
What should I write in a trading journal?
At minimum: setup, entry, stop, exit, result in R and whether you followed your rules. Ideally also time, size, MFE/MAE, emotions and a chart screenshot.
Is a spreadsheet good enough for a trading journal?
Yes. A spreadsheet with the fields in this lesson is enough for most traders. Dedicated apps are convenient but not necessary.
How often should I review my trading journal?
Briefly after each session, and in more depth once a week.
Why measure trades in R instead of rupees?
R makes trades of different sizes and markets comparable, and it's the unit expectancy and drawdown are measured in.
Should I record paper trades too?
Yes, in a separate journal or clearly tagged, so you can compare paper results with live ones.
How many trades do I need before journal patterns mean something?
More than most traders think. On 419 real NSE breakout trades, a meaningless odd/even split produced a 0.07R gap, and weekday splits of about 80–90 trades each differed by up to 0.32R. Confirm any pattern on new trades before adopting it.
What is the most useful field in a trading journal?
Whether the trade followed the plan, alongside the result in R. Separating planned from unplanned trades, and comparing both with your backtest, usually explains more than any other split.
Practical Exercise
Set up your journal today and log your next ten trades, live or paper.
Your task
Step 1: Create the sheet
Use the template fields above, or the six-field minimum.
Step 2: Add three formula columns
Result in R, cumulative R, and a running peak so you can see drawdown.
Step 3: Log ten trades
Plan before entry; complete the rest the same day.
Step 4: Run your first review
Calculate win rate, expectancy and adherence, and write one change for the next ten trades.
Check Your Understanding
A trade risked ₹2,000 and made ₹3,000 after costs. What is the R multiple?
Related Lessons
Previous: Trading Discipline and Routines. Next: How to Backtest a Trading Strategy (12.04.02). See also Win Rate, Expectancy and Profit Factor.