
Maximum Drawdown in Trading: How to Measure It and Plan Your Recovery
JustWolves is an educational platform and is not a SEBI-registered investment advisor. Trading financial instruments involves significant risk of loss and may not be suitable for all investors. Past performance is not indicative of future results. Read our full disclaimer →
What you'll learn
- Maximum drawdown is the largest fall from a peak to a later low in your account value
- Measure it from your equity curve, in both percent and rupees, along with how long it lasted
- Deeper drawdowns need disproportionately larger gains to recover
- Expect drawdowns of the size your risk per trade implies, and decide your responses in advance
- Judge results by return relative to drawdown, not by return alone
In this article · 16 sections
Every trader's account goes through stretches where it is below its previous high. How deep those stretches get, and how long they last, decides whether you can keep trading your plan. Maximum drawdown is the measurement that captures it, and it's the number professionals look at first when judging any strategy, including their own.
What You Will Learn
- What drawdown and maximum drawdown mean, precisely
- How to calculate both from an equity curve, step by step
- Why drawdown duration matters as much as depth
- How to set drawdown rules and use return-to-drawdown ratios
Before You Start
Read Risk Management: Why It Comes First for the recovery arithmetic and Capital Preservation and Risk of Ruin for how risk per trade drives drawdown size.
Drawdown and Maximum Drawdown
Your equity curve is your account value over time, usually recorded after each trade, day or week. The highest value it has reached so far is the peak.
A drawdown is how far the account currently sits below its most recent peak, in percent: (peak − current value) ÷ peak. It is zero whenever the account makes a new high.
The maximum drawdown is the largest drawdown that occurred over a period: the deepest fall from any peak to a later low before a new peak was made. It answers the question: what was the worst stretch, measured from the top?
Step by Step: Calculate Maximum Drawdown
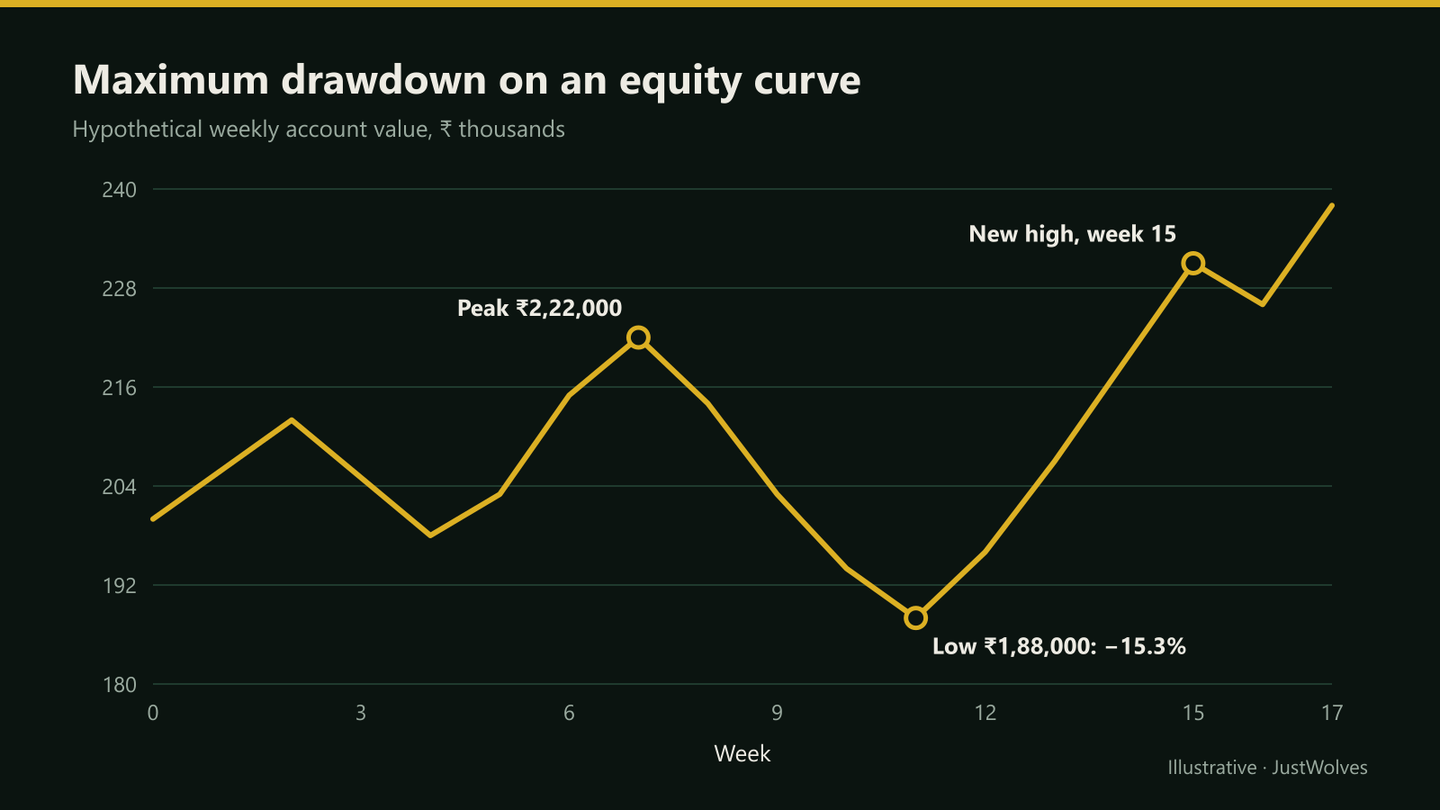
Here is a hypothetical account recorded at the end of each week for 18 weeks, in thousands of rupees: 200, 206, 212, 205, 198, 203, 215, 222, 214, 203, 194, 188, 196, 207, 219, 231, 226, 238.
Working through the equity curve
Step 1: Track the running peak
The peak rises to 212 in week 2, then 215 in week 6 and 222 in week 7.
Step 2: Find each drawdown
After the week 2 peak the account dips to 198 in week 4: (212 − 198) ÷ 212 = 6.6%. After the week 7 peak it falls to 188 in week 11.
Step 3: Pick the largest
(222 − 188) ÷ 222 = 15.3%. That's the maximum drawdown: ₹34,000 from ₹2,22,000.
Step 4: Measure the duration
The account first exceeds 222 again in week 15 (231). It spent 8 weeks below its peak.
Step 5: Put it next to the return
Over the 18 weeks the account rose from ₹2,00,000 to ₹2,38,000, a 19% gain, with a 15.3% maximum drawdown along the way.
Depth and Duration
Depth is how far you fall; duration is how long you stay below the peak. Both matter, and duration is the one traders underestimate. Eight weeks underwater is uncomfortable. Eight months is where many traders abandon a perfectly good strategy just before it recovers.
Recovery also takes longer than the decline, because of the arithmetic from lesson 12.01.01: from a 15.3% drawdown you need about an 18% gain to get back to the peak.
| Maximum drawdown | Gain needed to return to the peak |
|---|---|
| 10% | 11.1% |
| 15.3% (example above) | 18.1% |
| 20% | 25% |
| 30% | 42.9% |
| 50% | 100% |
Real Prices: Depth and Duration
The 18-week account in this lesson is hypothetical. The chart below shows depth and duration on a real large-cap stock: Tata Consultancy Services, which fell 55.7% from its December 2024 peak and was still 46% below it two years later.
Real prices: a 56% drawdown and two years underwater, Tata Consultancy Services, November 2024 – November 2026
Step 1 of 4
The peak
TCS closes at ₹4,473.9 on 13 December 2024, its highest close in our data.
- What to observe
- Every drawdown from here is measured against this peak.
- Condition
- Depth and duration both start counting now.
How Big Should You Expect Drawdowns to Be?
Your risk per trade largely sets the scale. In the simulation in lesson 12.01.02 (a strategy winning 45% of trades at 1:1.5), the typical worst drawdown over 500 trades was about 8% at 0.5% risk, 16% at 1% and 30% at 2%, and one account in ten saw considerably worse.
Real trading is usually rougher than a simulation: losing conditions cluster, costs add up and execution slips. A sensible rule of thumb is to expect a future maximum drawdown somewhat *larger* than the worst you have seen in your backtest or journal so far.
Return Relative to Drawdown
A return figure means little without the drawdown that came with it. Two simple ratios put them together:
- Recovery factor = net profit ÷ maximum drawdown in rupees. In the example, ₹38,000 ÷ ₹34,000 ≈ 1.1: the account earned only slightly more than its worst decline.
- Calmar-style ratio = annualised return ÷ maximum drawdown (%). Professionals use it to compare strategies over a year or more. Over a short period like 18 weeks it is only indicative.
A strategy returning 30% with a 10% maximum drawdown is generally far more usable than one returning 40% with a 45% drawdown, because few people can keep trading through the second.
Drawdown Rules: Decide Them in Advance
A simple drawdown plan
Step 1: Know your normal
From your journal or backtest, note your typical and worst drawdowns.
Step 2: Set a warning level
For example, at −10% from peak, halve your risk per trade until the account recovers half the drawdown.
Step 3: Set a review level
For example, at −15%, stop trading the strategy and review your journal: is this normal variance or has something changed?
Step 4: Set a hard stop
For example, at −20%, stop live trading entirely and go back to paper trading until you have a reason to believe the edge still exists.
Step 5: Write them down now
Rules made during a drawdown are made under stress. Make them while you are calm.
Practical Example
Rohit's backtest of a swing strategy shows a 12% maximum drawdown over two years. He risks 1% per trade and sets his rules: halve risk at −10%, review at −15%, stop at −20%.
Four months into live trading he reaches −11%. He halves risk to 0.5%, as planned. His journal shows his win rate and average win are in line with the backtest; the losses simply clustered. Over the next two months the account recovers to within 3% of its peak, and he returns to 1% risk. No rule was invented on the spot, and no panic decision was made.
How Deep and How Long Are Real Drawdowns? Our Data
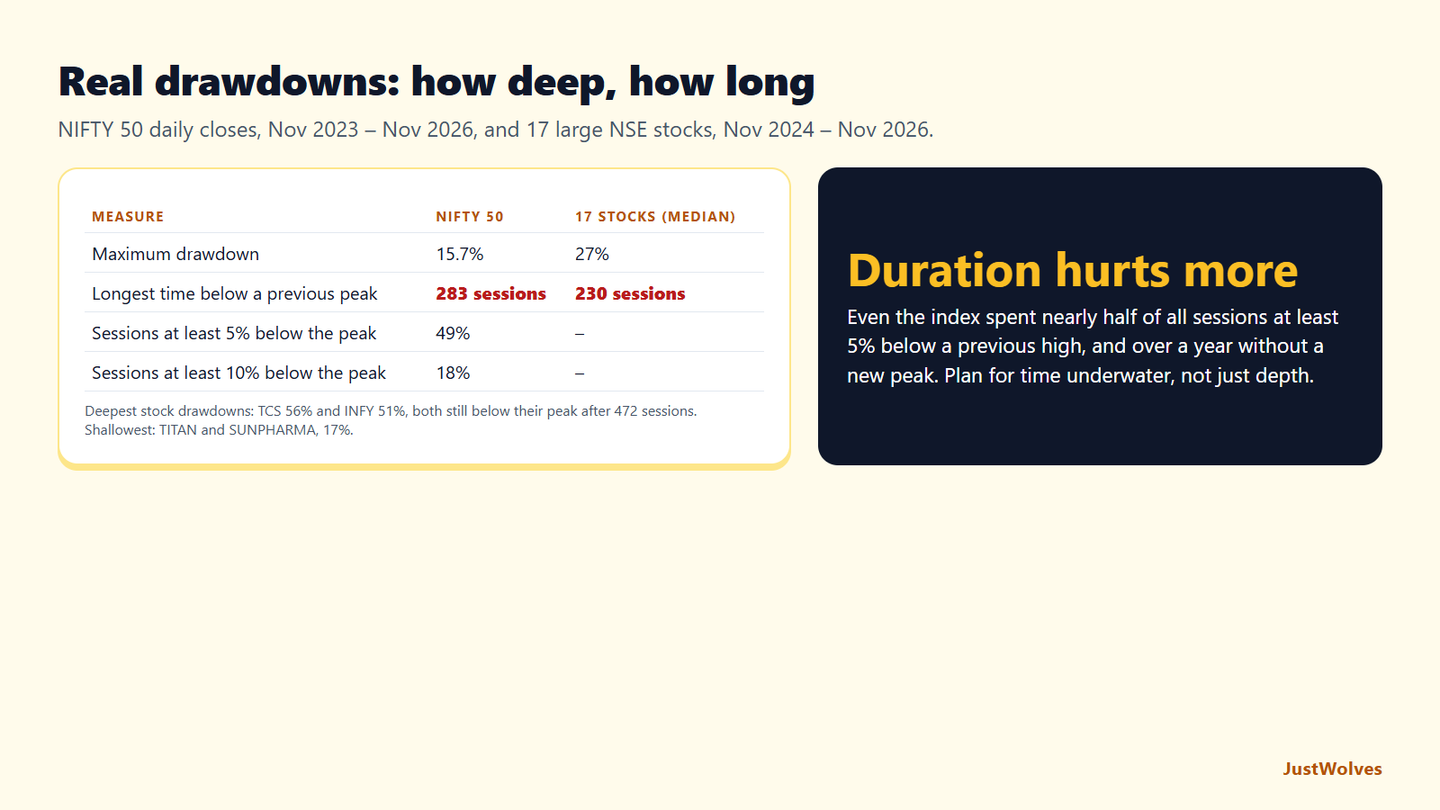
To give this lesson's expectations section real reference points, JustWolves measured drawdowns on daily closes for NIFTY 50 (November 2023 to November 2026) and for 17 large NSE stocks (November 2024 to November 2026). For each, we recorded the maximum drawdown, the longest run of sessions below a previous peak, and, for the index, how often it sat 5%, 10% or 15% below its peak.
| Market | Maximum drawdown | Longest time below a previous peak |
|---|---|---|
| NIFTY 50 (Nov 2023 – Nov 2026) | 15.7% | 283 sessions |
| 17 large stocks, median (Nov 2024 – Nov 2026) | 27% | 230 sessions |
| Deepest: TCS | 56% | 472 sessions, still below its peak |
| Deepest: Infosys | 51% | 472 sessions, still below its peak |
| Shallowest: Titan | 17% | 74 sessions |
Underwater is the normal state. NIFTY 50 spent almost half of all sessions at least 5% below a previous high, and its longest stretch without a new high was 283 sessions, more than a year. This is the duration point in this lesson: drawdowns are less a rare event than the normal condition between new highs.
Individual stocks went much deeper. The median large stock in our sample fell 27% from a peak at some point in two years, and two of India's largest technology companies fell more than half. A trader concentrated in one or two stocks should expect drawdowns far larger than the index suggests.
History understates the next drawdown. This lesson's warning that the worst drawdown is usually still ahead applies here too: none of these figures is a limit. NIFTY's 15.7% in three years is not the deepest drawdown the index has had. Set your drawdown rules, such as halving risk at −10%, around a decline bigger than the history you happen to have.
Common Mistakes
- Measuring from the starting balance. Drawdown is measured from the peak.
- Ignoring duration. A shallow drawdown that lasts a year can be harder to bear than a deep one that lasts a month.
- Assuming the backtest's worst is the worst. Plan for deeper.
- Increasing risk to recover faster. It deepens drawdowns more often than it ends them.
- Quoting returns without drawdown. Always state both.
Advanced Insight
Professional allocators often look at the *distribution* of drawdowns, not just the maximum: how often the account was 5%, 10% or 15% below its peak, and the longest time underwater. Recording your account value daily and calculating a running drawdown column in a spreadsheet is enough to see this. It also tells you whether your current drawdown is ordinary for your strategy or something new.
Risk Considerations
- Correlated positions can produce sudden drawdowns larger than your per-trade risk suggests (lesson 12.02.06).
- Leverage amplifies drawdowns in proportion; a gap can create a large drawdown in one session (lesson 12.02.05).
- Prop firm accounts often use trailing or daily maximum drawdown rules; read exactly how they are calculated before trading.
Important Terminology
| Term | Meaning |
|---|---|
| Equity curve | Your account value plotted over time. |
| Peak | The highest account value reached so far. |
| Drawdown | How far the account is below its most recent peak, in percent. |
| Maximum drawdown | The largest peak-to-low fall over a period. |
| Time underwater | How long the account stays below a previous peak. |
| Recovery factor | Net profit ÷ maximum drawdown, both in rupees. |
| Calmar ratio | Annualised return ÷ maximum drawdown; used to compare strategies over a year or more. |
What is maximum drawdown in trading?
The largest percentage fall in account value from a peak to a subsequent low, before a new peak is made. It measures the worst losing stretch you experienced.
How do I calculate maximum drawdown?
Track your account value and its running peak. At each point, calculate (peak − value) ÷ peak. The largest of these figures is the maximum drawdown.
What is an acceptable maximum drawdown?
It depends on your goals and tolerance, but many active traders aim to keep it within 15–25%. If you trade a prop firm account, its rules set the limit, often much lower.
Is a drawdown the same as a loss?
Not exactly. You can be in a drawdown while still in profit overall, because drawdown is measured from your highest point, not from your starting balance.
How long does recovering from a drawdown take?
It depends on your expectancy and trade frequency, but recovery takes a larger percentage gain than the decline, so it usually takes longer than the drawdown itself.
What is a normal drawdown for NIFTY 50?
Between November 2023 and November 2026, NIFTY 50's maximum drawdown on daily closes was 15.7%, and it spent 49% of sessions at least 5% below a previous peak. Its longest run without a new high was 283 sessions.
How long can a stock stay in drawdown?
A long time. In our data, TCS and Infosys were still below their late-2024 peaks after 472 sessions, with drawdowns of 56% and 51%. The median large NSE stock spent up to 230 sessions below a previous peak.
Practical Exercise
Use your own account history, or this sequence of monthly values in ₹ thousands: 300, 318, 309, 296, 287, 301, 322, 315, 334.
Your task
Step 1: Track the running peak
Write the highest value reached so far next to each month.
Step 2: Calculate each drawdown
(peak − value) ÷ peak for every month.
Step 3: Find the maximum and its duration
Which drawdown is deepest, and how many months until a new peak?
Step 4: Price the recovery
What gain was needed to return to the peak from the low?
Check Your Understanding
An account rises to ₹5,00,000 and then falls to ₹4,25,000. What is the drawdown?
Related Lessons
Previous: Trailing Stops and Taking Profit. Next: Daily and Weekly Loss Limits (12.02.04). See also Capital Preservation and Risk of Ruin.