
Daily and Weekly Loss Limits: The Circuit Breakers Every Trader Needs
JustWolves is an educational platform and is not a SEBI-registered investment advisor. Trading financial instruments involves significant risk of loss and may not be suitable for all investors. Past performance is not indicative of future results. Read our full disclaimer →
What you'll learn
- A loss limit stops trading for the day or week once losses reach a preset amount
- Set limits in units of risk (R), for example 3R a day and 6R a week
- Their main job is behavioural: they stop tilt and revenge trading before it starts
- Expect to hit a daily limit on some days; that's the rule working, not failing
- Prop firm limits are often calculated differently; read the exact rule
In this article · 16 sections
The worst trading days rarely come from one big loss. They come from a loss, then a rushed trade to win it back, then another, each one taken with less care than the last. A daily loss limit is a rule that ends the day before that spiral begins. It's the simplest risk control there is, and one of the most effective.
What You Will Learn
- What daily and weekly loss limits are and why they work
- How to set them in units of risk, matched to your risk per trade
- How often a sensible limit will actually be hit
- What to do on the days you hit it, and how prop firm rules differ
Before You Start
Read Position Sizing and the 1% Rule and Maximum Drawdown first. You should know your risk per trade and think about losses in units of R.
What a Loss Limit Is
A daily loss limit is the maximum you allow yourself to lose in one trading day. When realised losses (and, for open positions, the loss if their stops are hit) reach it, you close everything and stop trading until the next session. A weekly loss limit does the same over a week.
They are circuit breakers. Like the ones in an electrical system, their purpose isn't to prevent ordinary use. It's to cut the power before a fault does serious damage.
Why Loss Limits Work
On paper, if every trade were independent and taken with equal care, stopping after three losses wouldn't change your expected result per trade. The next trade would have the same edge as the first.
Real traders don't work like that. After a run of losses, judgment deteriorates: setups get forced, size creeps up, stops get moved. Trading psychology calls this tilt, and revenge trading is its most common form (lesson 12.03.03). A loss limit doesn't improve your edge; it protects it, by stopping you from trading at exactly the moment your decisions are worst. It also caps your worst days, which keeps drawdowns shallower.
Setting Your Limits in R
Express limits in units of risk, so they scale with your position sizing. Common starting points:
| Risk per trade | Daily limit (3R) | Weekly limit (6R) | On a ₹3,00,000 account |
|---|---|---|---|
| 0.5% | 1.5% | 3% | ₹4,500 a day · ₹9,000 a week |
| 1% | 3% | 6% | ₹9,000 a day · ₹18,000 a week |
Some traders also add a trade-count limit, such as no more than three losing trades in a row, or a maximum number of trades per day. It catches overtrading even when each loss is small.
How Often Will You Hit It?
It depends on how many trades you take. For a strategy winning 45% of trades at 1:1.5, here is the chance that a day's results fall to −3R at some point, by trades per day:
| Trades per day | Chance of hitting −3R |
|---|---|
| 3 | 16.6% |
| 4 | 16.6% |
| 6 | 23.4% |
| 10 | 30.2% |
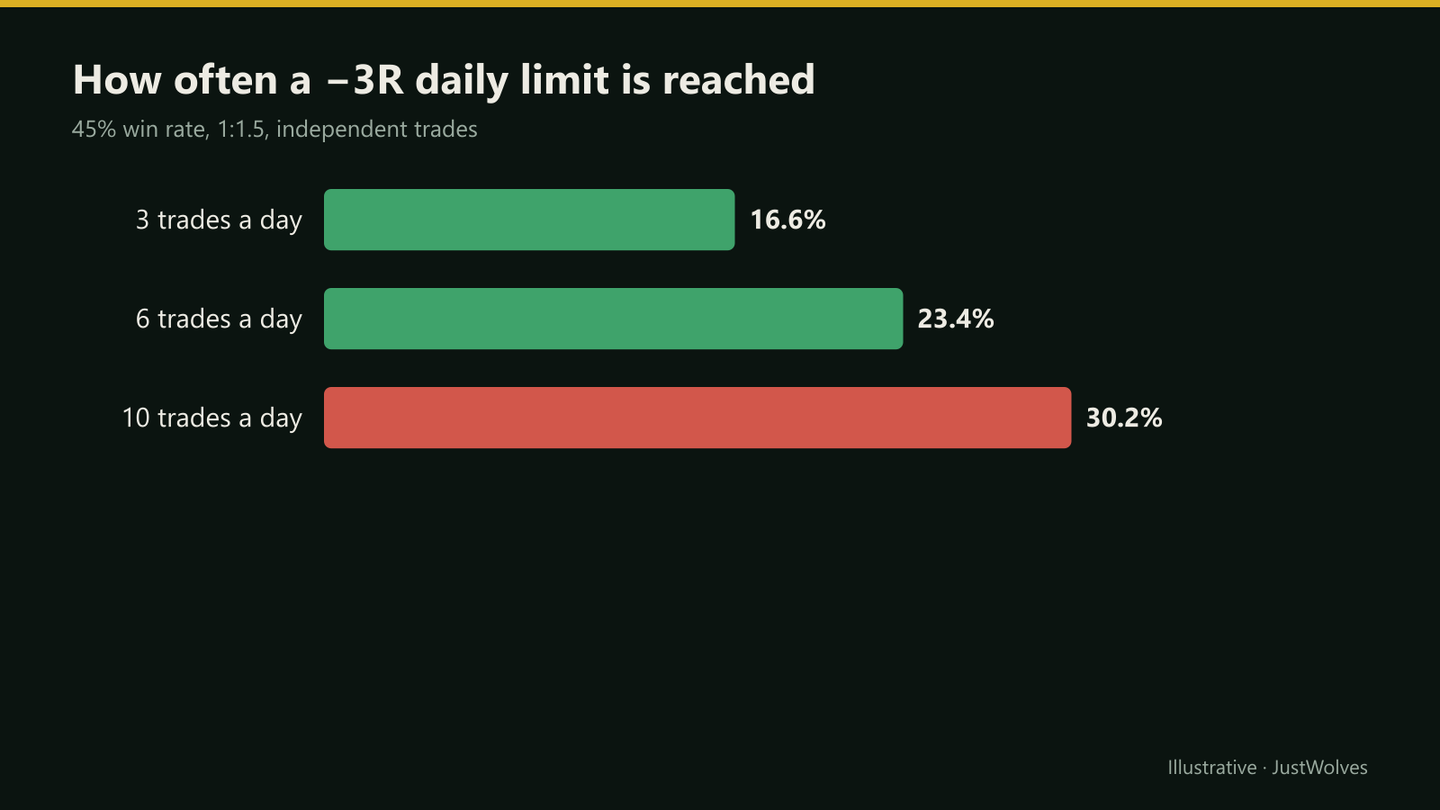
At six trades a day, roughly one day in four (about 4–5 days in a 20-day month) would reach the limit, with a perfectly good strategy. Hitting your limit is normal. If it happens much more often than this, that's useful information: either the strategy's edge has weakened or the trades on those days weren't the setups you planned.
Real Prices: A Limit That Cost Money
Sneha's day in this lesson shows a limit saving money. The chart below shows the other side, on real NIFTY 50 prices from 2 November 2026: a limit reached by midday, and an afternoon that would have recovered the loss. Both kinds of day happen; the rule is judged over many of them.
Real prices: a daily loss limit hit by midday, and the afternoon it missed, NIFTY 50, 2 November 2026
Step 1 of 4
A rough start
A scalper on 2 November 2026 follows a simple 5-minute rule with 20-point targets and stops, and a daily loss limit of 3R: 60 points. The first two longs, at 10:40 and 10:50, are both stopped out by 10:59: −40 points.
- What to observe
- Two losses in twenty minutes.
- Condition
- One more loss of the same size reaches the limit.
What to Do When You Hit the Limit
The limit-hit routine
Step 1: Close and step away
Exit any open positions, cancel pending orders and close the trading platform. Don't watch the market 'just to see'.
Step 2: Log the day
Record each trade, whether it followed your plan, and your state of mind. Do it while it's fresh.
Step 3: Separate variance from error
Were these valid setups that simply lost, or did rule-breaking start after the first loss?
Step 4: Plan the next session
Normally, return at your usual size. If rule-breaking was involved, consider a reduced size or fewer trades the next day.
Step 5: Respect the weekly limit too
If the week's total reaches its limit, stop until the following week, even if you feel fine.
Practical Example
Sneha scalps Nifty options with a ₹2,00,000 account, risking 0.5% (₹1,000) a trade, with a 3R (₹3,000) daily limit. On Tuesday her first two trades are stopped out: −₹2,000. The third looks marginal, but she takes it and loses: −₹3,000. Limit reached.
She closes the platform, logs the day, and notes that the third trade didn't meet her rules. On Wednesday she trades normally and finishes +₹2,500. Without the limit, Tuesday's next hour would have been the kind that turns a ₹3,000 loss into a ₹15,000 one.
Prop Firm Loss Rules
Funded-account (prop firm) programs usually impose their own daily and overall loss limits, often a few percent of the account, and breaching them ends the account.
Read the exact definitions. Some calculate the daily limit from the previous day's closing balance, some from the day's highest equity, and some include open (unrealised) losses. Set your personal limit comfortably inside the firm's, so that one bad trade can't breach it.
How Often Do Real Sessions Hit the Limit? Our Test
This lesson estimates how often a good strategy reaches a −3R day. JustWolves measured it on a real intraday stream: a simple 5-minute momentum scalp on 10 liquid NSE stocks, about 58 sessions each from August to November 2026, 600 stock-sessions with an average of 5.6 trades each, after costs of 0.06% per round trip. Unlike the lesson's example, this method lost money after costs, about −0.4R per trade, which is what makes limits most important.

| Daily limit | Sessions that reached it |
|---|---|
| −2R | 60% |
| −3R | 47% |
| −4R | 35% |
More trades, more limit days. The share of sessions reaching −3R rose steadily with the number of trades: from about a quarter of sessions with three trades to two-thirds with eight or more. That matches the frequency table in this lesson, which shows the same pattern for a profitable strategy, only less extreme.
A limit hit this often is a message. This lesson says that hitting the limit far more often than expected is useful information. Here, the −3R limit was reached on almost half of all sessions, because the method had no edge after costs. The limit kept those days small, as the Scalping Risk Management lesson's test showed, cutting the worst day from −13.5R to −4.8R, but the frequency itself said the method needed to change.
Limits cost money on some days. The 2 November chart shows a session where the limit stopped a trader before a profitable afternoon. That is the price of the insurance; over many sessions, the evidence from our scalping tests is that limits reduced the damage of bad days more than they cost on recoveries.
Common Mistakes
- Setting the limit in rupees and never updating it. Use R, so it scales with your risk.
- One more trade after the limit. The rule only works if it's absolute.
- Ignoring open risk. Count the loss if open positions' stops are hit, not just closed trades.
- No weekly limit. Several near-limit days in a row can add up to a deep drawdown.
- Treating a limit day as failure. It's the rule doing its job.
Advanced Insight
Some traders also use a profit lock: after a strong day, for example +4R, they stop or reduce size, because their journal shows that late trades on big days are often careless. Whether that helps is personal; check your own data. The same journal can show whether your losses cluster at particular times, such as after 2 pm or on expiry days, which may suggest a time-based rule instead.
Risk Considerations
- Gaps and slippage can push a single loss beyond 1R, so a day can exceed its limit on the last trade; keep risk per trade small enough that this stays tolerable.
- Overnight positions carry gap risk outside the daily session.
- Several accounts or strategies: apply limits to your total, not each one separately.
Important Terminology
| Term | Meaning |
|---|---|
| Daily loss limit | The maximum loss allowed in one trading day before you stop. |
| Weekly loss limit | The maximum loss allowed in one week before you stop until the next. |
| Tilt | A state of frustrated, emotional decision-making after losses. |
| Revenge trading | Taking impulsive trades to recover losses quickly. |
| Open risk | The loss you would take if every open position's stop were hit now. |
| Profit lock | An optional rule to stop or reduce size after a strong day. |
What is a daily loss limit in trading?
A preset maximum loss for one trading day. Once your losses reach it, you close all positions and stop trading until the next session.
What should my daily loss limit be?
Many traders use about 2–3 times their risk per trade, for example 3% a day if they risk 1% per trade, or 1.5% if they risk 0.5%.
Do loss limits reduce profits?
They can occasionally stop you before a winning trade, but their main effect is preventing the emotional, poor-quality trading that usually follows a string of losses.
Should swing traders use a daily loss limit?
Swing traders take fewer trades, so a weekly or monthly limit, together with drawdown rules, is usually more useful than a daily one.
How do prop firm daily loss limits work?
Each firm defines its own, and the calculation differs: from the previous close, from the day's peak equity, or including open losses. Read the rules exactly and keep your own limit inside theirs.
How often should I expect to hit a daily loss limit?
It depends on your edge and trade count. On a real stream of NSE stock scalps with no edge after costs, a −3R limit was reached on 47% of sessions; with eight or more trades a session, on 68%. A profitable strategy hits it much less often.
Does a daily loss limit ever cost money?
Yes, on days that would have recovered. On 2 November 2026, a NIFTY scalping rule hit a 60-point limit by midday and then missed an afternoon that would have ended the day positive. Over many days, limits mainly cut the worst sessions.
Practical Exercise
Write your personal loss limits and the routine you'll follow when you hit one.
Your task
Step 1: Convert to rupees
Using your account size and risk per trade, calculate 1R, a 3R daily limit and a 6R weekly limit.
Step 2: Add a trade-count rule
Decide a maximum number of trades per day, or of consecutive losses.
Step 3: Write the routine
List exactly what you'll do when the limit is reached.
Step 4: Check your history
If you have a journal, how many past days would have hit the limit? Were the trades after that point better or worse than your average?
Check Your Understanding
You risk 1% per trade on ₹4,00,000. What is a 3R daily limit?
Related Lessons
Previous: Maximum Drawdown. Next: Leverage and Margin Risk (12.02.05). Coming up: FOMO, Revenge Trading and Overtrading (12.03.03).