
Portfolio Exposure and Correlation Risk: When Several Trades Are Really One
JustWolves is an educational platform and is not a SEBI-registered investment advisor. Trading financial instruments involves significant risk of loss and may not be suitable for all investors. Past performance is not indicative of future results. Read our full disclaimer →
What you'll learn
- Portfolio heat is the total you would lose if every open stop were hit at once
- Correlated positions tend to win and lose together, so they act like one larger position
- Five 1% trades in highly correlated markets carry close to 5% of combined risk
- Cap total heat and cap exposure to any one sector, theme or currency
- Correlations rise in market stress, exactly when diversification is needed most
In this article · 15 sections
Risking 1% per trade feels safe until you notice you have five open trades in bank stocks, all long, all ahead of the same policy announcement. Each trade obeys your rules. Together they are one large bet on one outcome. This lesson is about seeing your risk the way the market will treat it: as a portfolio.
What You Will Learn
- What portfolio heat is and how to calculate it
- What correlation means for a trader, without the statistics jargon
- How correlation turns several small risks into one large one
- Practical caps on total, sector and currency exposure
Before You Start
Read Position Sizing and the 1% Rule and Leverage and Margin Risk first. The Forex course lesson on currency correlation (01.04.01) covers how currency pairs relate to each other in more detail.
Portfolio Heat: Your Total Open Risk
Portfolio heat is the total amount you would lose if the stop on every open position were hit at the same time. If you have four trades open, each risking 1%, your heat is 4%.
Heat is a simple, conservative number. It ignores the possibility that some trades win while others lose, so it describes your worst case if your stops hold. Tracking it stops your risk from quietly growing as you add positions one at a time.
What Correlation Means
Correlation describes how closely two markets move together, on a scale from −1 to +1. At +1 they move in perfect lockstep; at 0 there is no consistent relationship; at −1 they move in opposite directions.
Stocks in the same sector usually have high positive correlation, because the same news, interest-rate changes and fund flows affect them all. Bank Nifty futures and the large private banks are an obvious example. Currency pairs that share a currency are another: long EUR/USD and long GBP/USD are both, largely, a bet against the US dollar.
How Correlation Adds Up
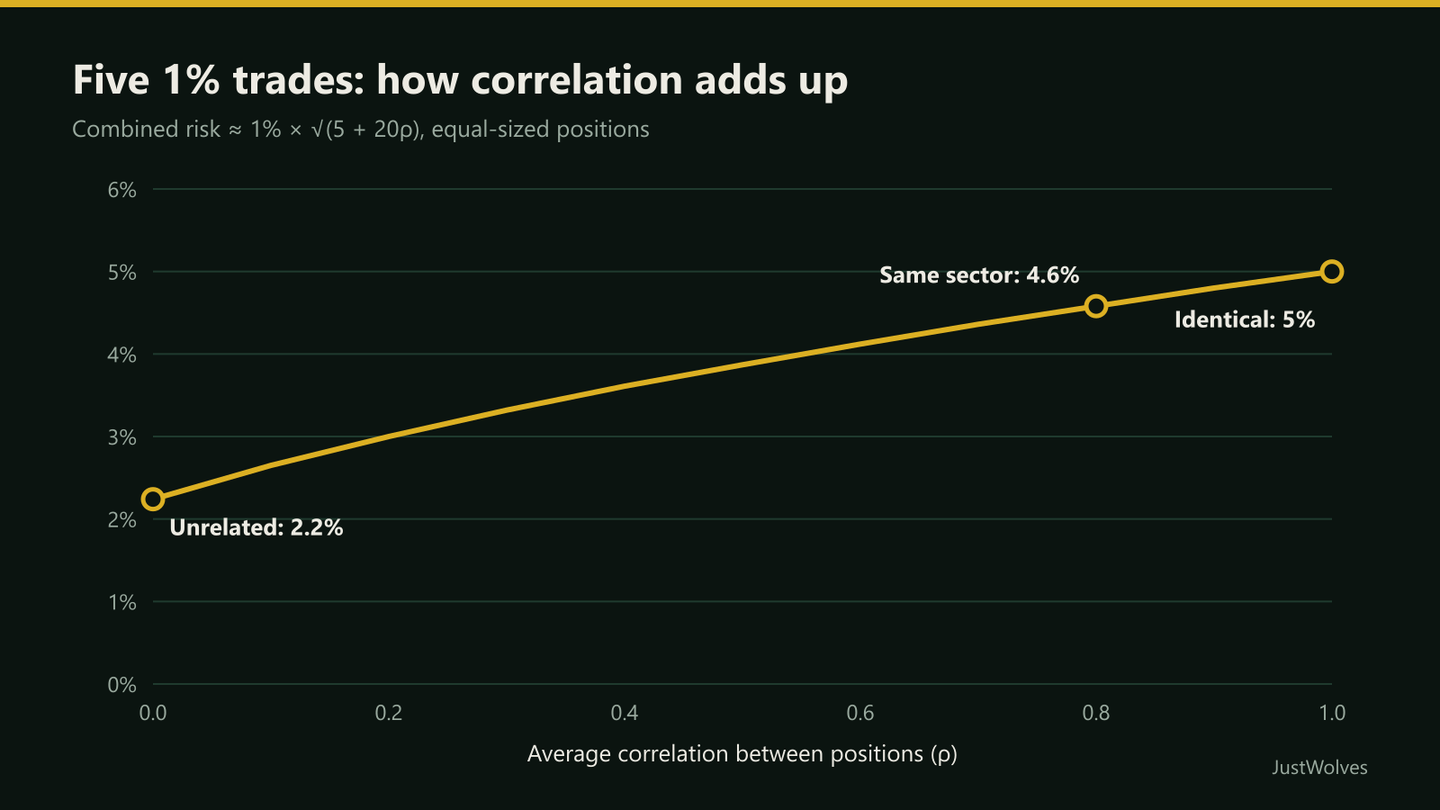
Imagine five equal positions, each risking 1%. If they were completely unrelated, they would rarely all lose at once; good and bad outcomes would partly cancel out. If they were perfectly correlated, they would behave exactly like one 5% position.
A standard portfolio formula gives the combined risk of n equal positions, each risking r, with an average pairwise correlation ρ: r × √(n + n(n − 1)ρ). It assumes equally sized, equally volatile positions, so treat it as a guide to scale rather than a precise measurement.
| Average correlation | Behaves like a single position of about | Example |
|---|---|---|
| 0 (unrelated) | 2.2% | Unrelated sectors and assets |
| 0.25 | 3.2% | Different sectors in the same market |
| 0.5 | 3.9% | Related sectors, or one market with strong macro drivers |
| 0.8 | 4.6% | Five stocks in one sector |
| 1 (identical) | 5.0% | Five positions on the same index |
Real Prices: Ten Trades, One Day
Arjun's bank positions in this lesson are hypothetical. The chart below shows what correlated exposure did on a real day: 7 April 2025, when NIFTY 50 opened about 5% lower and ten separate breakout trades in different NSE stocks were stopped out together.
Real prices: the day ten separate trades became one, NIFTY 50, March–April 2025
Step 1 of 4
A strong rally
In the second half of March 2025 NIFTY 50 rallies from about 22,350 to 23,870. Breakouts appear in stock after stock, and a trader taking each signal at 1% risk builds up many long positions in different names.
- What to observe
- Each trade is within the 1% rule.
- Condition
- All of them depend on the same thing: the market staying firm.
Spotting Hidden Concentration
Correlated exposure often hides in positions that look different. Common examples:
- One sector, several tickers: long HDFC Bank, ICICI Bank and Axis Bank, plus Bank Nifty futures.
- Index and its heavyweights: long Nifty futures and long Reliance, HDFC Bank and Infosys.
- Same currency, different pairs: long EUR/USD, long GBP/USD and short USD/CHF are all mainly short the US dollar.
- Same event: several positions that all depend on one result, policy decision or expiry.
- Options on the same underlying: a short strangle and a bull put spread on Nifty share most of their risk.
Exposure Rules, Step by Step
Keeping concentration in check
Step 1: Group your positions by theme
Sector, index, currency or event. Ask: what single piece of news would hurt several of these at once?
Step 2: Cap risk per theme
For example, no more than 2% total risk on any one sector or currency, regardless of how many positions that is.
Step 3: Cap total heat
For example, 5–6% across everything for swing trading.
Step 4: Count same-direction index trades as one
Nifty and Bank Nifty longs, or two option strategies on Nifty, share one set of risks.
Step 5: Re-check before every new trade
Add the new position's risk to its group and to total heat before entering. If either cap is breached, skip it or reduce another position.
Practical Example
Arjun swing-trades a ₹10,00,000 account at 1% risk (₹10,000) per trade. He holds long positions in HDFC Bank, ICICI Bank, Kotak Bank and SBI, and is about to add Axis Bank. Each trade individually is within his rules. His heat is 4%, rising to 5%, all in one sector ahead of an RBI policy announcement.
Applying a 2% sector cap, he can hold only two bank positions at full size, or four at half size. He keeps two at full size, closes one, halves another, and skips Axis Bank. His banking exposure falls from 5% to 2.5% (slightly over the cap, which he notes and trims the next day), and his heat falls with it. If the announcement disappoints and banks gap down together, the damage is about half what it would have been.
How Correlated Were Real Trades? Our Data
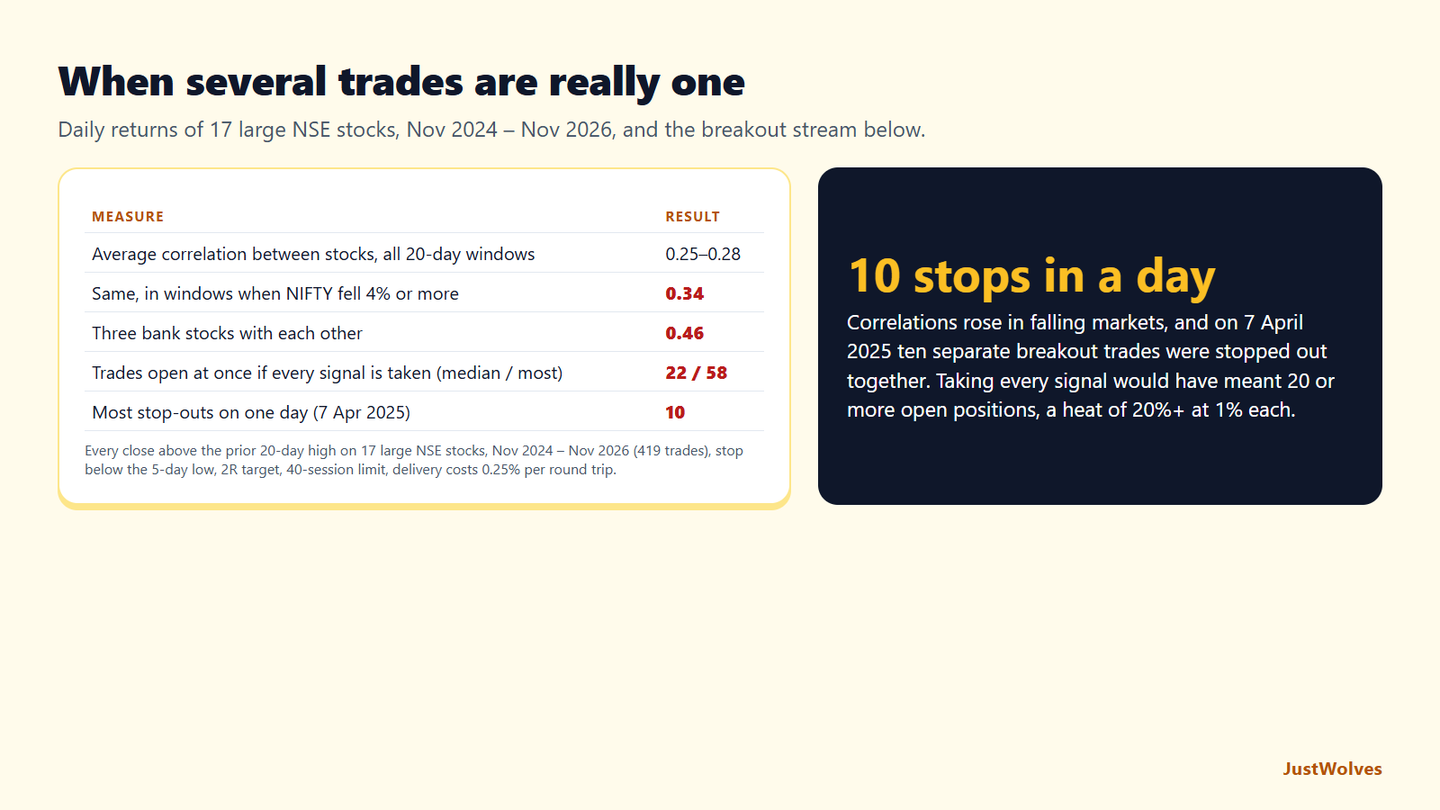
JustWolves measured this lesson's ideas on daily returns of 17 large NSE stocks from November 2024 to November 2026. We calculated the average correlation between every pair of stocks in 20-day windows, separately for windows when NIFTY 50 fell 4% or more and for the rest, and for three bank stocks on their own. We also replayed a simple breakout strategy that took every close above the prior 20-day high at 1% risk, and counted how many trades were open at once and how many were stopped out on the same day.
| Measure | Result |
|---|---|
| Average correlation between the 17 stocks (whole period) | 0.28 |
| In 20-day windows when NIFTY fell 4% or more | 0.34 |
| In other windows | 0.25 |
| Three bank stocks with each other | 0.46 |
| Breakout trades open at once if every signal is taken: median / most | 22 / 58 |
| Days with 3 or more stop-outs / 5 or more | 22 / 4 |
| Most stop-outs on one day | 10, on 7 April 2025 |
Correlation rose when it mattered. Across all stocks, the average correlation of daily returns was about 0.25 in normal periods and 0.34 in periods when NIFTY fell 4% or more, though only four such windows occurred. This lesson's warning that diversification fails in a sell-off shows up even in two years of data.
Sectors were the strongest link. Three bank stocks had an average correlation of 0.46 with each other, well above the market average. Holding all three is closer to one large banking position than three separate trades, as in this lesson's example.
Taking every signal created huge heat. A trader who took every breakout at 1% risk would typically have had 22 positions open, and at one point 58: a portfolio heat of 22% to 58%, far beyond the 5–6% cap this lesson suggests. On 22 days, three or more trades were stopped out at once; on 7 April 2025, ten were.
The practical rule follows: cap total open risk, count positions that share a factor as one, and assume correlations will rise in exactly the conditions where your stops get hit.
Common Mistakes
- Checking risk trade by trade only. Each trade can obey the 1% rule while the portfolio breaks every limit.
- Assuming different tickers means diversification. Same sector or same currency is close to the same trade.
- Trusting calm-market correlations. They rise in a crash.
- Hedging with a correlated position and calling it neutral. Check what actually offsets what.
- Ignoring event clustering. Several trades that all depend on one announcement are one trade.
Advanced Insight
Professional desks measure exposure by *factor*, the common driver behind positions: market direction, sector, interest rates, the dollar. A simple version you can use: for each open position, write the one factor that would hurt it most. If the same factor appears three or more times, you have a concentrated bet on that factor, whatever the tickers say.
Risk Considerations
- Gaps hit correlated positions together, so concentrated portfolios gap as a block.
- Leverage multiplies concentration: several leveraged positions on related markets can create a very large effective exposure (lesson 12.02.05).
- The formula is a simplification: real positions differ in size and volatility, and correlations change.
Important Terminology
| Term | Meaning |
|---|---|
| Portfolio heat | Total loss if every open position's stop were hit: the sum of open risk. |
| Correlation (ρ) | How closely two markets move together, from −1 to +1. |
| Concentration | Having a large share of risk in one sector, theme, currency or event. |
| Diversification | Spreading risk across positions that don't all move together. |
| Factor | A common driver of several positions, such as the market, a sector or the US dollar. |
| Sector cap | A limit on total risk in one sector or theme. |
What is correlation risk in trading?
The risk that several positions move against you at the same time because they are driven by the same factor, so losses add up instead of offsetting.
What is portfolio heat?
The total amount you would lose if the stop on every open trade were hit, usually expressed as a percentage of your account.
How much total risk should I have open?
Many swing traders cap total heat around 5–6% and risk in any one sector or currency around 2%. Lower caps suit smaller accounts and beginners.
Are Nifty and Bank Nifty positions correlated?
Yes, strongly, because banks are a large part of the Nifty. Long positions in both are largely one bet on the Indian market's direction.
Does trading several currency pairs diversify risk?
Only if they don't share a currency. EUR/USD, GBP/USD and AUD/USD longs are all mainly short the US dollar.
Do stock correlations rise in a market fall?
In our NSE data, yes. The average correlation of daily returns between 17 large stocks was about 0.25 in normal 20-day periods and 0.34 when NIFTY 50 fell 4% or more over the period.
How many trades can be stopped out on the same day?
Many more than most traders plan for. In a simple breakout strategy on 17 NSE stocks, ten separate trades were stopped out on 7 April 2025, when NIFTY opened about 5% lower.
Practical Exercise
List your current or most recent set of open positions, or use this example: long Nifty futures (risk 1%), long HDFC Bank (1%), long ICICI Bank (1%), long Infosys (1%), short a Nifty call spread (1%).
Your task
Step 1: Calculate heat
Add up the risk on every position.
Step 2: Group by factor
Which positions mainly depend on the Indian market rising? Which on banks?
Step 3: Apply caps
With a 6% heat cap and a 2% cap per theme, what would you change?
Step 4: Name the scenario
Describe the single event that would hurt the most positions at once.
Check Your Understanding
You have four open trades risking 1%, 1%, 0.5% and 1.5%. What is your portfolio heat?
Related Lessons
Previous: Leverage and Margin Risk. This completes the Controlling Losses module. Next module: Trading Psychology, starting with Trading Psychology: The 5 Mental Traps.