
Demo Trading, Paper Trading and Forward Testing: From Backtest to Live
JustWolves is an educational platform and is not a SEBI-registered investment advisor. Trading financial instruments involves significant risk of loss and may not be suitable for all investors. Past performance is not indicative of future results. Read our full disclaimer →
What you'll learn
- Paper trading and demo accounts let you practise execution without risking money
- Forward testing checks a backtested strategy in real time, on data that didn't exist when it was designed
- Paper results flatter you: no emotions, often unrealistic fills
- Treat paper trades exactly like live ones: same size, same rules, same journal
- Move to live trading in stages, starting small, with clear criteria for each step
In this article · 15 sections
A backtest tells you how rules behaved on old charts. It doesn't tell you whether you can spot the setup as it forms, place orders quickly enough, and follow the plan when the next candle is unknown. That's what demo trading and forward testing are for: the bridge between a promising backtest and real money.
What You Will Learn
- The difference between demo trading, paper trading and forward testing
- What each one tests and what it can't
- How to run a forward test properly
- A staged plan for moving from paper to live trading
Before You Start
Read How to Backtest a Trading Strategy first. Forward testing is the step after a backtest.
Three Related Ideas
- Paper trading: recording trades you *would* take, at real prices, without placing orders. It can be as simple as a spreadsheet.
- Demo trading: using a broker's or platform's simulated account with virtual money. Orders are placed in a realistic interface but nothing is real.
- Forward testing: applying a fixed, already-backtested strategy to live market data as it happens, recording every trade, to see whether the edge holds on data that didn't exist when the rules were written.
Forward testing can be done on paper, on a demo account, or with very small real positions. What makes it a forward test is that the rules are frozen before it starts.
What Paper and Demo Trading Test Well
- Setup recognition in real time, without the benefit of seeing the right side of the chart.
- Order mechanics: placing entries, stop-losses and targets correctly on your broker's platform.
- Routine: following the pre-session, in-session and post-session routines from lesson 12.03.05.
- Frequency: how often your setups really occur, compared with the backtest.
What They Can't Test
The big gap is emotion. Nothing is at stake, so loss aversion, fear and revenge trading barely appear. Many traders who follow their rules perfectly on paper break them within a week of trading live.
Fills are the second gap. Paper and some demo accounts fill orders at prices you might not get live, especially in fast markets, illiquid instruments or option strikes with wide spreads. Your paper results are a best case.
Step by Step: Running a Forward Test
A proper forward test
Step 1: Freeze the rules
Write the exact rules from your backtest and date them. No changes during the test.
Step 2: Set the sample size
Decide in advance how many trades the test will run for, for example 50.
Step 3: Trade in real time
Take every valid setup as it forms, with your real-account size, and log it in your journal with realistic fills and costs.
Step 4: Score execution and rules
Track your rule-adherence score as well as results.
Step 5: Compare with the backtest
Win rate, average win and loss, expectancy and setup frequency. Expect live-time results to be somewhat worse.
Step 6: Decide using pre-set criteria
For example: continue to small live size if expectancy after costs is positive and adherence is above 90%.
A Staged Path to Live Trading
| Stage | What you trade | Move on when… |
|---|---|---|
| 1. Paper / demo | No real money, real-account size | 50+ trades, positive expectancy after costs, 90%+ rule adherence |
| 2. Small live | Real money at a quarter of normal risk | 50+ trades with results reasonably close to paper, adherence held |
| 3. Half size | Half of normal risk per trade | A further 50+ trades without a drawdown beyond your limits |
| 4. Full size | Your normal risk per trade | Ongoing: drop back a stage if results or adherence fall below criteria |
The small-live stage matters most. It's the first time emotions and real fills appear, and it costs very little to find out how much they change your results.
Real Prices: A Forward-Test Record
Neha's progression in this lesson is hypothetical. The chart below shows what a forward-test record looks like on a real trade: an ICICI Bank signal in October 2026, recorded under rules that had not changed since they were written, and followed until it reached its target.
Real prices: a forward-test trade recorded in real time, ICICI Bank, October–November 2026
Step 1 of 4
The signal
On 15 October 2026 ICICI Bank closes at ₹1,389.4, above its 20-day high. Under the frozen rules, a forward tester records the trade: entry ₹1,389.4, stop ₹1,323.2 (1R ≈ ₹66), target ₹1,521.8.
- What to observe
- Rules frozen, recorded in real time: this lesson's definition of a forward test.
- Condition
- The market filter in our written plan was off that day: a plan trader would skip it.
Practical Example
Neha's backtest of an opening-range setup shows +0.18R after costs over 140 trades. On paper over six weeks, she takes 52 trades: +0.15R, 94% adherence. At quarter size live, her first 30 trades come in at −0.05R and her adherence drops to 78%: she's hesitating on entries and exiting winners early.
Instead of abandoning the strategy, she stays at quarter size and works on execution with a written pre-trade checklist. Over the next 40 trades adherence recovers to 91% and results move to +0.11R. Only then does she step up to half size.
Why the Forward Test Matters: Our Test
JustWolves took one fixed rule, buying closes above the prior 20-day high on 17 large NSE stocks with a stop below the previous five days' low, a 2R target and delivery costs of 0.25% per round trip, and measured it on its first year (November 2024 to November 2025), as a backtest would. We then measured the following year with no changes at all, as a forward test would, and added 0.1R of extra slippage to represent the difference between paper and live fills.
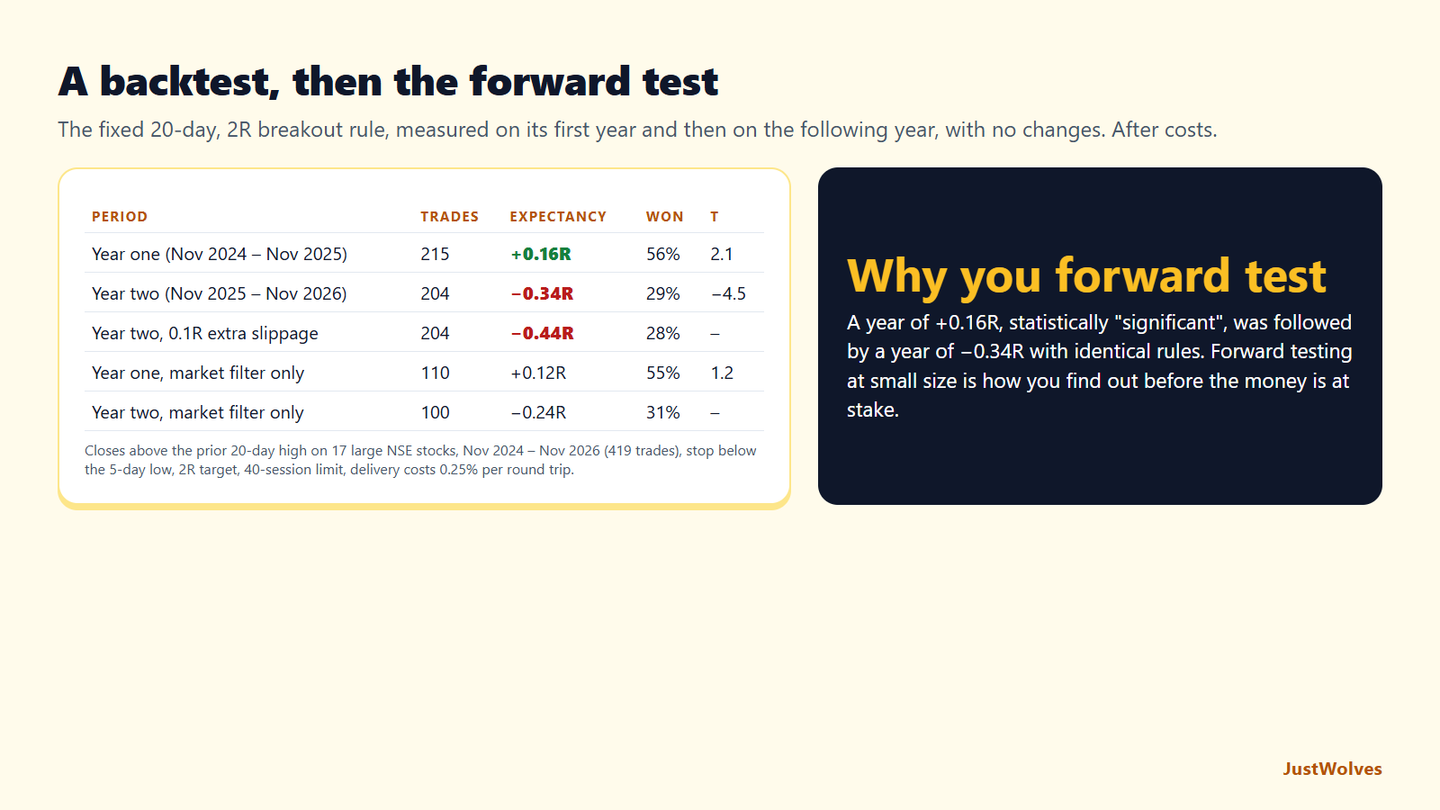
| Period | Trades | Expectancy | Won | t |
|---|---|---|---|---|
| Year one: the backtest | 215 | +0.16R | 56% | 2.1 |
| Year two: the forward test, same rules | 204 | −0.34R | 29% | −4.5 |
| Year two with 0.1R extra slippage | 204 | −0.44R | 28% | – |
| Year one, with a market filter | 110 | +0.12R | 55% | 1.2 |
| Year two, with a market filter | 100 | −0.24R | 31% | – |
A good backtest year was followed by a bad live year. The rule's first year looked convincing: +0.16R per trade over 215 trades, a 56% win rate and a t-value above 2. The next year, with nothing changed, it lost 0.34R per trade and won only 29% of the time. A trader who went straight from that backtest to full size would have had a very expensive year.
Paper fills flatter results. Adding 0.1R of slippage per trade, a modest estimate of the gap between recorded and real prices, cut the second year further, to −0.44R. This lesson's staged approach, paper first, then small live size, exists to find gaps like this cheaply.
The stages protect you from the market, not just from yourself. This lesson focuses on emotion as the gap between paper and live trading. Our data adds another: the market itself can change between the backtest and the live period. A small-size live stage, with written rules for scaling up only after the results match expectations, limits the cost of discovering that.
Common Mistakes
- Skipping straight from backtest to full size.
- Trading a demo account at fantasy size.
- Changing rules during the forward test, which turns it into another backtest.
- Treating paper results as proof. They're a best case.
- Staying on paper forever. Emotions can only be practised with real, if small, money.
Professional Insight
Professional firms commonly give new strategies and new traders a small allocation first and increase it only as live results confirm expectations. The same principle protects individuals: let the market prove the strategy, and let you prove your execution, before committing full size.
Risk Considerations
- Overconfidence after a good paper run is common; stick to the staged plan.
- Different instruments behave differently live: options spreads and slippage are much larger than paper fills suggest.
- Small samples at each stage can mislead in both directions (lesson 12.04.04).
Important Terminology
| Term | Meaning |
|---|---|
| Paper trading | Recording hypothetical trades at real prices without placing orders. |
| Demo account | A simulated trading account with virtual money. |
| Forward testing | Running frozen strategy rules on live data as it happens. |
| Staged scaling | Increasing position size in steps as results meet set criteria. |
| Fill quality | How close your execution price is to the price you intended. |
What is paper trading?
Taking trades on paper or in a simulator at real market prices without real money, to practise and test a strategy.
Is paper trading useful?
Yes, for learning setups, order mechanics and routines. It can't reproduce the emotions and fills of real trading, so treat results as a best case.
How long should I paper trade before going live?
Until you've taken enough trades to judge, for example 50 or more, with positive expectancy after costs and high rule adherence. Then go live at small size.
What is forward testing?
Running a strategy's frozen rules on live data as it arrives, to check whether a backtested edge holds on new data.
Why do my live results differ from my demo results?
Real money brings emotions that change decisions, and live fills are often worse than simulated ones. A small-size live stage helps you adjust.
Why do strategies do worse live than in backtests?
Partly emotion and execution, and partly because markets change. In our NSE test, a breakout rule that made +0.16R per trade over its first year lost 0.34R per trade over the next year with no changes, and 0.44R with a little extra slippage.
How long should I forward test before trading live?
Long enough to cover a meaningful number of trades and, ideally, more than one kind of market. Many traders paper trade for at least 30 to 50 trades, then trade small live size until results match expectations.
Practical Exercise
Plan your own forward test.
Your task
Step 1: Freeze one strategy's rules
Write and date them.
Step 2: Set your criteria
Number of trades, minimum expectancy after costs and minimum rule adherence to move to the next stage.
Step 3: Match your real account
Set the demo balance and position sizes to what you would trade live.
Step 4: Schedule the review
Put a date in your calendar to compare the forward test with your backtest.
Check Your Understanding
What makes a test a 'forward test'?
Related Lessons
Previous: How to Backtest a Trading Strategy. Next: Strategy Evaluation and Performance Analysis (12.04.04).