
Win Rate, Expectancy and Profit Factor: How to Tell If a Strategy Makes Money
JustWolves is an educational platform and is not a SEBI-registered investment advisor. Trading financial instruments involves significant risk of loss and may not be suitable for all investors. Past performance is not indicative of future results. Read our full disclaimer →
What you'll learn
- Expectancy is the average result per trade: (win rate × average win) − (loss rate × average loss)
- Profit factor is gross profit ÷ gross loss; above 1.0 means the strategy made money
- Win rate alone says nothing about profitability
- Trading costs subtract directly from expectancy and can erase a small edge
- A win rate measured on 20 trades can be off by more than 20 percentage points
In this article · 16 sections
"My strategy wins 70% of the time" sounds impressive and tells you almost nothing. Whether a strategy makes money depends on how often it wins, how much it makes when it does, how much it loses when it doesn't, and what each trade costs. Two numbers combine all of that: expectancy and profit factor. This lesson shows how to calculate both from your own trades, and how much to trust them.
What You Will Learn
- Why win rate on its own is misleading
- How to calculate expectancy and profit factor from a trade log
- How trading costs change your real edge
- How many trades you need before the numbers mean anything
Before You Start
Read Risk-Reward Ratio Explained first. You should be comfortable measuring trades in units of risk (R), where 1R is the amount you lose if your stop is hit.
Why Win Rate Misleads
Win rate is the share of trades that make money. It is easy to measure and pleasant to quote, which is why it appears in so many adverts. But it ignores the size of wins and losses.
A strategy that wins 70% of the time but makes only half as much on a winner as it loses on a loser earns +0.05R per trade, barely above zero. A strategy that wins 30% of the time but makes three times its risk on winners earns +0.20R per trade, four times as much. The second one loses seven times out of ten and is the better strategy.
Expectancy: The Average Result per Trade
If your expectancy is +0.2R and you risk ₹2,000 per trade, each trade is worth about +₹400 on average, before costs. Over 100 trades that is roughly 20R, or ₹40,000, though the path there will include losing streaks.
If expectancy is zero or negative, no amount of discipline or position sizing makes the strategy profitable. As lesson 12.01.02 showed, small bets only slow the decline.
Profit Factor: Gross Profit Over Gross Loss
Profit factor is the total of all winning trades divided by the total of all losing trades, ignoring sign. A profit factor of 1.5 means the strategy made ₹1.50 for every ₹1 it lost.
Below 1.0 the strategy lost money; exactly 1.0 is break-even; above 1.0 it made money. Profit factor is popular in backtesting reports because it is independent of position size, but it hides how many trades produced the result, so always read it alongside the number of trades and the expectancy.
| Win rate | Risk-reward | Expectancy per trade | Profit factor |
|---|---|---|---|
| 60% | 1:1 | +0.20R | 1.50 |
| 40% | 1:2 | +0.20R | 1.33 |
| 30% | 1:3 | +0.20R | 1.29 |
| 70% | 1:0.5 | +0.05R | 1.17 |
Step by Step: Calculate Both From a Trade Log
Here is a hypothetical journal of 20 trades, each recorded in R. Eight were winners: +2.1, +1.8, +0.6, +2.5, +1.2, +3.0, +1.5 and +0.9. Twelve were losers: eleven between −0.4 and −1.2 and averaging just under 1R, because some were closed early.
Working through the log
Step 1: Count wins and losses
8 wins and 12 losses out of 20 trades: a win rate of 40%.
Step 2: Total the winners and losers
Winners add up to +13.6R (gross profit). Losers add up to −11.2R (gross loss).
Step 3: Find the averages
Average win = 13.6 ÷ 8 = 1.70R. Average loss = 11.2 ÷ 12 ≈ 0.93R.
Step 4: Calculate expectancy
(0.40 × 1.70) − (0.60 × 0.93) ≈ +0.12R per trade. As a check, the net result 13.6 − 11.2 = +2.4R divided by 20 trades is also +0.12R.
Step 5: Calculate profit factor
13.6 ÷ 11.2 ≈ 1.21.
Step 6: Convert to rupees
At ₹2,000 risk per trade, +2.4R is +₹4,800 over the 20 trades, before costs.
How Costs Eat Your Edge
Brokerage, taxes, exchange charges, spreads and slippage make every win a little smaller and every loss a little bigger. A useful way to think about them is in R: if the round-trip cost of a trade is 5% of your risk amount, that is 0.05R per trade, and it comes straight off your expectancy.
That's why small intraday targets are so demanding. The tighter your stop, the larger a fixed rupee cost becomes as a fraction of R.
| Cost per trade | Expectancy after costs |
|---|---|
| 0R (no costs) | +0.20R |
| 0.05R | +0.15R |
| 0.10R | +0.10R |
| 0.20R | 0.00R: no edge left |
How Many Trades Before You Can Trust the Numbers?
A win rate measured on a few trades is mostly noise. The table and chart show roughly how far a measured win rate can wander from the true one, at 95% confidence, when the true win rate is 40%.
| Trades measured | Plausible range (±, 95%) | Measured win rate could be |
|---|---|---|
| 20 | ±21.5 points | about 18% to 62% |
| 50 | ±13.6 points | about 26% to 54% |
| 100 | ±9.6 points | about 30% to 50% |
| 200 | ±6.8 points | about 33% to 47% |
| 400 | ±4.8 points | about 35% to 45% |
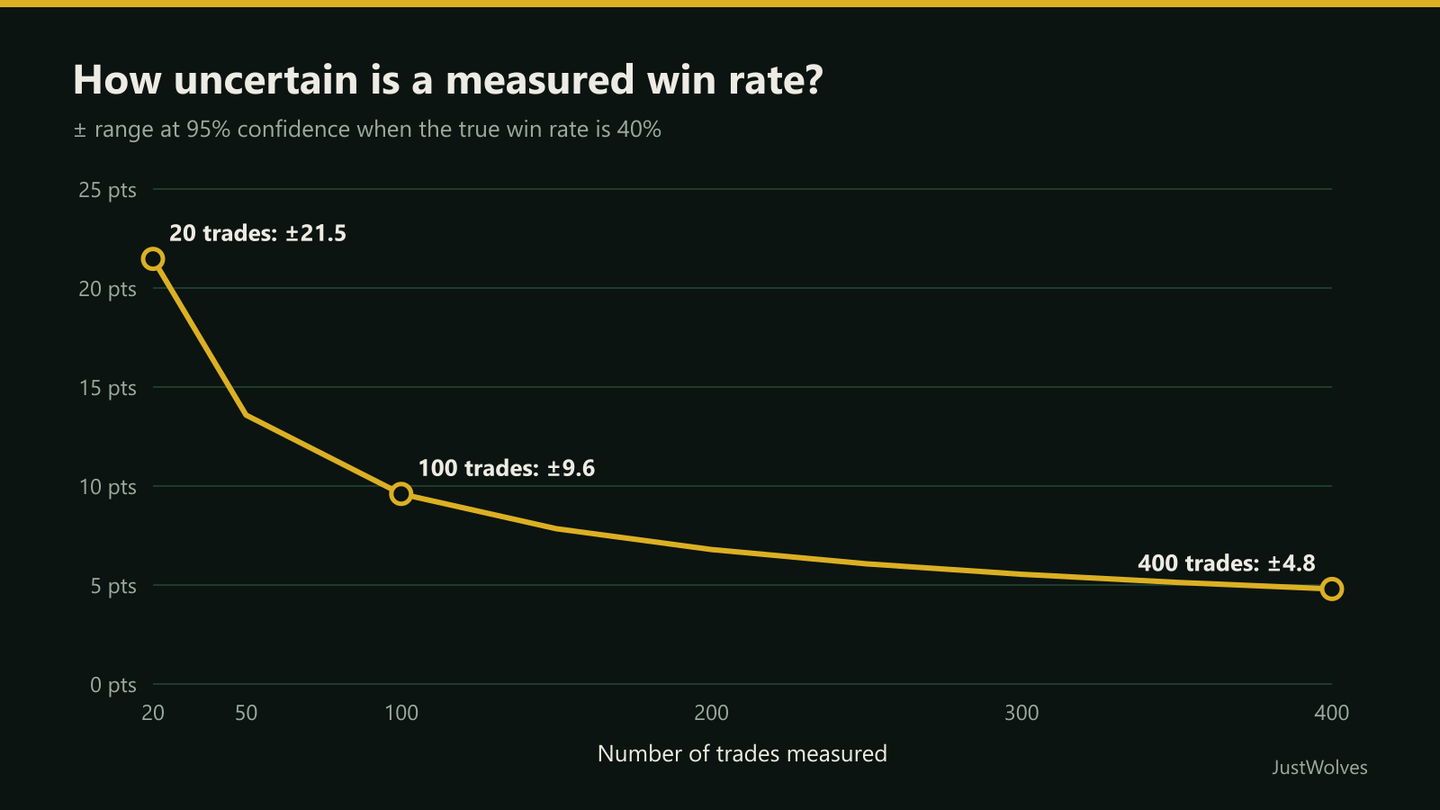
The practical rule: treat anything under about 100 trades as a rough first look, and expect your measured win rate to drift as more trades come in. Lesson 12.04.04 covers evaluating a strategy properly, including how to avoid fooling yourself with a lucky stretch.
Real Prices: A Sample That Misleads
This lesson warns that a few dozen trades say little about a strategy. The chart below shows how badly a small sample can mislead, on real Axis Bank prices from September and October 2025: seven winning trades in a row from one simple rule, all from the same rally.
Real prices: seven winning breakouts in a row, and why they prove little, Axis Bank, September–October 2025
Step 1 of 4
The first breakout
Axis Bank bases near ₹1,045–1,065 through early September 2025, then on 12 September closes at ₹1,105.3, above its 20-day high: a breakout trade with a stop below the previous five days' low, about ₹1,044, and a 2R target near ₹1,228.
- What to observe
- One trade, one sample point.
- Condition
- The same rule triggers again as the rally continues.
Practical Example
Divya's scalping journal shows a 62% win rate over 150 trades, which she is proud of. Her average win is 0.7R and her average loss 1.0R, because she often takes quick profits and occasionally lets a loser run past her stop.
Expectancy = (0.62 × 0.7) − (0.38 × 1.0) = 0.434 − 0.38 = +0.054R before costs. Her costs average 0.08R per trade, because her stops are tight. After costs her expectancy is about −0.03R: a losing strategy with a high win rate. The fix isn't a better entry; it's letting winners reach their targets and never moving a stop.
How Much Do 20, 50 or 100 Trades Tell You? Our Test
JustWolves measured this on a real trade stream: every close above the prior 20-day high on 17 large NSE stocks from November 2024 to November 2026, with a stop below the previous five days' low, a 2R target and delivery costs of 0.25% per round trip. Over all 419 trades, the strategy won 43% of the time with an expectancy of −0.08R and a profit factor of 0.84. We then cut the stream, in date order, into blocks of 20, 50 and 100 consecutive trades, and measured the same numbers in each block, as a trader evaluating the strategy on a short record would.
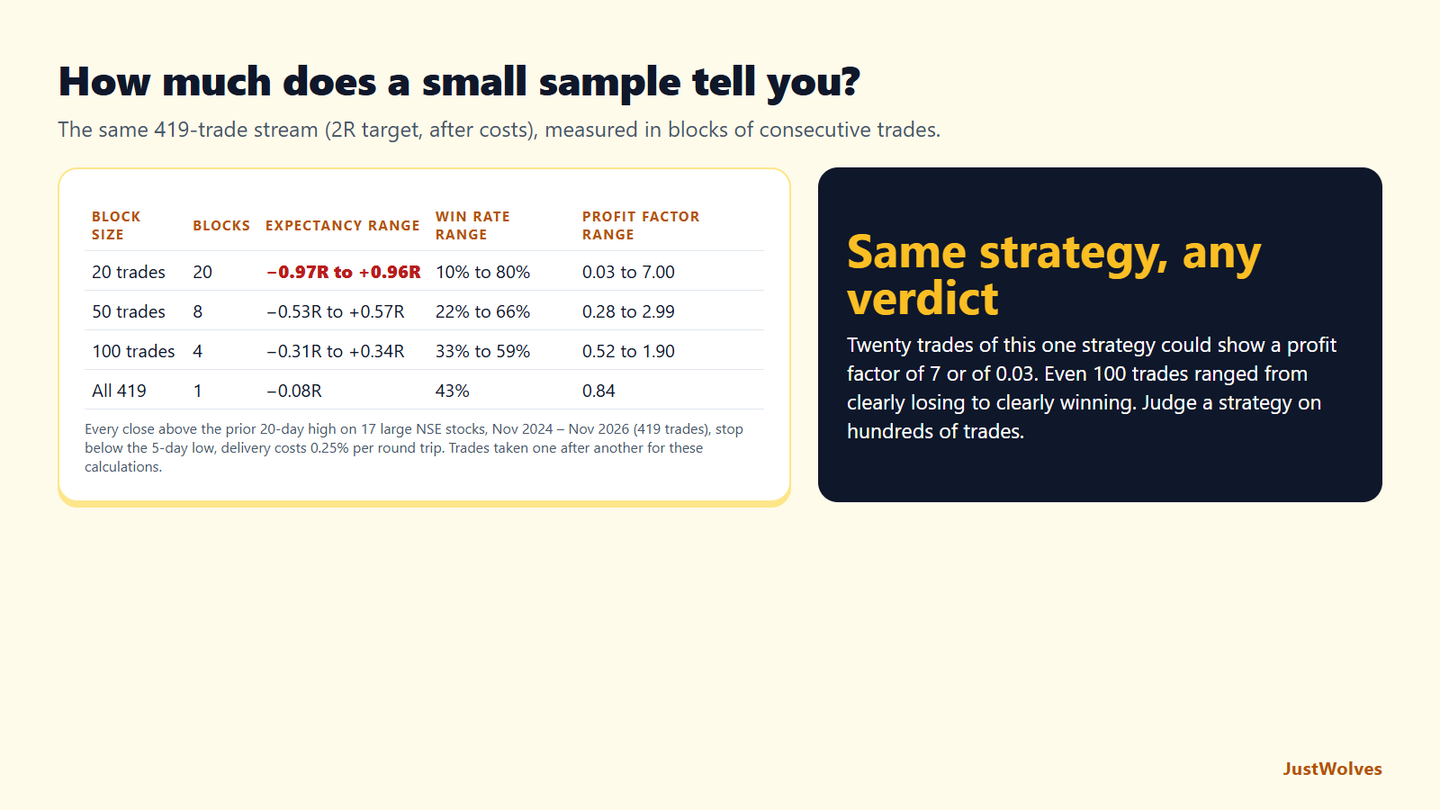
| Block size | Blocks | Expectancy range | Win rate range | Profit factor range |
|---|---|---|---|---|
| 20 trades | 20 | −0.97R to +0.96R | 10% to 80% | 0.03 to 7.00 |
| 50 trades | 8 | −0.53R to +0.57R | 22% to 66% | 0.28 to 2.99 |
| 100 trades | 4 | −0.31R to +0.34R | 33% to 59% | 0.52 to 1.90 |
| All 419 trades | 1 | −0.08R | 43% | 0.84 |
Twenty trades could prove anything. Over 20 consecutive trades, the same unchanged strategy showed a profit factor anywhere from 0.03 to 7.00 and a win rate from 10% to 80%. A trader starting at the wrong moment would have abandoned it as hopeless; one starting at the right moment would have thought it exceptional.
Even 100 trades left a wide range. Blocks of 100 ranged from −0.31R to +0.34R per trade, from clearly losing to clearly profitable, while the strategy as a whole was slightly negative. This is the sample-size section of this lesson in practice: the uncertainty narrows slowly, and a few hundred trades are a minimum for confidence.
Correlated trades make it worse. The Axis Bank chart above shows seven trades that were really one rally. Trade records from a single market phase, or full of overlapping positions in related stocks, contain fewer independent results than their count suggests. Count independent episodes, not just trades.
Costs belong in every number. All the figures here include delivery costs; before costs, the stream's expectancy was −0.04R. As the costs section of this lesson says, a profit factor or expectancy calculated before costs flatters every strategy.
Common Mistakes
- Quoting win rate without payoff. Always pair it with the average win and average loss.
- Ignoring costs. Calculate expectancy after brokerage, taxes and slippage.
- Trusting a small sample. A great first month is not evidence of an edge.
- Leaving out the big loss. Excluding 'one-off' disasters from the log flatters every number.
- Mixing strategies in one log. Measure each setup separately, or a good one can hide a bad one.
Advanced Insight
Experienced traders look at the *distribution* of results, not just the averages. A strategy with +0.15R expectancy built on many small wins and a rare −6R loss behaves very differently from one built on steady 1R losses and occasional 3R wins, even with the same averages. The first is the profile of most option-selling strategies and is far more dangerous to size aggressively. Keep your largest loss and your longest losing streak next to your expectancy.
Risk Considerations
- Past expectancy is not future expectancy. Market conditions change and edges decay.
- Backtests flatter. Expect live expectancy to be lower than a backtest because of slippage, missed trades and execution errors.
- Outliers dominate. One very large loss or win can swing the averages of a small sample.
Important Terminology
| Term | Meaning |
|---|---|
| Win rate | The share of trades that made money. |
| Average win / average loss | Total profit from winners ÷ number of winners; total loss from losers ÷ number of losers. |
| Expectancy | Average result per trade: (win rate × average win) − (loss rate × average loss). |
| Profit factor | Gross profit ÷ gross loss. Above 1.0 means net profitable. |
| Gross profit / gross loss | The sum of all winning trades; the sum of all losing trades (as a positive number). |
| Sample size | The number of trades your statistics are based on. |
What is expectancy in trading?
The average amount a strategy makes or loses per trade, usually measured in units of risk (R). Positive expectancy means the strategy makes money over many trades; negative means it loses.
What is a good profit factor?
Anything reliably above 1.0 after costs is profitable. Many traders treat 1.3–2.0 over a large sample as healthy; very high profit factors over a few trades are usually luck or over-fitting.
Is a high win rate good?
Only if the average win is large enough relative to the average loss. A 70% win rate at 1:0.5 barely makes money, and after costs may lose it.
How many trades do I need to evaluate a strategy?
At least 100 for a rough read, and several hundred for confidence. Even at 100 trades a measured 40% win rate could plausibly be anywhere from about 30% to 50%.
How do trading costs affect expectancy?
Measured in R, they subtract directly. A strategy with +0.2R expectancy and costs of 0.05R per trade really earns about +0.15R.
How many trades do I need to judge a strategy?
More than most traders think. In our real NSE stream, 20-trade samples of the same strategy showed profit factors from 0.03 to 7.00, and even 100-trade samples ranged from −0.31R to +0.34R expectancy. A few hundred independent trades is a sensible minimum.
What profit factor is good?
Above 1 after costs means the strategy made money over the sample; many traders look for 1.3 or more over a large sample. In our test, a strategy with a long-run profit factor of 0.84 showed values above 2 in several short samples, so the sample size matters as much as the number.
Practical Exercise
Use your last 20–50 trades (from a journal, broker statement or paper-trading log). If you have none yet, use the 20-trade example above and add your own estimate of costs.
Your task
Step 1: Convert each trade to R
Divide each trade's profit or loss by the amount you planned to risk on it.
Step 2: Calculate the four numbers
Win rate, average win, average loss, and expectancy. Then profit factor.
Step 3: Subtract costs
Estimate your average cost per trade in R and subtract it from expectancy.
Step 4: Note the uncertainty
Using the sample-size table, write down the plausible range for your win rate.
Step 5: Decide one change
If expectancy after costs is near zero, identify whether the problem is win rate, average win or average loss, and pick one behaviour to change.
Check Your Understanding
Win rate 50%, average win 1.4R, average loss 1.0R. What is the expectancy?
Related Lessons
Previous: Risk-Reward Ratio Explained. See also Capital Preservation and Risk of Ruin. Coming up in this course: keeping a trading journal (12.04.01) and evaluating a strategy's performance (12.04.04).