
How to Backtest a Trading Strategy: A Step-by-Step Guide
JustWolves is an educational platform and is not a SEBI-registered investment advisor. Trading financial instruments involves significant risk of loss and may not be suitable for all investors. Past performance is not indicative of future results. Read our full disclaimer →
What you'll learn
- A backtest applies fixed rules to past data to estimate how a strategy would have behaved
- Rules must be objective enough that two people would take the same trades
- Include realistic costs and slippage, or the results will flatter the strategy
- Test enough trades, and keep some data aside to check the result out of sample
- Look-ahead, selection and over-fitting biases are the main ways backtests mislead
In this article · 15 sections
Before risking money on a strategy, you want some evidence that it has worked: how often it wins, how much it makes, how deep its drawdowns get. A backtest provides that evidence by applying the strategy's rules to historical charts. Done carefully, it's the cheapest education in trading. Done carelessly, it produces confident numbers that the live market will not repeat.
What You Will Learn
- What a backtest can and can't tell you
- How to write rules objective enough to test
- A step-by-step method for manual backtesting
- The biases that make backtests look better than reality, and how to avoid them
Before You Start
Read How to Keep a Trading Journal and Win Rate, Expectancy and Profit Factor. A backtest is a journal of hypothetical trades, measured with the same statistics.
What a Backtest Is
A backtest applies a strategy's exact rules to past market data and records every trade those rules would have produced. From that list you calculate win rate, expectancy, profit factor, maximum drawdown and losing streaks.
A backtest shows how a set of rules *would have* behaved in one period of history. It can't prove the strategy will work in future, and it can't capture everything about live trading: your emotions, your actual fills, missed trades. What it does well is rule out strategies that never had an edge, and set realistic expectations for the ones that might.
Manual vs Automated Backtesting
| Manual (bar by bar) | Automated (software) | |
|---|---|---|
| How | Scroll through history candle by candle, e.g. with a chart replay tool, recording each trade | Code the rules in a platform's strategy tester and run them over the data |
| Best for | Discretionary setups (price action, SMC) and learning a strategy deeply | Fully rule-based strategies (indicator crossovers, breakouts) |
| Speed | Slow: tens of trades per hour | Fast: years of data in seconds |
| Main risk | Hindsight: seeing the right side of the chart | Over-fitting: tuning settings until the past looks perfect |
Most retail strategies on this site are partly discretionary, so manual backtesting is usually the starting point. Lesson 12.04.03 covers forward testing, and the automated route is covered in the strategy-tester lessons later in the curriculum.
Step by Step: A Manual Backtest
From rules to results
Step 1: Write the rules
Market, timeframe, session, setup conditions, entry trigger, stop placement, target or exit method, and position sizing. Be specific enough that someone else could follow them.
Step 2: Choose the data
Pick a period that includes different conditions: trending, ranging, high and low volatility. Note the dates.
Step 3: Hide the future
Use a chart replay tool or move the chart forward one candle at a time so you can't see what happens next.
Step 4: Record every valid setup
Losers and the ones that 'looked messy' included. Log them in a journal with the same fields as live trades.
Step 5: Apply costs
Subtract realistic brokerage, taxes, spread and slippage from every trade.
Step 6: Reach a meaningful sample
Aim for at least 100 trades before drawing conclusions; more if results are close to break-even (lesson 12.04.04).
Step 7: Hold some data back
Develop the rules on one period, then run them unchanged on a later period you haven't looked at. Compare the two.
Costs Change the Answer
Suppose 100 backtested trades show +0.20R expectancy before costs, or +20R in total. Here is what realistic friction does to it:
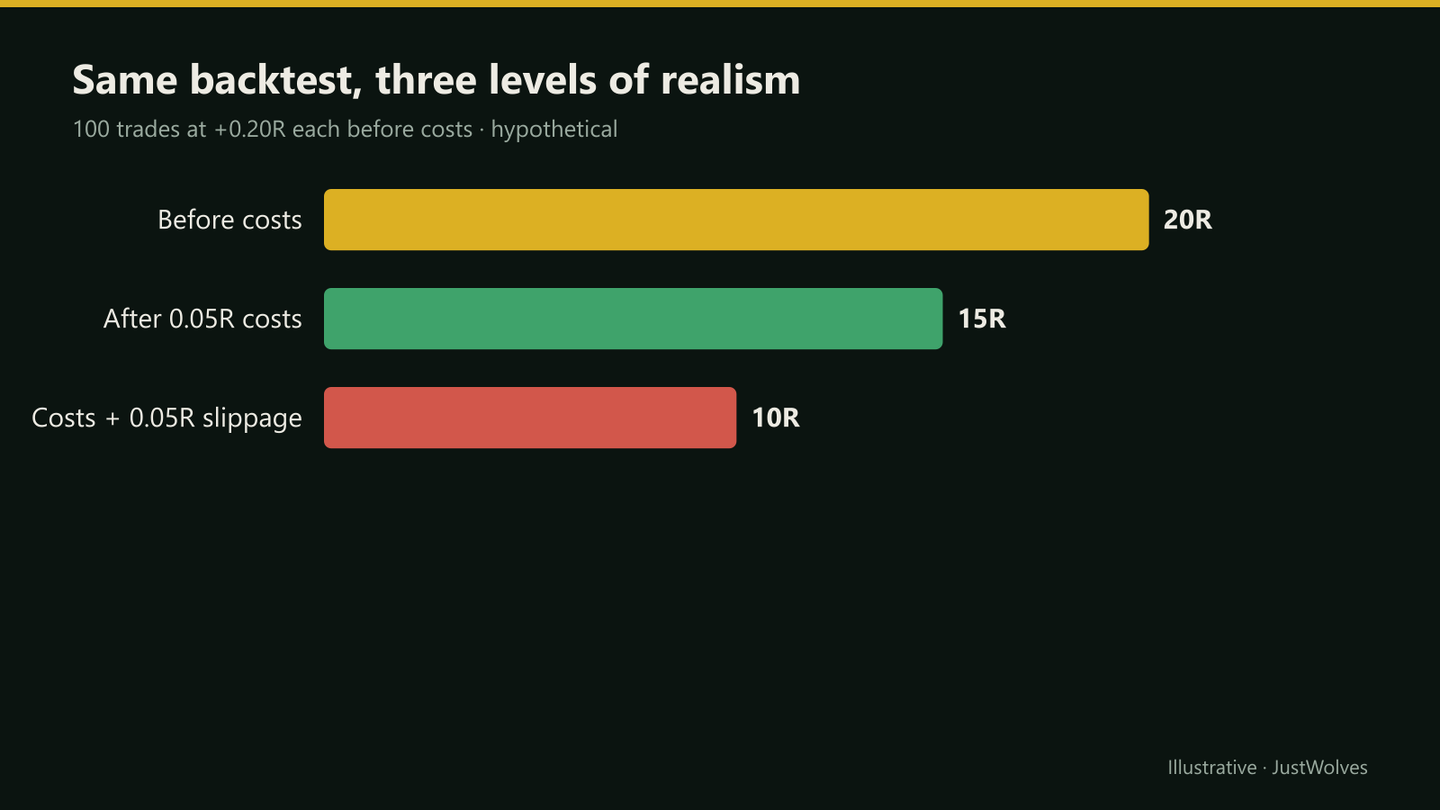
Half the apparent edge disappeared without any change to the strategy. Strategies with small targets, such as scalping, are most sensitive, because a fixed rupee cost is a larger fraction of R.
The Biases That Flatter Backtests
- Look-ahead bias: using information that wasn't available at the time, such as a candle's close before it closed, or a swing high that's only obvious later.
- Selection bias: skipping setups that looked ugly in hindsight, or testing only the period where the strategy shone.
- Over-fitting: adjusting rules and settings until the past looks excellent. The more you tune, the less the result means (lesson 12.04.04).
- Ignoring costs and slippage: covered above.
- Survivorship bias: testing only stocks that exist today, which leaves out companies that collapsed or were delisted.
Real Prices: In-Sample and Out-of-Sample
Ravi's example in this lesson tests a strategy on one half of the data and checks it on the other. The chart below shows why that matters, on real NIFTY 50 prices: a first year that mostly rose, and a second year of falls and sharp swings.
Real prices: two different years for the same backtest, NIFTY 50, November 2024 – November 2026
Step 1 of 4
Year one: in-sample
From November 2024 to October 2025, NIFTY 50 dips to about 21,750 in early April 2025, then climbs to about 26,100. A breakout strategy tuned on this year sees a market that mostly rewards buying strength.
- What to observe
- This is the data the rules were chosen on.
- Condition
- Every one of 20 rule variants was profitable here.
Practical Example
Ravi backtests a pullback setup on Nifty 15-minute charts. On January–June data he records 112 trades: 46% win rate, average win 1.6R, average loss 1R, +0.28R expectancy before costs and +0.20R after. Encouraged, he runs the identical rules on July–December without changing anything: 98 trades at +0.09R after costs.
The edge is smaller than his first sample suggested but still positive. He plans his live expectations around the lower number and moves to forward testing (lesson 12.04.03) instead of going straight to full size.
Tune on One Year, Test on the Next: Our Test
JustWolves ran a small, honest version of this lesson's process on 17 large NSE stocks. We built 20 versions of a breakout strategy, combining four breakout lengths (10, 20, 40 and 55-day highs) with five targets (1R to 4R), all with a stop below the previous five days' low, a 40-session limit and delivery costs of 0.25% per round trip. We measured every version on year one (November 2024 to November 2025), picked the best, and then tested all of them on year two (November 2025 to November 2026), which none of them had seen.
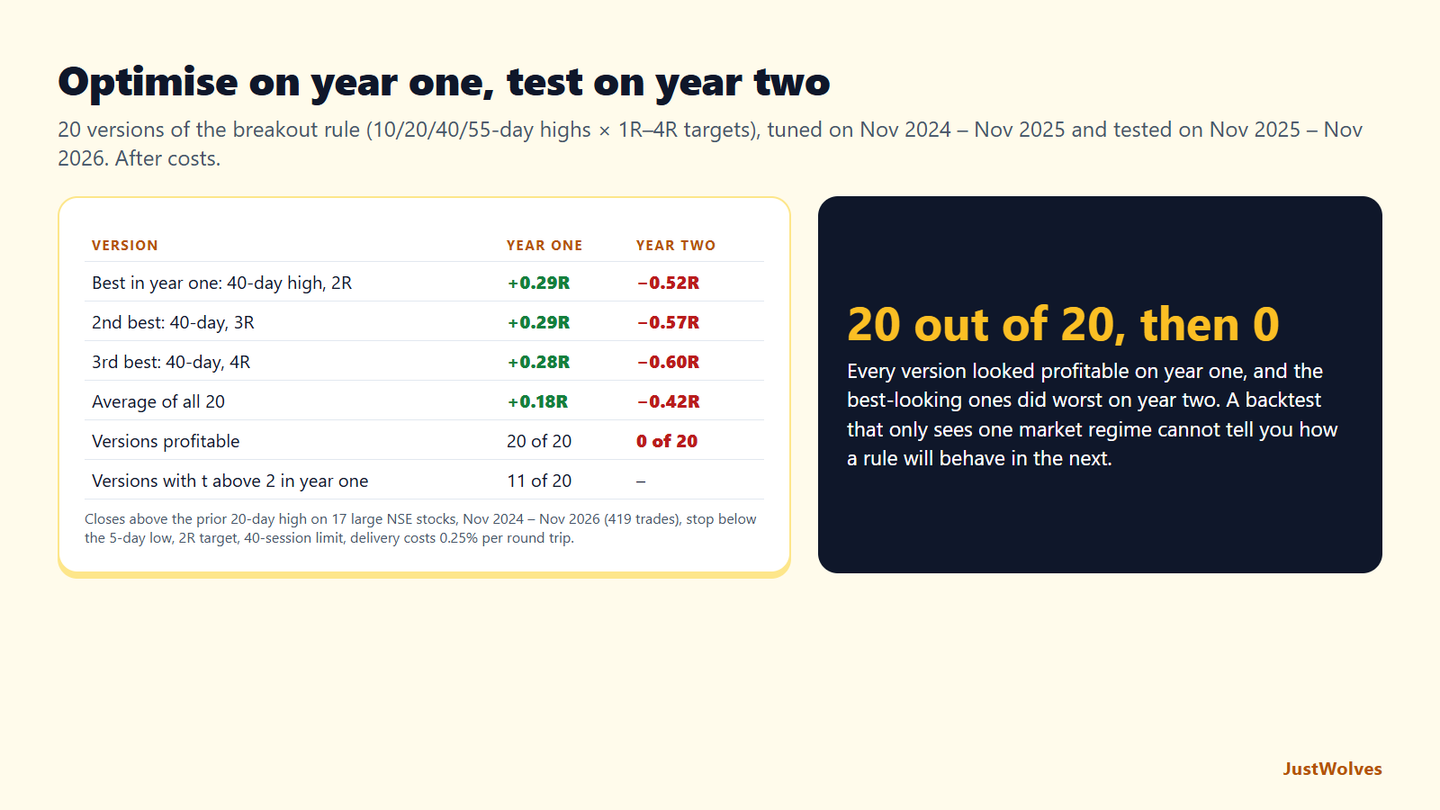
| Variant | Year one (in-sample) | Year two (out-of-sample) |
|---|---|---|
| Best in year one: 40-day high, 2R | +0.29R (145 trades) | −0.52R (127 trades) |
| 2nd: 40-day high, 3R | +0.29R | −0.57R |
| 3rd: 40-day high, 4R | +0.28R | −0.60R |
| Average of all 20 variants | +0.18R | −0.42R |
| Variants profitable | 20 of 20 | 0 of 20 |
| Variants with t above 2 | 11 of 20 | – |
A backtest on one year was badly misleading. Every one of the 20 versions made money in year one, and more than half passed a common statistical test. Picking the best of them, the 40-day breakout with a 2R target, would have looked like careful work. In year two it lost 0.52R per trade, and the three best year-one versions were among the worst.
The bias was not in the rules but in the sample. This lesson lists look-ahead and survivorship among the biases; this is another, sometimes called regime bias: a single period represents only one kind of market. Year one mostly rewarded breakouts; year two, with two sharp falls, punished them. Choosing the "best" settings simply chose the ones most fitted to year one.
What to do about it. Keep an out-of-sample period, as this lesson's example does; include different kinds of market in the test; prefer settings that work reasonably across many variants rather than the single best; and, as the professional insight in this lesson says, treat the backtested expectancy as a ceiling, not an estimate.
Common Mistakes
- Vague rules that let you decide afterwards which setups 'counted'.
- Testing too few trades and treating the result as proven.
- Changing rules mid-test without restarting the count.
- Ignoring drawdowns and streaks, which matter as much as the average.
- Going live at full size straight after a backtest.
Professional Insight
Professionals expect live results to be worse than backtests and plan for it. A common rule of thumb is to treat the backtested expectancy as a ceiling and size the strategy as if live expectancy might be half of it, scaling up only after live results confirm the edge.
Risk Considerations
- Markets change: a strategy that worked in one regime may not work in the next.
- Data quality: missing candles, wrong prices or adjusted data can change results.
- Execution differences: live fills, liquidity and your own hesitation will differ from the backtest.
Important Terminology
| Term | Meaning |
|---|---|
| Backtest | Applying fixed rules to historical data to record the trades they would have produced. |
| In-sample / out-of-sample | Data used to build the rules / data held back to test them unchanged. |
| Look-ahead bias | Using information in a test that wasn't available at the time. |
| Over-fitting | Tuning rules so closely to past data that they fail on new data. |
| Survivorship bias | Testing only on instruments that still exist today. |
| Slippage | The difference between the expected and the actual fill price. |
What is backtesting in trading?
Testing a strategy's rules on historical data to see what trades they would have produced and how those trades performed.
How many trades should a backtest include?
At least 100 for a first read, and more if the edge looks small. Fewer trades make the statistics unreliable.
Is manual backtesting accurate?
It can be, if the rules are objective, the future is hidden while testing, and every valid setup is recorded. Its main weakness is hindsight.
Can a good backtest guarantee profits?
No. It shows how rules behaved in the past. Live results are usually worse because of costs, slippage, execution and changing markets.
What is out-of-sample testing?
Running the finished rules, unchanged, on data you didn't use to create them, to check whether the edge holds.
What is overfitting in backtesting?
Choosing rules or settings that fit the past data too closely. In our NSE test, the best of 20 breakout variants on year one (+0.29R per trade) lost 0.52R per trade on year two, while the average variant fell from +0.18R to −0.42R.
How do I check a backtest for overfitting?
Hold back an out-of-sample period, test across different market conditions, and prefer settings that work across many nearby variants. In our NSE test, every one of 20 variants looked profitable on one year and none on the next.
Practical Exercise
Backtest one setup you already trade, or the pullback setup from the swing trading course.
Your task
Step 1: Write the rules on one page
Specific enough for someone else to follow.
Step 2: Test 50 trades on replay
Record each in a journal sheet, including costs.
Step 3: Calculate the statistics
Win rate, average win and loss, expectancy, maximum drawdown, longest losing streak.
Step 4: Test 50 more on a different period
Without changing the rules. Compare the two halves.
Check Your Understanding
A backtest shows +0.25R per trade before costs; costs and slippage total 0.1R per trade. What is the realistic expectancy?
Related Lessons
Previous: How to Keep a Trading Journal. Next: Demo Trading, Paper Trading and Forward Testing (12.04.03).