
Strategy Evaluation and Performance Analysis: Is Your Edge Real?
JustWolves is an educational platform and is not a SEBI-registered investment advisor. Trading financial instruments involves significant risk of loss and may not be suitable for all investors. Past performance is not indicative of future results. Read our full disclaimer →
What you'll learn
- Evaluate a strategy with a small set of metrics, always read together: trades, expectancy, profit factor, drawdown and streaks
- A small edge needs many trades before it can be told apart from luck
- With +0.12R expectancy and typical variability, it can take around 500+ trades to be confident
- Compare live results with the backtest and expect them to be somewhat worse
- Decide in advance what would make you stop or reduce a strategy
In this article · 14 sections
After a month of good results it's natural to feel you've found an edge; after a bad month, natural to feel it's gone. Both feelings usually come from too few trades. This lesson gives you a short list of metrics to judge a strategy, a realistic sense of how many trades it takes before a result means anything, and clear rules for when to keep going, cut size or stop.
What You Will Learn
- The core metrics for evaluating a strategy, and how to read them together
- Why small edges need large samples, with a simple significance check
- How to compare live results with a backtest
- How to set stop rules for a strategy before you need them
Before You Start
Read How to Keep a Trading Journal, How to Backtest a Trading Strategy and Maximum Drawdown. This lesson uses all three.
The Core Metrics
| Metric | What it tells you | Watch out for |
|---|---|---|
| Number of trades | How much evidence you have | Anything under ~100 is a rough first look |
| Expectancy (R per trade, after costs) | Whether the strategy makes money on average | Small positive values that could be noise |
| Profit factor | Gross profit ÷ gross loss | Very high values on few trades |
| Win rate and average win / loss | How the expectancy is made | High win rates hiding large average losses |
| Maximum drawdown (R and %) | The worst decline you'd have lived through | Assume the future will be deeper |
| Longest losing streak | What a bad run feels like | Whether you could keep following the rules through it |
| Rule adherence | Whether results reflect the strategy or your execution | Low adherence makes every other metric unreliable |
Read them together. A positive expectancy with a 40R drawdown may be untradeable for you; a modest expectancy with shallow drawdowns may be excellent.
How Many Trades Before an Edge Is Real?
Trade results vary a lot from one trade to the next, so a small average edge is easily hidden by noise. A simple check compares your expectancy with that variability: t = expectancy ÷ (standard deviation of results ÷ √number of trades). A value around 2 or more suggests the edge is unlikely to be luck alone; values well below 2 mean you can't yet tell.
The 20-trade journal from lesson 12.04.01 had an expectancy of +0.12R with a standard deviation of about 1.42R per trade. If the strategy kept producing results like that, here is how the evidence would build:
| Trades | t-value | What you can say |
|---|---|---|
| 20 | 0.38 | Nothing yet |
| 100 | 0.84 | Encouraging, not evidence |
| 200 | 1.19 | Still could be luck |
| 400 | 1.69 | Getting closer |
| 560 | ≈ 2.0 | Reasonable evidence of an edge |
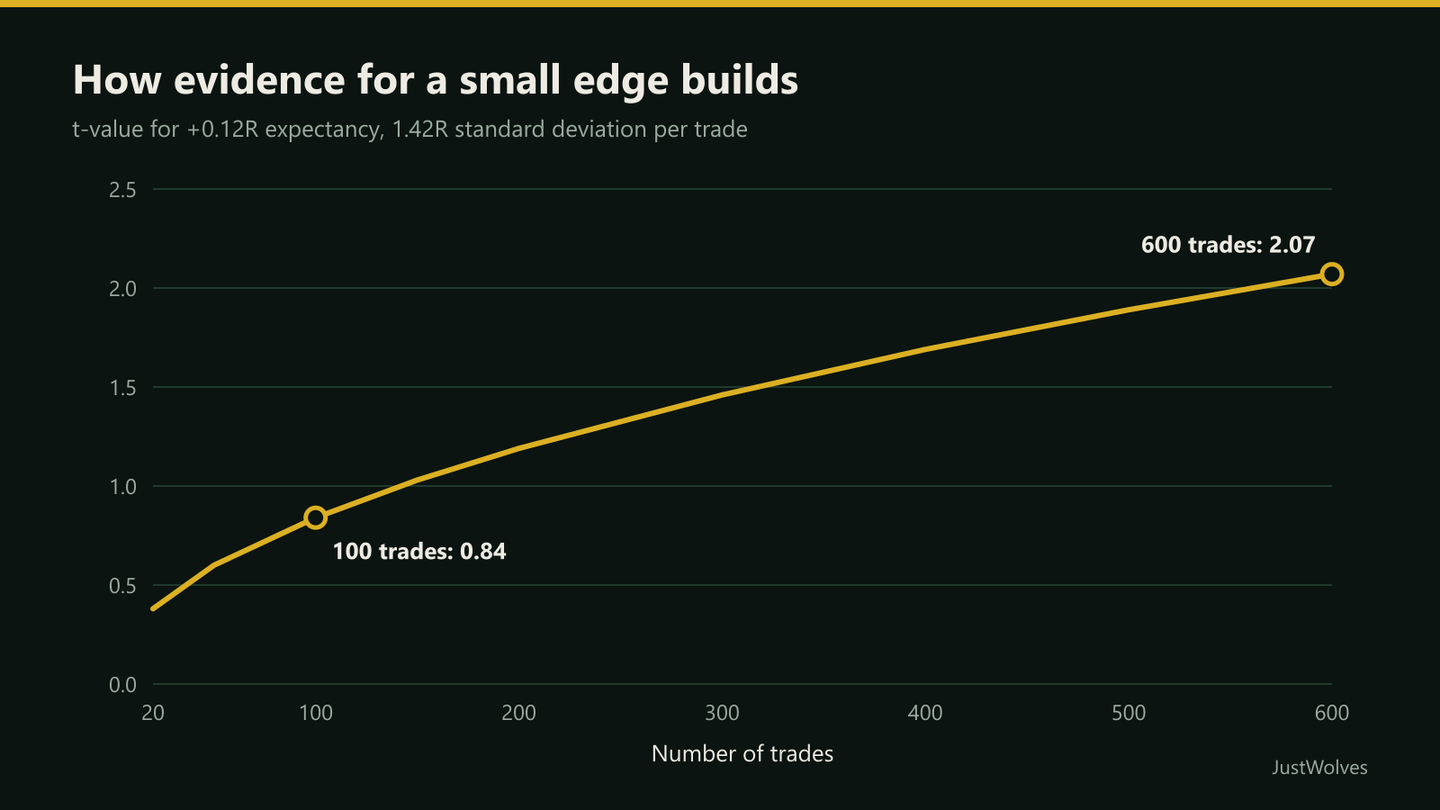
This is sobering but useful. A small edge takes hundreds of trades to confirm, which is why a few good or bad weeks should rarely change your mind about a strategy. Larger edges confirm faster; inconsistent strategies, with large swings in results, confirm more slowly.
Real Prices: Many Trades, Few Results
The significance check in this lesson assumes independent trades. The chart below shows how far from independent real trades can be: eleven losing breakout trades in a row on State Bank of India in early 2026, all caused by two declines, on a stock that rose overall.
Real prices: eleven losing breakouts in a rising stock, State Bank of India, January–March 2026
Step 1 of 4
Five breakouts
State Bank of India makes new 20-day highs again and again in January 2026: the breakout rule fires on 13, 16, 28, 29 and 30 January, each with a stop below the previous five days' low.
- What to observe
- Five trades, all on the same stock and the same move.
- Condition
- Five trades, but really one bet.
Comparing Live Results With the Backtest
A monthly comparison
Step 1: Line up the same metrics
Expectancy, win rate, average win and loss, trade frequency and adherence for live trades and for the backtest.
Step 2: Check frequency first
If you're taking far more or fewer trades than the backtest, you're probably not trading the same strategy.
Step 3: Check adherence
Below about 90%, differences are likely execution, not the strategy.
Step 4: Expect some decay
Live expectancy somewhat below the backtest is normal. A gap that keeps widening is a warning.
Step 5: Look for regime change
Has volatility or trend behaviour changed in a way that affects the setup?
When to Stop or Reduce a Strategy
Write these before you start trading the strategy, and review them monthly, never mid-drawdown.
- Drawdown rule: if live drawdown exceeds, say, 1.5 × the backtest's maximum, stop and review.
- Expectancy rule: if expectancy after costs is negative over a meaningful sample (for example 100 trades with high adherence), reduce to the small-live stage or stop.
- Losing-streak rule: if a streak exceeds anything in the backtest by a clear margin, pause and check whether conditions have changed.
- Adherence rule: if adherence falls below your threshold, fix execution first; the strategy can't be judged until you're trading it.
Practical Example
Siddharth has traded a swing strategy live for 180 trades at +0.10R after costs, against a backtest of +0.16R. His maximum live drawdown is 11R against a backtest maximum of 9R, and his adherence is 93%.
Checking the scorecard: frequency matches the backtest, adherence is high, live expectancy is lower but still positive, and the drawdown is within his 1.5 × rule (13.5R). His t-value is around 1, not yet strong evidence either way. He keeps trading at his current size and reviews again at 300 trades, rather than abandoning a strategy that's behaving within its expected range.
How Many Trades Confirm an Edge? Our Test
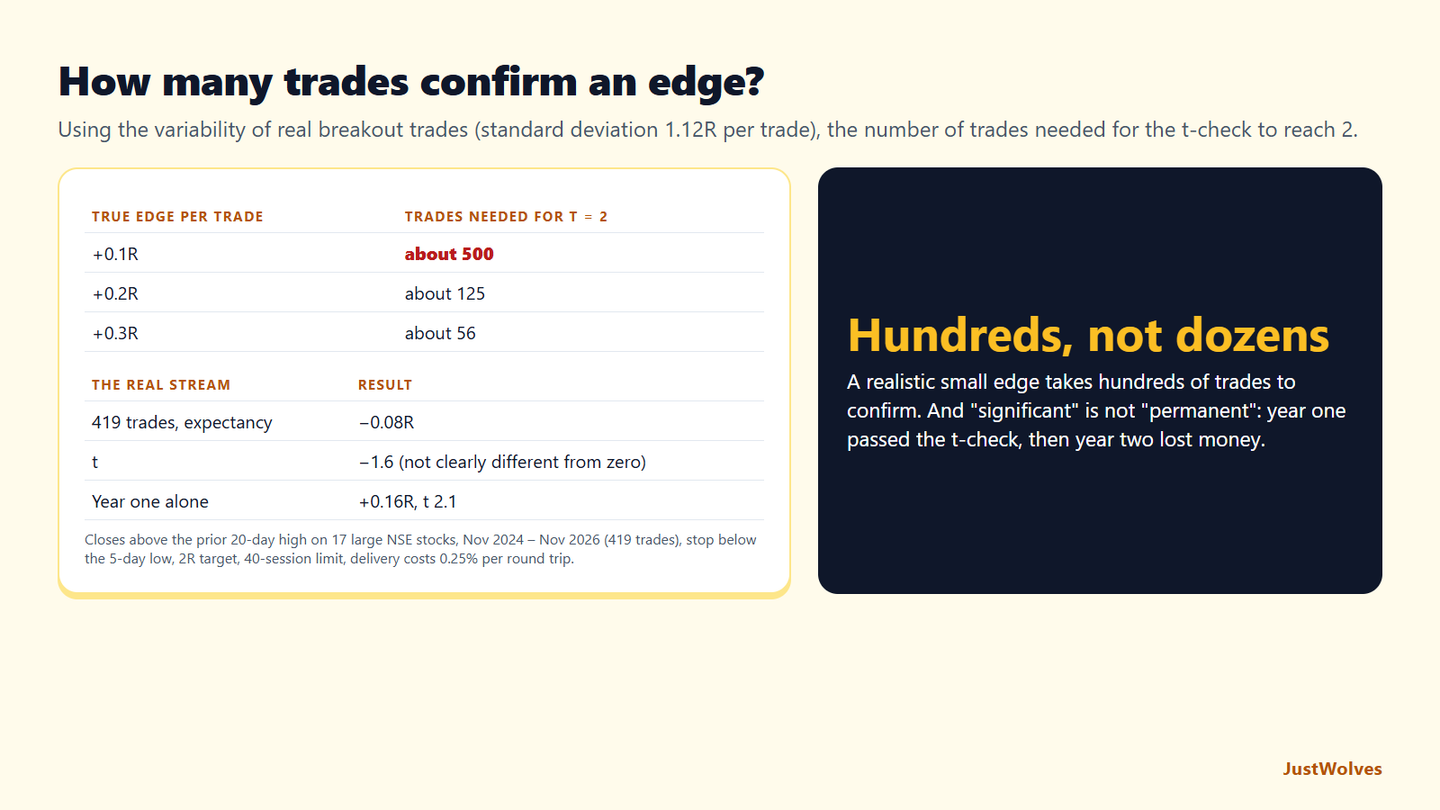
JustWolves applied this lesson's t-check to a real record: 419 breakout trades on 17 large NSE stocks from November 2024 to November 2026, after delivery costs. From the variability of those trades we worked out how many trades a strategy with a given true edge would need before the t-value reached 2. We also checked what happened when the same check was applied to a single year, and to 20 rule variants tested on that year.
| True edge per trade | Trades needed for t = 2 |
|---|---|
| +0.1R | about 500 |
| +0.2R | about 125 |
| +0.3R | about 56 |
| Record | Expectancy | t |
|---|---|---|
| All 419 trades | −0.08R | −1.6 |
| Year one only (215 trades) | +0.16R | 2.1 |
| Year two only (204 trades) | −0.34R | −4.5 |
| 20 rule variants on year one | +0.18R average | 11 of 20 above 2 |
Small edges take hundreds of trades. With the variability of real trades, a true edge of +0.1R per trade needs about 500 trades to reach t = 2, and even +0.3R needs more than 50. This is this lesson's sobering point in real numbers: a few months of results almost never confirm or reject a modest edge.
A significant result can still be wrong. The strategy's first year passed the check with t = 2.1. The second year lost money decisively. And when 20 variants were tested on that first year, 11 passed the check, which is the multiple-testing problem in this lesson's professional insight. Significance on one sample, especially after trying many versions, is a much weaker guarantee than it looks.
Correlation makes it worse. As the State Bank of India chart shows, eleven trades can really be two results. The note in this lesson that the t-check is optimistic for clustered trades is not a technicality: in our data, losses clustered by stock and by market phase. Count independent episodes, use stop rules written in advance, and review monthly rather than after every streak.
Common Mistakes
- Judging a strategy on one month. Most monthly swings are noise.
- Looking at one metric. Always read expectancy, drawdown and trade count together.
- Evaluating a strategy you're not following. Low adherence means you're measuring your execution.
- Changing the strategy after every drawdown. You never collect enough trades on any version.
- Ignoring decay. A steady gap below the backtest deserves investigation.
Professional Insight
Quantitative traders are wary of any result that came from trying many variations, because the best of many random tests will look good by chance. The more versions of a strategy you tried before settling on one, the more trades you should demand before trusting it, and the more weight you should give to out-of-sample and live results over the backtest you optimised.
Risk Considerations
- The t-check assumes independent trades; real results cluster, so treat it as optimistic.
- Markets change: a strategy can lose its edge without any obvious signal; stop rules protect you.
- Small accounts feel sample-size limits most, because a long test takes time. Keep risk small while evidence builds.
Important Terminology
| Term | Meaning |
|---|---|
| Standard deviation | How widely individual trade results vary around their average. |
| t-value | Expectancy compared with its uncertainty; around 2 suggests the edge is unlikely to be pure luck. |
| Strategy decay | Live performance falling below backtested performance over time. |
| Regime change | A shift in market behaviour, such as volatility or trend, that affects a strategy. |
| Stop rule | A pre-set condition for pausing, reducing or ending a strategy. |
How do I know if my trading strategy works?
Measure expectancy after costs, drawdown and losing streaks over a large sample of trades taken according to the rules, and compare live results with your backtest.
How many trades do I need to evaluate a strategy?
At least 100 for a rough view. For a small edge, several hundred may be needed before it can be distinguished from luck.
Why are my live results worse than my backtest?
Costs, slippage, missed or late entries, rule-breaking and changing markets all reduce live results. Some decay is normal; a widening gap needs investigating.
When should I stop trading a strategy?
When it breaches stop rules you set in advance, such as drawdown well beyond the backtest's worst or negative expectancy over a meaningful sample with good adherence.
What is a good profit factor?
Above 1.0 after costs is profitable; many traders consider 1.3–2.0 healthy over a large sample. Very high values on few trades are usually luck.
How many trades do I need to know if my strategy has an edge?
It depends on the edge and the variability. With the variability of real NSE breakout trades, a +0.1R edge needs about 500 trades to reach a t-value of 2, a +0.2R edge about 125, and +0.3R about 56.
Can a statistically significant backtest still fail?
Yes. In our NSE data, a breakout rule's first year passed the t-check with t = 2.1, and the following year lost 0.34R per trade with the same rules. Markets change, and testing many variants makes chance results look significant.
Practical Exercise
Build a scorecard for one strategy you trade or have backtested.
Your task
Step 1: Fill in the scorecard
Trades, expectancy after costs, profit factor, win rate, average win and loss, maximum drawdown, longest losing streak and adherence.
Step 2: Calculate a t-value
Find the standard deviation of your R results (a spreadsheet's STDEV function) and compute expectancy ÷ (SD ÷ √n).
Step 3: Estimate the trades needed
Roughly (2 × SD ÷ expectancy)² trades to reach t ≈ 2.
Step 4: Write three stop rules
For drawdown, expectancy and adherence.
Check Your Understanding
Expectancy +0.2R, standard deviation 1.4R, 49 trades. What is the t-value?
Related Lessons
Previous: Demo Trading, Paper Trading and Forward Testing. Next: Building a Professional Trading Plan (12.04.05).