
Trailing Stops and Taking Profit: How to Manage a Winning Trade
JustWolves is an educational platform and is not a SEBI-registered investment advisor. Trading financial instruments involves significant risk of loss and may not be suitable for all investors. Past performance is not indicative of future results. Read our full disclaimer →
What you'll learn
- Every exit method trades off how often you get paid against how much you get paid
- A fixed target is simple and keeps your planned risk-reward
- Partial profits plus a breakeven stop smooth results but cap the best trades
- Trailing stops let strong trends pay, at the cost of giving back some open profit
- Choose one exit plan before entry and judge it over many trades, not one
In this article · 15 sections
Entries get the attention, but exits decide the result. Close a winner too early and your average win shrinks; hold it too long and you hand back profit you had. There is no perfect exit. There are a handful of sensible methods, each with a clear trade-off, and the job is to choose one before you enter and then follow it.
What You Will Learn
- The main ways to take profit: fixed targets, partials and trailing stops
- When and how to move a stop to breakeven, and the cost of doing it too early
- Three ways to trail a stop: swing structure, ATR and a moving average
- How to compare exit plans honestly, across winning and losing scenarios
Before You Start
Read Stop-Loss Orders and Risk-Reward Ratio first. You should be able to place a structural stop, measure trades in R, and identify swing lows and highs on a chart.
The Exit Trade-Off
Any exit method answers two questions: how often will a trade end in profit, and how big will those profits be? Methods that take profit early win more often but cap the size of wins. Methods that let winners run win less often, because more trades give back their gains, but occasionally catch a very large move.
As lesson 12.01.05 showed, what matters is the combination, expectancy, not either half alone. So the right exit for you is the one that, over many trades, gives the best expectancy you can actually follow without second-guessing.
Method 1: Fixed Target
You set a profit target at a level the chart supports, usually the first obstacle such as a previous swing high or resistance zone, and exit the whole position there. It is simple, easy to backtest and keeps your planned risk-reward intact. Its weakness is that it can never capture more than the target, even when a trend runs much further.
Method 2: Partial Profit and Breakeven
You close part of the position, often half, at a first target such as 1R, then move the stop on the rest to your entry price (breakeven). From that point the trade can't become a full loss.
The cost is subtle. Because half the position is closed at 1R, your best trades earn less. And a stop at breakeven sits where normal pullbacks often reach, so some trades that would have worked are closed at zero. Partials smooth the ride; they don't automatically improve expectancy.
Method 3: Trailing Stops
A trailing stop follows price in your favour and never moves back. Three common ways to trail:
- Swing structure: after each new higher low forms in an uptrend, move the stop just below it. This keeps the stop at levels that mean something on the chart.
- ATR trail (chandelier stop): keep the stop a set multiple of ATR, for example 2–3 × ATR, below the highest price reached. It adapts to volatility automatically.
- Moving average: exit when price closes below a chosen moving average, such as the 20-period EMA. Simple, but it lags in sharp reversals.
Trailing stops are how trend traders capture the occasional large move that pays for many small losses. The price is giving back part of every winner, since the stop always sits some distance behind the high.
Real Prices: Fixed Target vs Trailing Stop
The scenarios in this lesson compare two plans on a hypothetical trade. The chart below compares them on a real one: a Maruti Suzuki breakout in August 2025, exited once at a fixed 2R target and once with a trailing stop.
Real prices: a fixed 2R target vs a trailing stop on the same trade, Maruti Suzuki, August–October 2025
Step 1 of 4
The trade
Maruti Suzuki closes at ₹12,840 on 12 August 2025, above its 20-day high, on twice average volume. The stop goes below the previous five days' low with a small buffer, ₹12,312: 1R is about ₹528.
- What to observe
- Two traders take the same entry and stop.
- Condition
- Plan A: exit at a fixed 2R. Plan B: no target; trail.
Step by Step: A Trailing Plan
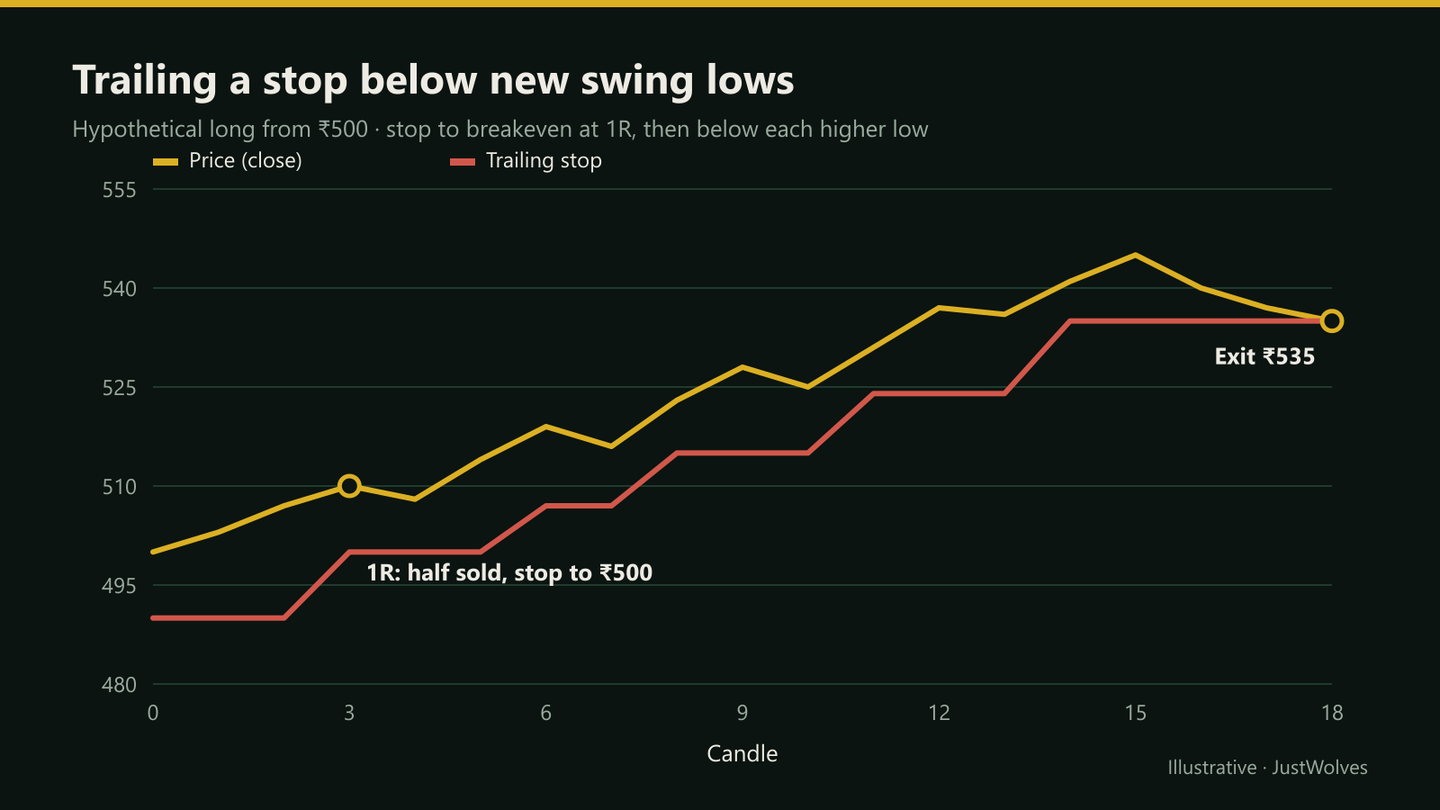
Partial + swing trail on a long trade
Step 1: Enter with a structural stop
Buy 100 shares at ₹500 with the stop at ₹490: 1R = ₹10, risk ₹1,000.
Step 2: Take a partial at 1R
When price reaches ₹510, sell 50 shares (+₹500) and move the stop on the rest to ₹500, breakeven.
Step 3: Trail below new swing lows
Each time price makes a higher low and then a new high, move the stop just below that higher low.
Step 4: Never move it back
A trailing stop only moves in the trade's favour.
Step 5: Exit when the trail is hit
The remaining shares close when price pulls back through the latest trailing stop.
Comparing Two Exit Plans Across Three Outcomes
Same trade, two plans. Plan A exits all 100 shares at a fixed 2R target (₹520). Plan B sells half at 1R, moves the stop to breakeven and trails the rest as above.
| What price does | Plan A: fixed 2R target | Plan B: half at 1R, trail the rest |
|---|---|---|
| Trends to ₹545, trail exits at ₹535 | +₹2,000 | +₹2,250 |
| Reaches ₹510, then falls to ₹490 | −₹1,000 | +₹500 |
| Falls straight to the stop | −₹1,000 | −₹1,000 |
| Reaches ₹520 exactly, then reverses to ₹500 | +₹2,000 | +₹500 |
Neither plan wins every row. Plan B protects you when a trade reaches 1R and fails (row 2), and does a little better in a strong trend (row 1). Plan A does far better when price reaches its target and turns (row 4). Which is better overall depends on how your setups usually behave, and only a journal or backtest of many trades can answer that.
Exit Methods on Real Trades: Our Test
JustWolves tested this lesson's exit methods on the same 419 real entries: every close above the prior 20-day high on 17 large NSE stocks from November 2024 to November 2026, with a structural stop below the previous five days' low. Only the exit changed: fixed 2R and 3R targets; half at 1R with the stop moved to breakeven and the rest at 3R; trailing under the 20-day average with breakeven at +0.5R or +1R; and trailing three ATR below the highest close. All trades were closed after 40 sessions if still open, and delivery costs of 0.25% per round trip were included.
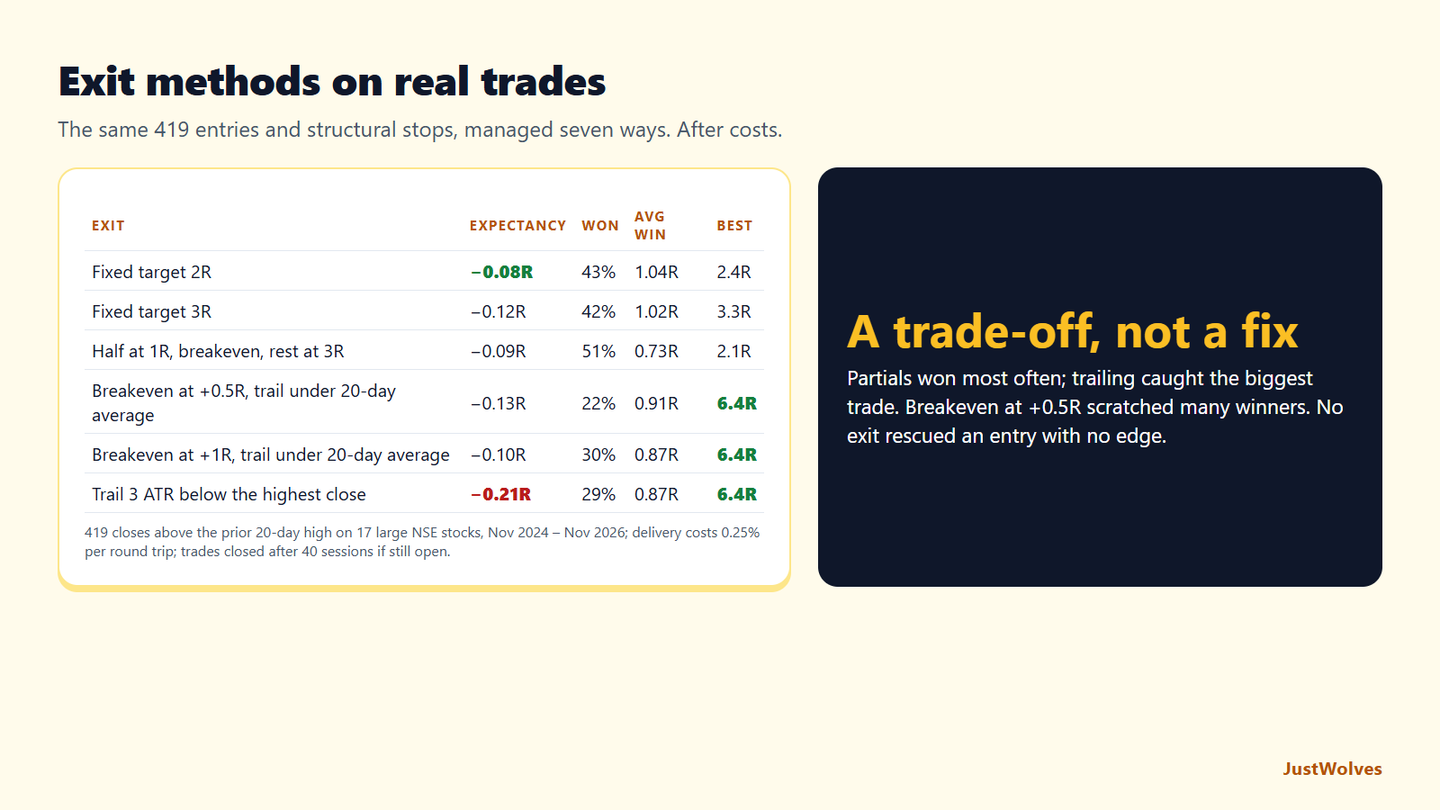
| Exit | Expectancy | Won | Average win | Best trade |
|---|---|---|---|---|
| Fixed target 2R | −0.08R | 43% | 1.04R | 2.4R |
| Fixed target 3R | −0.12R | 42% | 1.02R | 3.3R |
| Half at 1R, breakeven, rest at 3R | −0.09R | 51% | 0.73R | 2.1R |
| Breakeven at +0.5R, trail under the 20-day average | −0.13R | 22% | 0.91R | 6.4R |
| Breakeven at +1R, trail under the 20-day average | −0.10R | 30% | 0.87R | 6.4R |
| Trail 3 ATR below the highest close | −0.21R | 29% | 0.87R | 6.4R |
| Half at 1R + breakeven, rest trailed 3 ATR | −0.16R | 36% | 0.77R | 3.7R |
Every method traded one thing for another, exactly as this lesson's opening section describes. Taking half at 1R gave the highest win rate, 51%, but the smallest average win. Trailing under the 20-day average caught the biggest single trade, the +6.4R Maruti move above, but won far less often. Fixed targets sat in between.
Breakeven too early cost money. Moving the stop to breakeven at +0.5R turned many trades that would have worked into scratches: only 22% won, and the method did worse than moving it at +1R. This is the callout in this lesson, measured on real trades.
No exit fixed the entry. These breakout entries had a slightly negative edge after costs, and every exit method left them slightly negative. Exits change the shape of results, how often you win and how big the wins are, but not whether the entries have an edge. The professional insight in this lesson applies: use your journal's records of how far trades go in your favour to choose the exit that fits your setups.
Common Mistakes
- Switching plans mid-trade. Deciding to 'let it run' after entry usually means giving back profit without a rule.
- Trailing too tightly. A stop just under the last candle gets hit by ordinary noise.
- Moving the stop to breakeven at the first tick of profit. It turns many winners into scratches.
- Judging an exit method on one trade. Every method looks wrong on some trades.
- Taking profit early but letting losers run. This combination reliably destroys expectancy.
Advanced Insight
Your journal can tell you which exit suits your setups. Record the maximum favourable excursion (MFE), the furthest each trade went in your favour, and the maximum adverse excursion (MAE), the furthest against you. If many losers first reached 1R, partials or a breakeven rule may help. If winners routinely run far past your target, a trail may add expectancy. If many trades touch your stop by a few rupees and then work, your stops may be too tight.
Risk Considerations
- Gaps can jump past a trailing stop just as they can past an initial stop.
- Costs rise with partial exits: two exits mean two sets of charges, which matters on small intraday trades.
- Overnight risk grows as a trend trade stays open longer; see lesson 09.04.03 on gap risk for swing traders.
Important Terminology
| Term | Meaning |
|---|---|
| Fixed target | A preset exit price for the whole position. |
| Partial profit | Closing part of a position at a first target while the rest stays open. |
| Breakeven stop | A stop moved to the entry price so the remaining trade can't lose. |
| Trailing stop | A stop that moves with price in your favour and never moves back. |
| Chandelier stop | An ATR trailing stop set a multiple of ATR below the highest price reached. |
| MFE / MAE | Maximum favourable / adverse excursion: how far a trade went for and against you before exit. |
What is a trailing stop-loss?
A stop that follows price as a trade moves in your favour, staying a set distance or structure level behind it, and never moves back. It locks in part of the profit while giving the trade room to continue.
When should I move my stop to breakeven?
After the trade has made real progress, commonly once it reaches 1R or forms a new higher low above entry. Doing it immediately turns many good trades into scratches.
Should I take partial profits?
It's a valid choice that smooths results and protects you when trades reach 1R and fail. It also reduces your gains on your best trades, so test it on your own setups.
What is the best take-profit strategy?
There isn't a single best one. A fixed target at the first obstacle is a good default; trailing stops suit trend-following setups. Choose using your journal or backtest, not one memorable trade.
How far should a trailing stop be?
Far enough to sit outside normal noise: below the most recent higher low, or around 2–3 × ATR below the high for an ATR trail.
Is a trailing stop better than a fixed target?
Not on average in our test. On 419 real NSE breakout trades, trailing under the 20-day average averaged −0.10R per trade against −0.08R for a fixed 2R target, but it caught the largest single winner, +6.4R.
Practical Exercise
Pick five past trades from your journal, or five recent swing setups on any daily chart.
Your task
Step 1: Record entry, stop and the price path
Note the highest price reached and where price eventually went.
Step 2: Apply Plan A
Exit everything at 2R if reached, otherwise at the stop.
Step 3: Apply Plan B
Half at 1R, stop to breakeven, trail the rest below new swing lows.
Step 4: Total both plans in R
Which did better on these five? Note why.
Step 5: Decide what more data you need
Five trades can't settle it. Plan how you'll test the better-looking method on at least 50 more.
Check Your Understanding
Buy 100 shares at ₹500, stop ₹490. Sell 50 at ₹510, then the rest is stopped at breakeven. Result?
Related Lessons
Previous: Stop-Loss Orders. Next: Maximum Drawdown and Recovery (12.02.03). See also Win Rate, Expectancy and Profit Factor for comparing exit plans properly.