
FOMO, Revenge Trading and Overtrading: Spotting and Stopping the Three Account Killers
JustWolves is an educational platform and is not a SEBI-registered investment advisor. Trading financial instruments involves significant risk of loss and may not be suitable for all investors. Past performance is not indicative of future results. Read our full disclaimer →
What you'll learn
- FOMO, revenge trading and overtrading all add trades that aren't part of your plan
- Unplanned trades usually have zero or negative expectancy, and costs make them worse
- Adding marginal trades can erase the profit from your good ones
- Each has early warning signs you can learn to notice
- Trade caps, loss limits and a written setup list are the most effective defences
In this article · 15 sections
Most traders don't lose money because their best setups fail. They lose it on the trades they never planned to take: the chase after a big candle, the trade to win back this morning's loss, the fifteenth trade of a quiet afternoon. FOMO, revenge trading and overtrading are three routes to the same problem, and this lesson shows how much they cost and how to stop them.
What You Will Learn
- What FOMO, revenge trading and overtrading look like in practice
- Why unplanned trades usually lose money, using expectancy
- The early warning signs of each
- Practical rules and limits that prevent them
Before You Start
Read Trading Psychology: The 5 Mental Traps and Win Rate, Expectancy and Profit Factor. You should understand expectancy and how trading costs reduce it.
FOMO: Fear of Missing Out
FOMO is the urge to enter a move because it's happening without you. A stock jumps 4% on news, Bank Nifty breaks out, a group chat fills with profit screenshots, and suddenly not being in the trade feels worse than the risk of being in it.
FOMO trades share three features: they're entered late, after much of the move; they have no planned stop, or a stop far away; and they're often larger than normal because the trader feels certain. Late entry means poor risk-reward, and the move often pulls back right after the crowd arrives.
Warning signs
- You're looking at a chart because of someone else's post, not your watchlist.
- You can't say where your stop would go.
- The reason for the trade is 'it's moving'.
Real Prices: A FOMO Entry
The FOMO scenario in this lesson is general. The chart below shows a real one: buying Larsen & Toubro the morning after a 4% jump in March 2026, in the middle of a falling market, and what happened over the next two weeks.
Real prices: buying the morning after a 4% jump, Larsen & Toubro, March 2026
Step 1 of 4
The jump
After falling from about ₹4,420 to ₹3,760 in early March 2026, Larsen & Toubro jumps 4.0% on 5 March to close at ₹4,038.7. It feels like the bottom is in and the rebound has started.
- What to observe
- The classic FOMO trigger: a big green day you are not in.
- Condition
- No setup, no level, no stop: just a move.
Revenge Trading
Revenge trading is taking trades to recover a loss quickly. After a loss, the mind treats the money as something to win back today rather than as a normal cost of trading. Revenge trades are usually rushed, larger than normal and outside your setup rules, and each further loss strengthens the urge. It's the main way an ordinary losing morning becomes a day that damages the account.
Warning signs
- You're thinking about the money lost, not the next setup.
- You increase size 'just this once' to recover.
- You feel angry, rushed or desperate to be right.
Overtrading
Overtrading means taking more trades than your strategy actually produces. It comes from boredom, from wanting to 'make the day count', from treating screen time as productivity, or from lowering the bar for what counts as a setup. Unlike FOMO and revenge trading, it can feel calm and rational, which makes it harder to notice.
Warning signs
- Your trade count is far above your backtest's average.
- You're taking 'B' and 'C' setups you'd normally skip.
- You trade because you have time, not because the market has offered a setup.
Why Extra Trades Cost So Much
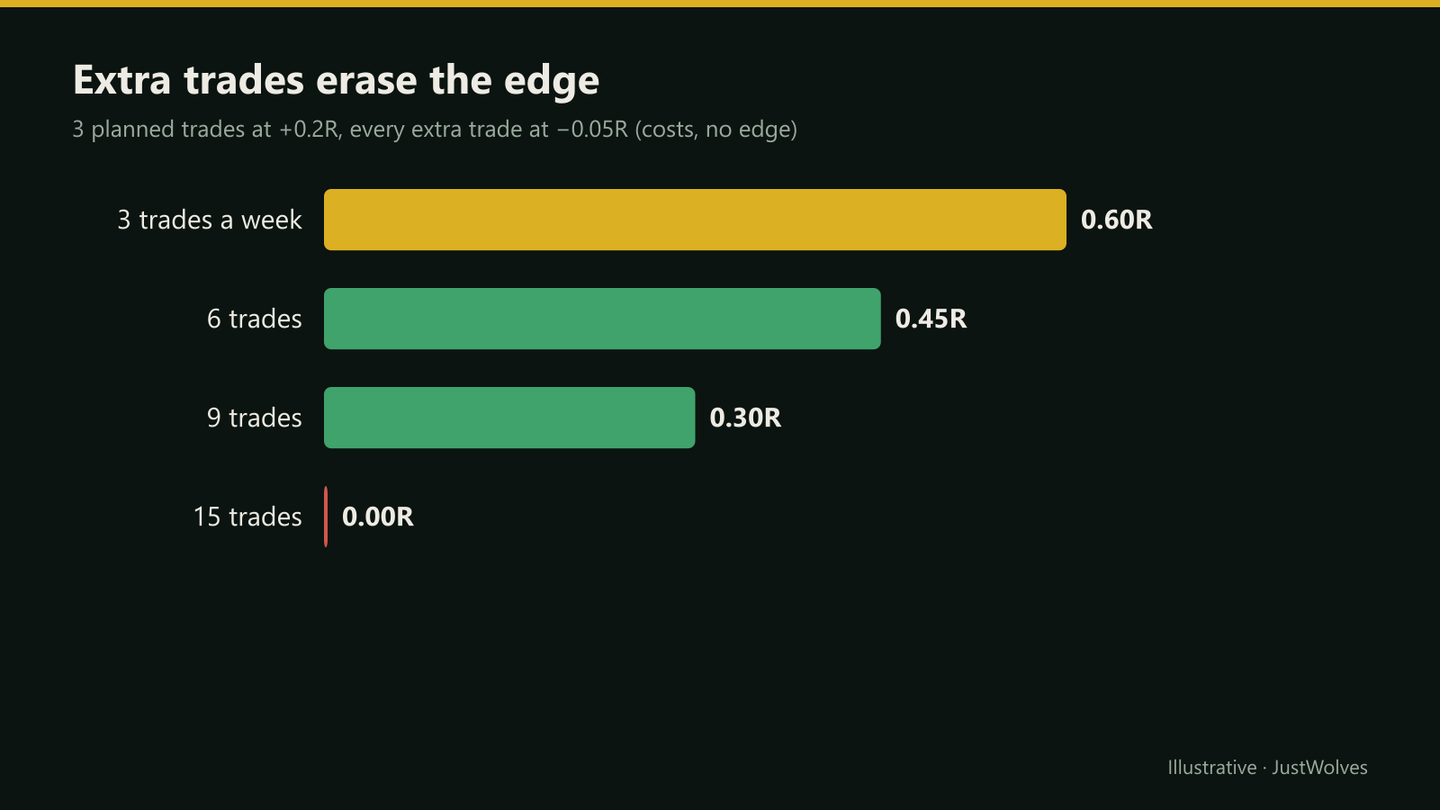
Suppose your real setups appear about three times a week and have an expectancy of +0.2R each after costs. That's about +0.6R a week.
Unplanned trades have no proven edge. Even generously assuming they break even before costs, costs of around 0.05R per trade make each one worth −0.05R. Every extra trade chips away at the profit your good setups earned.
| Trades per week | Planned (+0.2R each) | Unplanned (−0.05R each) | Total |
|---|---|---|---|
| 3 | +0.60R | 0 | +0.60R |
| 6 | +0.60R | −0.15R | +0.45R |
| 9 | +0.60R | −0.30R | +0.30R |
| 15 | +0.60R | −0.60R | 0.00R |
Step by Step: Rules That Stop All Three
Your defences
Step 1: Write a setup list
Define the few setups you trade, each with entry, stop and target rules. If a trade isn't on the list, it isn't taken.
Step 2: Cap the number of trades
Set a daily or weekly maximum close to what your backtest produces, for example 4 a day for an intraday strategy.
Step 3: Set a daily loss limit
For example 3R, plus a rule to stop after two or three consecutive losses (lesson 12.02.04).
Step 4: Add a distance rule against chasing
If price is more than a set distance from your planned entry, for example 0.5R, you don't enter.
Step 5: Cool down after a loss
Wait a fixed time, such as 15 minutes, before the next trade after any loss.
Step 6: Mute the noise
No social media or trading groups during your session.
Practical Example
Anil's intraday backtest produces about 2–3 setups a day at +0.15R each. His journal for last month shows he averaged 9 trades a day. Separating them: his planned setups made about +8R over the month; his other trades, mostly entered after losses or because a stock was 'running', lost 23R. His strategy was fine; the extra trades turned a profitable month into a −15R one.
He sets three rules: a maximum of 4 trades a day, stop after two straight losses, and no trade unless it's on his written setup list. His trade count drops to 3 a day, and his monthly results move back towards what his backtest suggested.
Chasing and Overtrading on Real Data: Our Test
JustWolves measured two of this lesson's account killers on real NSE prices. FOMO: on 17 large stocks from November 2024 to November 2026, we bought at the next morning's open after every day the stock rose 4% or more, and recorded the next 5 and 10 days, including the worst dip along the way. Overtrading: on a 5-minute scalping stream on 10 NSE stocks (August to November 2026), we compared results by trade number within each session, first trade, second, and so on, after costs of 0.06% per round trip.
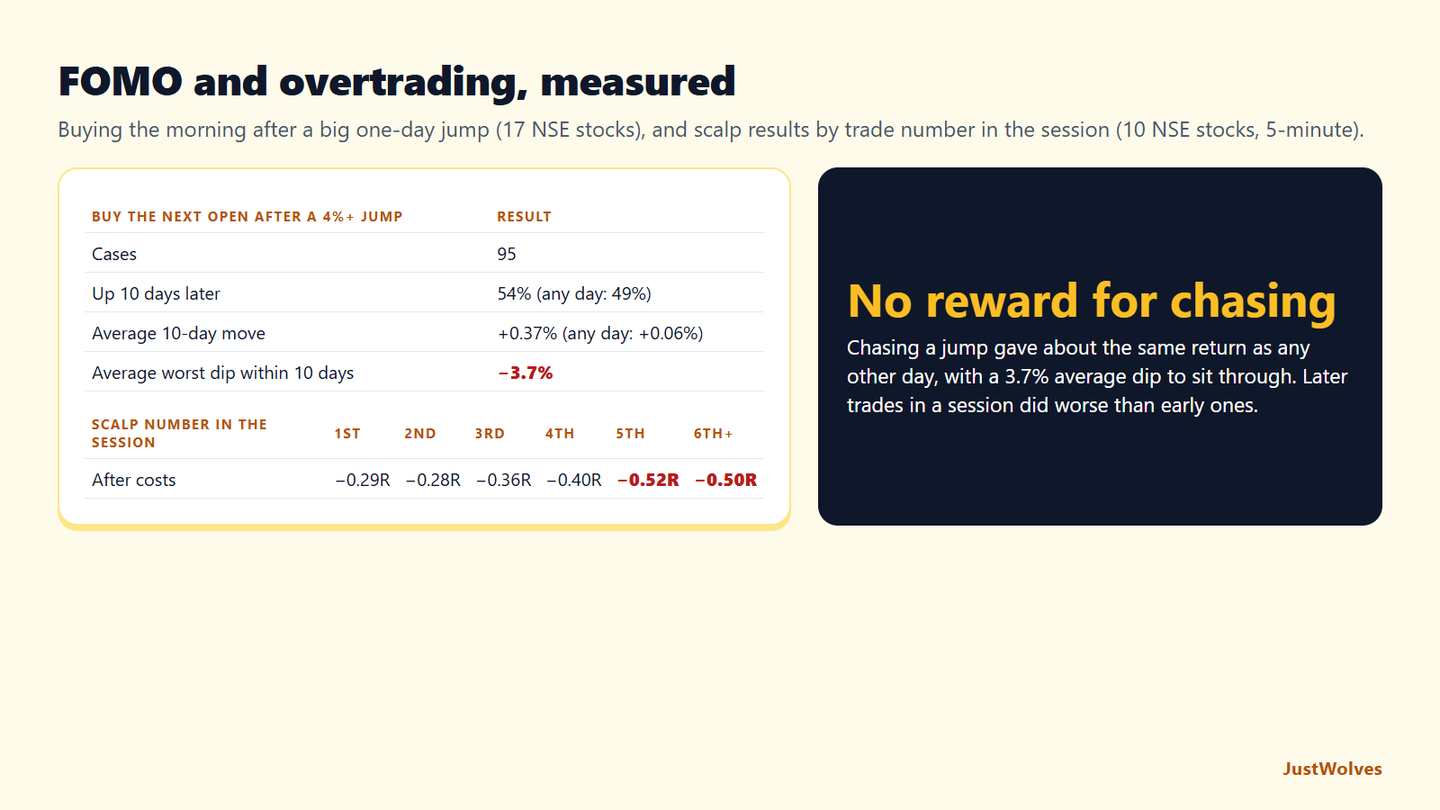
| Measure | After a 4%+ jump | Any day |
|---|---|---|
| Cases | 95 | – |
| Up 10 days later | 54% | 49% |
| Average 10-day move | +0.37% | +0.06% |
| Average worst dip within 10 days | −3.7% | – |
| Trade in the session | 1st | 2nd | 3rd | 4th | 5th | 6th+ |
|---|---|---|---|---|---|---|
| Average result | −0.29R | −0.28R | −0.36R | −0.40R | −0.52R | −0.50R |
FOMO paid almost nothing for a lot of risk. Buying the morning after a 4% jump gave a 10-day result very close to buying on any ordinary day: a few tenths of a percent, well within normal variation. But the buyer typically sat through a 3.7% dip first, and in a falling market, as with Larsen & Toubro above, much more. Without a planned stop, as this lesson notes, that dip is where FOMO turns into revenge trading.
Later trades were worse. In the scalping stream, the first two trades of a session averaged about −0.28R after costs; by the fifth and later trades, about −0.5R. The method was the same all day; what changed was the context of the extra trades, taken later, in choppier conditions, after the clean setups had passed. This is the overtrading pattern this lesson describes in Anil's example.
The cost section of this lesson applies directly: every extra trade paid full costs whatever its quality, so a trade count well above the strategy's natural frequency was the clearest sign of a problem.
Common Mistakes
- Confusing activity with progress. More trades isn't more opportunity if most have no edge.
- Breaking the rule 'just this once'. Exceptions are how all three habits start.
- Not tagging unplanned trades. Without separating them in your journal, you can't see their cost.
- Trading through emotional states. Anger and euphoria both increase unplanned trades.
- Watching social media while trading. It's the most reliable FOMO trigger.
Professional Insight
Professional desks often measure trades taken versus setups identified. A trader whose count consistently exceeds their setup frequency gets reviewed, whatever their P&L that month, because the behaviour predicts future losses even when it hasn't caused them yet. You can apply the same check to yourself each week.
Risk Considerations
- Costs scale with trade count: brokerage, taxes and slippage are paid on every trade, whatever its quality.
- Larger size often accompanies FOMO and revenge trades, so their losses are bigger than normal ones.
- F&O makes all three more dangerous because leverage and fast-moving premiums magnify each impulsive decision.
Important Terminology
| Term | Meaning |
|---|---|
| FOMO | Fear of missing out: entering a move impulsively because it's happening without you. |
| Revenge trading | Trading to recover a loss quickly, usually rushed and oversized. |
| Overtrading | Taking more trades than your strategy genuinely produces. |
| Setup list | A written list of the only trade setups you will take, with their rules. |
| Cool-down period | A fixed wait after a loss before the next trade. |
| Unplanned trade | Any trade not on your setup list or outside its rules. |
What is revenge trading?
Taking impulsive trades to win back a recent loss, usually larger and less careful than normal. It's one of the most common reasons a small loss becomes a large one.
How do I stop FOMO in trading?
Trade only from a written setup list, never enter far beyond your planned level, and close social media and trading groups during market hours.
How many trades a day is overtrading?
It depends on your strategy. If you take noticeably more trades than your backtest or written setups produce, you're overtrading.
Why do I keep trading after losses?
Because the mind treats the loss as something to recover today. A daily loss limit, a consecutive-loss rule and a cool-down period break that loop.
Is overtrading really that costly?
Yes. Every trade pays costs, and trades without an edge lose those costs on average. Enough of them can wipe out the profit from good setups.
Is it worth buying a stock after a big one-day jump?
Not on our data. Across 95 cases of a 4% or larger jump in 17 large NSE stocks, buying at the next open gave a 10-day result close to an ordinary day's, with an average dip of 3.7% along the way.
How can I tell if I am overtrading?
Compare your trade count with how often your strategy produces setups. In our NSE scalping data, results got worse with each additional trade in a session, from −0.29R for the first to about −0.5R for the fifth and later, after costs.
Practical Exercise
Split your last month of trades into two groups and price the difference.
Your task
Step 1: Tag every trade
Planned (on your setup list, within the rules) or unplanned (FOMO, revenge, boredom, chasing).
Step 2: Total each group in R
Include costs.
Step 3: Compare trade counts
How many trades per day or week were planned, and how many weren't?
Step 4: Set your caps
Choose a daily trade cap and a consecutive-loss rule based on what you found.
Check Your Understanding
What do FOMO, revenge trading and overtrading have in common?
Related Lessons
Previous: Fear and Greed in Trading (12.03.02). Next: Patience and Realistic Expectations. See also Daily and Weekly Loss Limits.