
What Is Candle Range Theory? The Model We Teach
JustWolves is an educational platform and is not a SEBI-registered investment advisor. Trading financial instruments involves significant risk of loss and may not be suitable for all investors. Past performance is not indicative of future results. Read our full disclaimer →
What you'll learn
- Candle Range Theory (CRT) treats one candle's high and low as a range that later candles react to
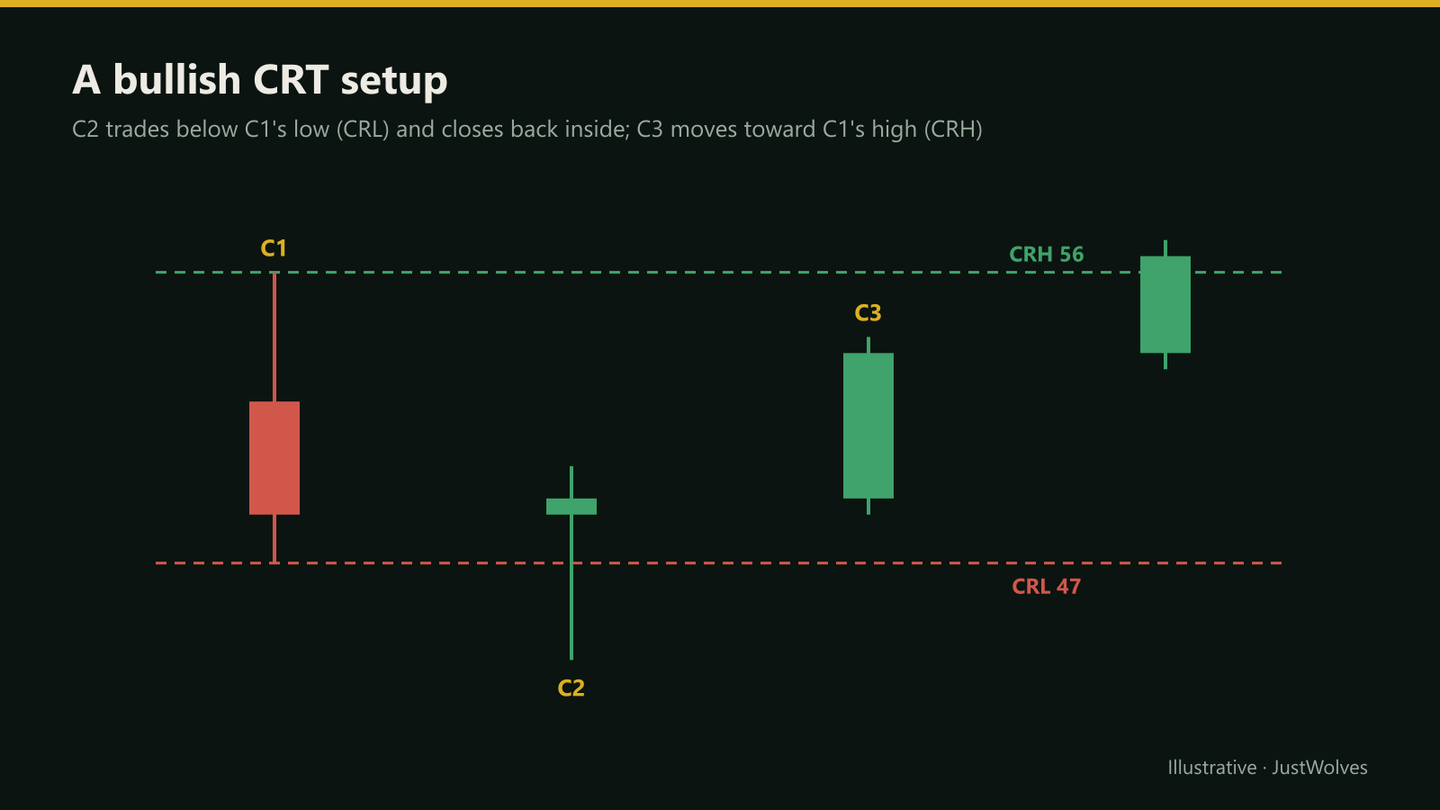
- The model taught here has three candles: C1 sets the range, C2 sweeps beyond it and closes back inside, C3 is the entry candle
- A valid setup needs C2 to close back inside C1's range; a close outside is a breakout, not a CRT setup
- Common practice is a stop beyond C2's wick and a first target at the opposite side of C1's range
- CRT is defined differently by different educators; this course teaches one specific, rule-based version
In this article · 16 sections
Candle Range Theory, usually shortened to CRT, is a way of reading price action through the range of a single candle. The high and low of one candle become reference levels; the next candles either respect them, break them, or briefly push through and snap back. This course teaches one specific, rule-based version of CRT built on three candles. This first lesson defines that model precisely, so every later lesson builds on the same foundation.
What You Will Learn
- What CRT is and the idea behind it
- The three-candle C1/C2/C3 model
- The rule that makes a setup valid
- How CRT relates to other price action methods
Before You Start
CRT builds on the idea of liquidity sweeps. Read Liquidity Sweeps from the SMC course and Price Rejection from the Price Action course first.
The Idea Behind CRT
Every candle has a high and a low. Traders place orders around those levels: stop-losses for short positions above the high, stop-losses for long positions below the low, and breakout orders on both sides. Those clusters of orders are a form of liquidity.
When price moves just beyond a candle's high or low, it triggers those orders. If the move fails and price closes back inside the range, the traders who were stopped out or who bought the breakout are now on the wrong side. CRT tries to identify those failed breaks and trade the move back across the range.
The Three-Candle Model
| Candle | Role | Rule |
|---|---|---|
| C1 | Range candle | Its high is the candle range high (CRH); its low is the candle range low (CRL). Its colour doesn't matter. |
| C2 | Sweep candle | Trades beyond CRH or CRL, then closes back inside C1's range. |
| C3 | Entry candle | The candle after C2, where entries are taken if C2 is valid. |
The Validity Rule
- Bullish CRT: C2 trades below CRL and closes above CRL (back inside C1's range).
- Bearish CRT: C2 trades above CRH and closes below CRH.
- Not CRT: C2 never trades beyond the range, or closes outside it. A close outside is a breakout, not a failed break.
The rule is binary and is judged only after C2 has closed. A C2 that is below CRL halfway through its period may still close below it.
See It on Real Candles
The schematic above shows the idea. Here is the same model on actual EUR/USD data. Step through it with Next. The chart only shows candles that had closed at each step, so you see exactly what a trader would have seen at the time.
A real bullish CRT: EUR/USD 4H, 5 October 2026
Step 1 of 6
Context: a sharp drop, then a pause
Early in the Monday session, one 4H candle covered about 80 pips from high to low as EUR/USD dropped, then price stabilised. Ranges after a sharp move are where CRT setups often appear.
- What to observe
- A large move followed by smaller, overlapping candles.
- Condition
- Nothing to trade yet.
Stops and Targets in Brief
Common practice in this model is a stop beyond the extreme of C2's sweep (below its low for a bullish setup) and a first target at the opposite side of C1's range (CRH for a bullish setup). Later lessons cover entries, stops, targets and invalidation in detail.
Why the Close Is the Whole Model
Beginners often think CRT is about the wick, because the sweep is the dramatic part. The close is what matters. A candle that trades below CRL tells you sell stops were triggered, nothing more. Only the close tells you whether those sell orders found enough buyers to push price back inside the range.
- C2 closes back inside: the break failed. The sellers who sold the breakdown and the longs who were stopped out are now on the wrong side of a range that held. That is the condition CRT tries to exploit.
- C2 closes outside: the break held, at least for that candle. Treating it as a CRT setup means betting against a level that just broke, which is a different, and riskier, trade.
This is also why CRT is always judged on the timeframe of the candles you are using. A 15-minute chart might show a candle closing below the 4H CRL halfway through C2, while the 4H candle itself still closes back inside. The 4H close decides.
Where CRT Fits
CRT isn't a new phenomenon; it's a precise way of describing a failed breakout of a candle's range. You'll recognise links to liquidity sweeps, pin bars and range trading. CRT's contribution is the strict three-candle definition, which makes setups easy to identify and test.
On its own, a CRT pattern says only that a break failed. Module 08.03 shows how to combine it with trend and key levels, which is where its usefulness mostly comes from.
What Our Data Shows About CRT
Most CRT material shows only winning examples. To give you a realistic picture, JustWolves tested the exact model in this course on real market data. Method: every valid 4H CRT setup on EUR/USD, GBP/USD, USD/JPY and gold from mid-May to mid-November 2026 (845 setups). 4H candles were aligned to the 5 pm New York close, and each trade was followed on hourly candles for two 4H candles (C3 and C4). The stop was beyond C2's extreme with a small buffer, the target was the opposite side of C1, and any trade still open after C4 was closed at market. If a stop and a target fell inside the same hourly candle, we counted a loss. Spreads and commissions were not included.
| Market | Setups | Winning trades | Average result per trade |
|---|---|---|---|
| EUR/USD | 171 | 50% | +0.02R |
| GBP/USD | 221 | 45% | −0.07R |
| USD/JPY | 238 | 46% | −0.04R |
| Gold | 215 | 38% | −0.15R |
| All four | 845 | 45% | −0.06R |
Three conclusions follow from these numbers:
- Mechanically, CRT was roughly break-even before costs. An average of −0.06R across 845 trades is too close to zero to call the pattern either good or bad on its own. What it clearly is not is a reliable edge.
- Costs decide the result for forex. Typical 4H CRT stops on the currency pairs were only 10–15 pips. A 1–1.5 pip spread therefore costs about 0.1R per trade, which is larger than the pattern's average result. Gold's wider stops made costs much less important.
- Only about a third of setups reached the opposite side (CRH for bullish, CRL for bearish) before breaking C2's extreme. The rest stalled or failed. Treating CRT as a prediction that price will cross the range is the most expensive misunderstanding of the model.
The practical message is not that CRT is useless. It is that the pattern alone is not enough. Its value has to come from where it appears, what the higher timeframe is doing, and how the trade is managed, which is what the rest of this course covers. We also tested several simple filters. See CRT Entry Models for the results by entry method.
Explore EUR/USD 4H candles yourself
Loading historical candles…
Practical Example
Hypothetically, a Nifty 1-hour candle (C1) runs from 24,040 to 24,110. The next hour (C2) falls to 24,015, below the CRL of 24,040, but closes at 24,055, back inside the range. That's a valid bullish CRT.
Nisha considers buying at the start of C3 near 24,055, with a stop below C2's low at 24,005 and a first target at the CRH of 24,110: 50 points of risk for 55 points of potential reward. Whether she takes the trade depends on the trend and the level, covered later in the course. Costs matter here too: on one Nifty futures lot, round-trip charges are about 14 points at discount-broker rates, which turns 50 points of risk and 55 of reward into roughly 64 and 41 net.
The Psychology of a Simple Model
CRT's appeal is its simplicity: three candles, one rule. That simplicity is also its trap. Because the rule is so clear, every valid C2 feels like a signal, and a trader who takes them all will experience long runs of small losses, as the study above shows.
Two habits protect you. First, accept that most valid setups should be skipped. A model that finds a valid pattern several times a week on one 4H chart is a scanner, not a strategy. Second, keep a log of every valid C2, including the ones you do not trade. Over time, your own log will show you which contexts are worth acting on, and which are just pattern-matching.
Common Mistakes
- Acting before C2 closes.
- Calling a close outside the range a CRT setup.
- Trading every pattern without context.
- Mixing different CRT definitions without noticing.
- Assuming CRT predicts a reversal rather than describing a failed break.
Professional Insight
The value of a precise model is that it can be tested. Experienced traders who use CRT typically log every valid C2 in their markets, then study which contexts produced the best follow-through, rather than relying on the pattern alone.
Risk Considerations
- Failed breaks can turn into real breakouts after C3.
- Wide C2 wicks mean wide stops.
- News can overwhelm any candle range.
Important Terminology
| Term | Meaning |
|---|---|
| CRT | Candle Range Theory. |
| C1 | The range candle. |
| CRH / CRL | Candle range high / candle range low: C1's high and low. |
| C2 | The candle that sweeps beyond the range and closes back inside. |
| C3 | The entry candle after a valid C2. |
What is Candle Range Theory?
A price action method that uses one candle's high and low as a range and looks for the next candle to break beyond it and close back inside.
What are C1, C2 and C3?
C1 is the range candle, C2 sweeps beyond the range and closes back inside, and C3 is the entry candle.
What makes a CRT setup valid?
C2 must trade beyond CRH or CRL and then close back inside C1's range.
Does CRT work on all timeframes?
The pattern appears on all timeframes. Higher timeframes produce fewer, larger setups; lower ones produce more noise.
Is CRT the same as a liquidity sweep?
It's a specific, candle-based version of a liquidity sweep and failed breakout.
Is Candle Range Theory profitable?
Not on its own, in our test. Traded mechanically on 845 real 4H setups across four markets in 2026, CRT was roughly break-even before costs and negative after typical forex spreads. Any edge has to come from context, selection and trade management.
What timeframe is best for CRT?
The 4-hour and daily charts are most common because each candle represents a meaningful session. Below one hour, ranges become small relative to spreads and noise.
Practical Exercise
Find valid C2s.
Your task
Step 1: Open a 1-hour chart
Nifty or a major currency pair.
Step 2: Scan candle pairs
For each candle, check whether the next one swept its high or low.
Step 3: Apply the rule
Mark only those where the sweeping candle closed back inside.
Step 4: Count
How many valid setups appeared in a week?
Check Your Understanding
In CRT, C1's high is called:
Related Lessons
Next: The Reference Candle: Range High and Range Low. See also Liquidity Sweeps.