
Liquidity Sweep vs Displacement: Reversal or Continuation?
JustWolves is an educational platform and is not a SEBI-registered investment advisor. Trading financial instruments involves significant risk of loss and may not be suitable for all investors. Past performance is not indicative of future results. Read our full disclaimer →
What you'll learn
- A sweep trades through a level and closes back; a displacement closes strongly beyond it
- Two questions classify most cases: did the body close beyond the level, and was a fair value gap left?
- Judge on a consistent timeframe; 1-minute charts are too noisy for classification
- After a sweep, traders look for reversal entries; after a displacement, for pullback entries in the move's direction
- Session highs and lows are common places to see both
In this article · 17 sections
Price reaches an obvious high where you know stops are resting. It pokes through. Is this the start of a breakout, or a sweep about to reverse? This is one of the most common decisions in SMC trading, and getting it wrong is expensive either way. This lesson gives you a simple, rule-based way to classify what happened, and what to do next in each case.
What You Will Learn
- The definitions of a liquidity sweep and a displacement
- A two-question test to tell them apart
- Which timeframe to classify on
- Entry models after each, and where they tend to occur
Before You Start
Read Equal Highs and Equal Lows first. Fair value gaps are covered fully in lesson 02.03.02; here you only need to recognise one.
Liquidity Sweep
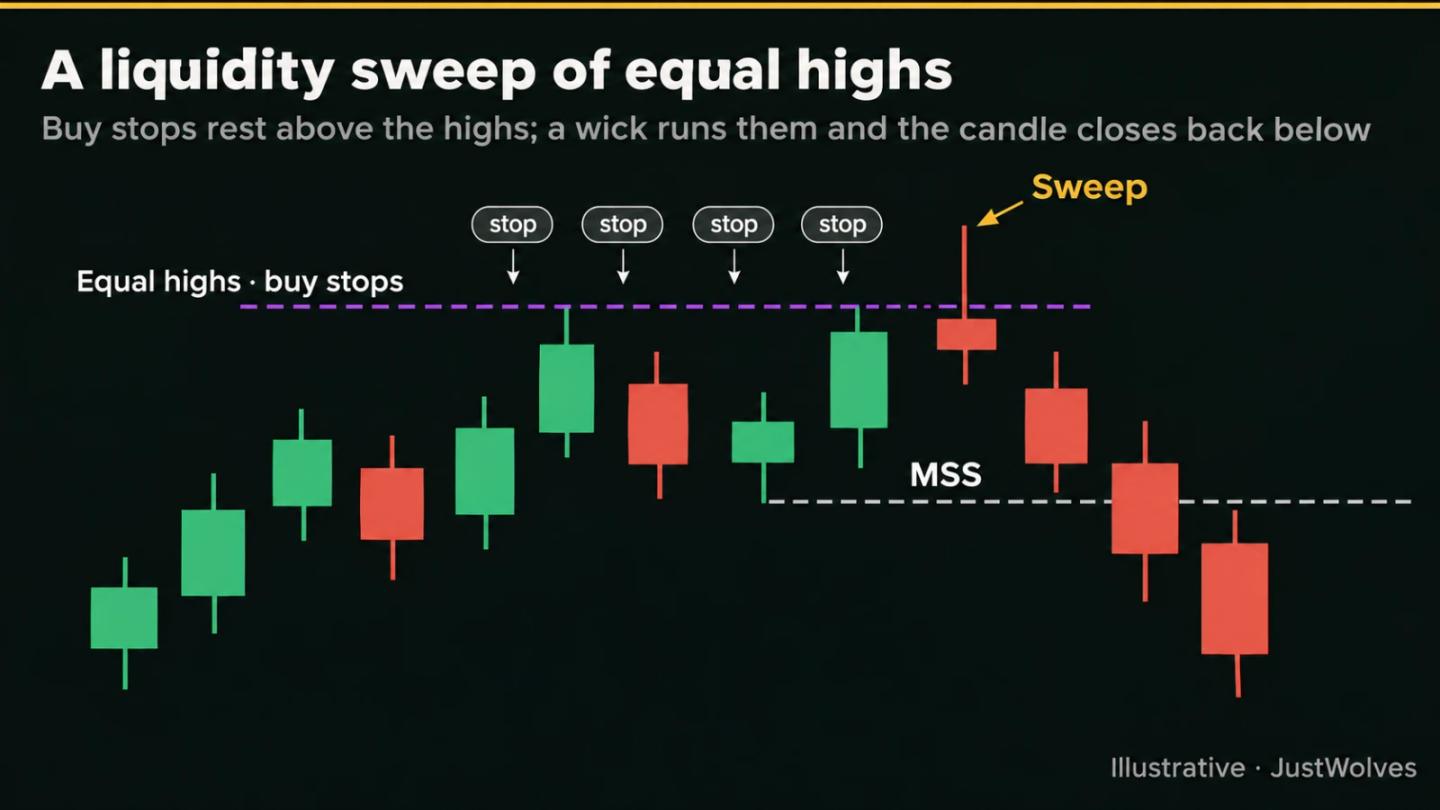
A liquidity sweep (also called a grab or stop run) is a move through an obvious level that fails to hold: price trades beyond the high or low, triggering the orders resting there, then closes back on the original side. The classic sign is a long wick beyond the level with the candle body closing back inside the range.
The orders beyond the level were filled, but they weren't enough to sustain a move. Traders read that failure as a sign the move may reverse.
Why Orders Cluster at Obvious Levels
The "liquidity" in a liquidity sweep is not a metaphor. Studies of real currency order books at dealing banks have found that take-profit orders bunch at round numbers, while stop-loss buy orders cluster just above round numbers and stop-loss sell orders just below. When those stop-loss orders are triggered, they tend to extend the price move briefly, producing short "cascades".
That is the observable mechanism behind a sweep. Price trades into a cluster of stops; executing them pushes price briefly further; and if there is no new buying or selling behind the move, it runs out of fuel and reverses. The evidence shows clustering and cascades. It does not show that anyone deliberately "hunts" stops, so treat that popular explanation as a story, not a fact.
Displacement
A displacement is the opposite: a strong, one-sided move that closes decisively beyond the level, usually with large-bodied candles and at least one fair value gap left behind. It suggests the move has genuine momentum and may continue.
The Two-Question Test
Ask in order
Step 1: Question 1: did the candle body close beyond the level?
No (only the wick went through) → treat it as a sweep. Yes → go to question 2.
Step 2: Question 2: did the move leave a fair value gap?
Yes → displacement, continuation more likely. No → an unconvincing break; wait for more evidence.
| Sweep | Displacement | |
|---|---|---|
| Body close beyond the level | No: wick only | Yes: decisive close |
| Fair value gap | Not required | Yes |
| Reading | Orders filled, no follow-through | Momentum through the level |
| Bias | Reversal | Continuation |
| Typical entry | After a lower-timeframe CHoCH or MSS | On a pullback into the fair value gap |
Step through both scenarios below. They start from the same level and identical conditions. Only the candle closes after the break tell them apart, which is the whole point of the test.
Scenario 1: a sweep of the Asian high
Step 1 of 5
Liquidity above a clear high
The Asian session leaves a high at 1.0868, retested at 1.0867. Breakout traders' buy-stop orders and short sellers' protective stops cluster just above highs like this.
- What to observe
- Two highs within a pip of each other: an obvious level.
- Condition
- Mark the level before London opens.
Scenario 2: a displacement through the same high
Step 1 of 5
Same level, same setup
The Asian high is again at 1.0868. Before the break, you cannot know whether it will be swept or broken. That is why we classify only afterwards.
- What to observe
- Identical starting point to Scenario 1.
- Condition
- No prediction, just a plan for both outcomes.
Which Timeframe?
The answer depends on the timeframe you judge it on: a 1-minute candle may close beyond a level while the 5-minute candle closes back inside. Pick one classification timeframe and stick to it. For intraday trading, the 5-minute and 15-minute charts are common choices; the 1-minute chart is too noisy to classify reliably.
If you classify on the 15-minute chart, a sweep confirmed there is more meaningful than one seen only on the 1-minute chart.
Real Case: When the 1H Test Gets It Wrong
The timeframe rule is easiest to understand on real data. On 10 November 2026, the London open produced a move in EUR/USD that passed both questions on the 1-hour chart, and then reversed within the hour. Step through it below.
Real case: EUR/USD 1H, 9–10 November 2026, when the test is wrong
Step 1 of 6
The Asian range
Between 20:00 and midnight New York time (01:00–05:00 UTC), EUR/USD traded in a 10-pip range, 1.12208 to 1.12309.
- What to observe
- A tight overnight range.
- Condition
- Mark the range high and low.
This example is uncomfortable, and that is why it is here. Applying the test correctly on the 1-hour chart gave the wrong answer. Three takeaways:
- Higher timeframes filter noise. Judged on 4-hour candles, the event was a textbook sweep: one candle with a long upper wick that closed back below the highs. If your classification timeframe had been 4H, you would never have considered buying.
- Watch what happens next. A genuine displacement leaves a gap that price respects. If the very next candle closes back through the gap, the displacement has failed, and that failure is itself information.
- No method is always right. The test improves your odds of classifying correctly; it does not guarantee it. Position size and stops exist for exactly these cases.
Explore EUR/USD around the 10 November 2026 sweep
Loading historical candles…
Where Sweeps and Displacements Happen
The most commonly watched levels are session highs and lows, such as the Asian range high and low, and the previous day's high and low. If the Asian range is defined as 8 pm to midnight New York time, that's roughly 5:30–9:30 am IST in the northern summer and 6:30–10:30 am IST in winter.
A common intraday pattern is for London or New York to trade through one side of the Asian range early in the session. Whether that becomes a sweep or a displacement is exactly what the two-question test helps you judge.
Trading After Each
- After a sweep: wait for a lower-timeframe CHoCH or MSS in the reversal direction, enter on a pullback, stop beyond the sweep extreme, target the opposite liquidity, such as the other side of the session range.
- After a displacement: wait for price to retrace into the fair value gap, enter there with a stop beyond the gap or beyond the origin of the move, target the next liquidity in the displacement's direction.
- If unclear: no trade. An ambiguous break is a reason to wait, not to guess.
Practical Example
Sweep. Hypothetically, EUR/USD's Asian high is 1.0868. At the London open a 15-minute candle spikes to 1.0876 but closes at 1.0863. The next candle also fails to close above 1.0868. Kiran classifies a sweep, waits for a 5-minute bearish MSS, and sells at 1.0865 with a stop at 1.0880, targeting the Asian low at 1.0835.
Displacement. On another day, a 15-minute candle closes at 1.0889, 21 pips above the Asian high, leaving a gap between 1.0871 and 1.0878. Kiran classifies a displacement and places a buy limit at 1.0876, inside the gap, with a stop at 1.0864, targeting the previous day's high at 1.0912.
Types of Liquidity Sweeps
Sweeps are often described as one thing, but they come in a few recognisable forms. Knowing which one you are looking at helps you judge how much weight to give it.
| Form | What it looks like | How traders read it |
|---|---|---|
| Single-candle wick | One candle wicks beyond the level and closes back inside | The cleanest form; the test classifies it immediately |
| Two-candle sweep | One candle closes beyond the level, the next closes back inside | Ambiguous on its own timeframe; often a single wick on the next timeframe up |
| Equal highs / lows sweep | Price runs a pair or cluster of nearly equal highs or lows | Considered stronger because more stops are resting there |
| Session sweep | London or New York trades through the Asian range or previous day's high/low | Common intraday pattern; see Session Liquidity in the ICT course |
| Failed displacement | A displacement whose gap is closed through by the next candle | Treated as a sweep in hindsight; exit any breakout position |
The Psychology of a Sweep
Sweeps are painful precisely because they catch two groups of traders at once. Breakout traders buy the move above the high and are trapped when it fails. Traders who sold earlier with a stop just above the high are stopped out right before price moves in their favour. Both experiences are frustrating, and both tend to cause the same bad reaction: moving stops further away, or refusing to trade breakouts at all.
The healthier response is structural. Place stops beyond the levels where everyone else's stops sit, not exactly at them, and size the position for that wider stop. Wait for the candle close before classifying. And accept that being swept occasionally is a normal cost of trading near obvious levels, not evidence that the market is targeting you personally.
Common Mistakes
- Classifying before the candle closes.
- Switching timeframes until you get the answer you want.
- Shorting every wick above a level in a strong uptrend.
- Chasing displacements at market instead of waiting for a pullback.
- Forcing a trade when the test gives no clear answer.
Professional Insight
Discretionary traders have long distinguished 'failed breaks' from 'clean breaks' using exactly these clues: where the candle closed, and how decisively. SMC's vocabulary adds the fair value gap as a visible measure of decisiveness. The underlying idea, judge the break by the close, is decades old.
Risk Considerations
- Sweeps can be followed by a second push that breaks the level for real.
- News releases create sweeps and displacements that reverse unpredictably.
- Stops beyond sweep extremes can be wide; size for them.
Important Terminology
| Term | Meaning |
|---|---|
| Liquidity sweep | A move through a level that closes back on the original side. |
| Displacement | A strong move that closes decisively beyond a level, often leaving a fair value gap. |
| Fair value gap | A gap between the wicks of the first and third candles in a three-candle move. |
| Classification timeframe | The one timeframe you use to judge sweeps and displacements. |
| Asian range | The high and low formed during the Asian session. |
What is a liquidity sweep?
A move through an obvious high or low that triggers resting orders and then closes back on the original side, suggesting a possible reversal.
What is displacement in trading?
A strong, one-sided move that closes decisively beyond a level, usually leaving a fair value gap, suggesting continuation.
How do I tell a sweep from a breakout?
Check whether the candle body closed beyond the level and whether a fair value gap formed. Wick-only breaks suggest a sweep.
Which timeframe should I use?
Choose one, often the 5- or 15-minute chart for intraday trading, and classify only on closed candles there.
Where do sweeps usually happen?
At obvious levels such as session highs and lows, equal highs and lows, and the previous day's high and low.
Is a liquidity sweep the same as a stop hunt?
They describe the same price action: a move through an obvious level that triggers stops and then reverses. "Stop hunt" implies someone deliberately targets the stops. Research shows stops do cluster at obvious levels and that triggering them can extend moves briefly, but it does not prove deliberate targeting.
Which timeframe is best for classifying sweeps?
For intraday trading, the 15-minute and 1-hour charts are common choices, and the 4-hour chart filters out much more noise. The real EUR/USD example on this page shows a move that looked like a displacement on 1H but was a clear sweep on 4H. Pick one timeframe and stay with it.
What should I do if a displacement immediately reverses?
Treat it as failed. If the next candle closes back through the fair value gap the displacement left, exit any position taken in the breakout direction. Some traders then look for a reversal setup, as with a sweep.
Practical Exercise
Classify 20 breaks of the Asian range.
Your task
Step 1: Mark the Asian range
On 20 different days for one pair.
Step 2: Find the first break
During London or New York.
Step 3: Classify it
Using the two-question test on the 15-minute chart.
Step 4: Record what happened
Did price reach the other side of the range, or continue?
Check Your Understanding
A wick goes above the high but the body closes below. This is:
Related Lessons
Previous: Equal Highs and Equal Lows. Next: Inducement and Fake Breakouts. See also Market Structure Shift vs CHoCH.