
Market Imbalance and Displacement: Using Price Inefficiency
JustWolves is an educational platform and is not a SEBI-registered investment advisor. Trading financial instruments involves significant risk of loss and may not be suitable for all investors. Past performance is not indicative of future results. Read our full disclaimer →
What you'll learn
- An imbalance is a price range that a fast, one-sided move passed through with little two-way trading
- On a chart it appears as large candles whose neighbouring wicks don't overlap
- SMC expects price to revisit many imbalances, but not all, and not on a schedule
- Imbalances are often used as targets, and the zone at their base as entry context
- Treat 'the market must rebalance' as a tendency to test, not a law
In this article · 16 sections
Sometimes price moves so fast that it skips through a range of prices with hardly any trading on the way. Smart Money Concepts calls the area left behind an imbalance, or an inefficiency, and treats it as unfinished business that price often returns to. This lesson explains what imbalances look like, how they differ from the closely related fair value gap, and how traders use them, with realistic expectations.
What You Will Learn
- What a market imbalance is and how to spot it
- The idea of efficient and inefficient price movement
- How an imbalance differs from a fair value gap in practice
- How imbalances are used as targets and entry context
Before You Start
Read Market Structure Shift vs CHoCH first. Displacement, introduced there, is what creates imbalances.
What an Imbalance Looks Like
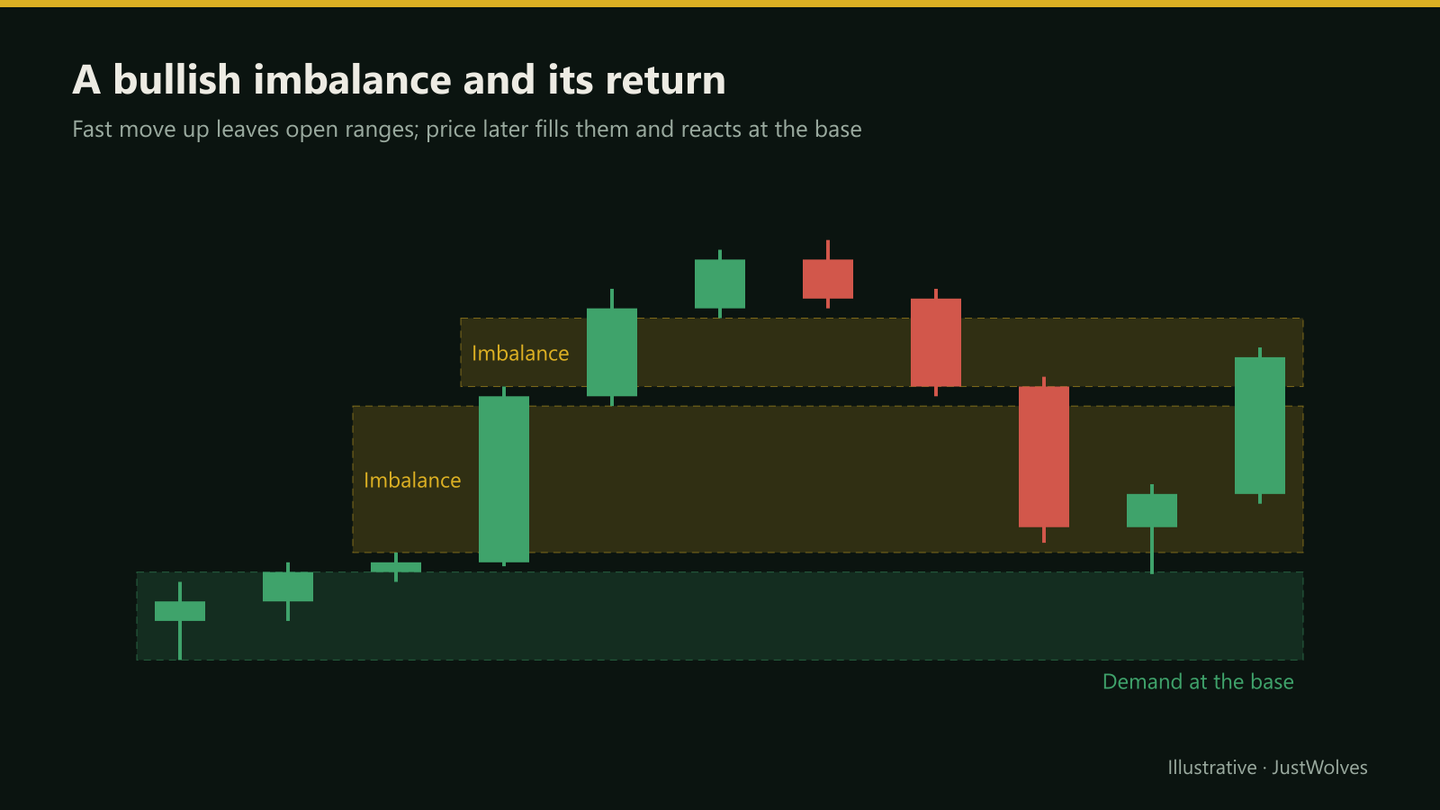
An imbalance is an open price range: one or more large candles in one direction, where the wicks of the candles before and after don't reach back into the bodies. Price traded through that range quickly, so relatively few orders were exchanged there.
A single three-candle version of this is called a fair value gap (lesson 02.03.02). An imbalance is the broader idea: a whole leg of fast movement can leave several gaps stacked together.
Efficient and Inefficient Price
SMC describes price as moving between two states. In efficient movement, each push is followed by a pullback that trades back over the range just covered: buyers and sellers both get to transact. In inefficient movement, price skips over a range in one direction, leaving it largely untraded.
The framework's claim is that inefficient ranges tend to be revisited, as price 'rebalances'. You'll often see this, but not always: strong trends can leave imbalances unfilled for a long time, and some are never revisited. Treat the idea as a tendency you can measure on your own charts.
An Inefficient Leg, Step by Step
The chart below shows a fast rally that leaves two open ranges, and how price rebalances them on the pullback.
An inefficient leg and the imbalances it leaves
Step 1 of 5
A fast, one-directional leg
Three strong candles rally from 1.0832 to 1.0878 with almost no overlap between them.
- What to observe
- Each candle's low stays above the high two candles earlier.
- Condition
- The leg is inefficient.
Imbalance vs Fair Value Gap: How They're Traded
| Fair value gap (lesson 02.03.02) | Imbalance (this lesson) | |
|---|---|---|
| What it is | A gap in one three-candle sequence | A wider inefficient range, possibly several gaps |
| Common expectation | Price reacts from inside the gap | Price may fill the whole range |
| Common entry | In the gap, often at its 50% level | At the demand or supply zone at the base of the move |
| Common use | Entry zone | Target, or context for a deeper entry |
Nearer and Farther Imbalances
When there are several unfilled imbalances in the same direction, many SMC traders treat the nearer ones as waypoints and the farthest one, nearest the origin of the move, as the more significant level. It's the same logic as the extreme order block in lesson 02.02.05: price often travels through nearer zones before reacting. It's a planning preference, not a rule; nearer imbalances sometimes hold.
Using Imbalances as Targets
Once you're in a trade, the next unfilled imbalance in your direction is a logical first target, because price frequently trades back into such ranges. It gives you a specific, chart-based reason for the target instead of an arbitrary number of pips.
Measuring Imbalance Consistently
To use imbalances in a testable way, define them the same way every time. A simple rule: an imbalance is the space between the high of one candle and the low of the candle two later (for a rally), and it only counts if it is at least a third of an average candle on that timeframe. Smaller gaps are filled almost immediately and add clutter without adding information.
Using Imbalances for Entries
Bullish example
Step 1: Identify the imbalance
Mark open ranges between wicks in the move up.
Step 2: Mark the base
The demand zone where the move started, below the imbalance.
Step 3: Wait for the return
Let price trade back through the imbalance.
Step 4: Look for a reaction at the base
A lower-timeframe CHoCH or MSS from the demand zone.
Step 5: Enter with a defined stop
Stop below the demand zone; first target the top of the imbalance or the prior high.
Practical Example
Hypothetically, after a bullish CHoCH on the 1-hour EUR/USD chart, the breakout leg left open ranges between 1.0832 and 1.0861. The base of the move, the demand zone, sits at 1.0815–1.0828.
Sunita doesn't buy the first touch of the imbalance at 1.0860. Price trades down through it over the next session and reaches 1.0826, inside the demand zone, where a 5-minute MSS forms. She buys at 1.0829 with a stop at 1.0811, targeting the high at 1.0878: 18 pips of risk for 49 pips of reward.
What Happens After Displacement? Our Test
JustWolves measured what followed large displacement candles on about six months of real 1H data for EUR/USD, GBP/USD, USD/JPY and gold. Displacement candle: a body at least twice the average of the previous 14 candles, closing in the outer quarter of its range (1,441 candles). We asked two questions: did price keep going in the same direction, and did it come back to the candle's midpoint?
| Measure | Displacement candles | All candles (for comparison) |
|---|---|---|
| Price further in the same direction 6 hours later | 49% | 49% |
| Price traded back to the candle's midpoint within 24 hours | 84% | – |
The two results fit together. A displacement candle did not predict continuation: six hours later, price was as likely to be beyond it as behind it. But price came back into the candle, to at least its midpoint, within a day in more than four cases out of five.
That is exactly how this lesson suggests using imbalances: as areas price is likely to revisit, which makes them useful as pullback entries and as targets, not as signals to chase the move. Buying the close of a big candle hoping for follow-through was a coin flip in our data; waiting for the return gave a better price on most occasions.
Common Mistakes
- Buying the first edge of every imbalance.
- Assuming every imbalance will be filled.
- Using candle bodies instead of wicks to define the range.
- Ignoring the timeframe: a 1-minute imbalance means little against a 4-hour trend.
- Treating 'rebalancing' as certain and oversizing.
Professional Insight
Fast, one-directional moves often partially retrace, a behaviour traders have described in many ways long before SMC. The practical value of imbalances lies in giving you concrete, visible levels for targets and pullback entries. Judge them by how they behave on your instruments, not by the theory.
Risk Considerations
- Strong trends can leave imbalances unfilled for weeks.
- Full fills to the base mean wider stops and fewer fills.
- News-driven gaps behave less predictably.
Important Terminology
| Term | Meaning |
|---|---|
| Imbalance | A price range passed through quickly with little two-way trading. |
| Inefficiency | Another name for an imbalance. |
| Efficient price | Movement where pullbacks trade back over each range. |
| Fill / rebalance | Price returning into an imbalance. |
| Base | The zone where the fast move started. |
What is an imbalance in trading?
A price range that a fast, one-sided move passed through with little two-way trading, visible as candles whose neighbouring wicks don't overlap.
Is an imbalance the same as a fair value gap?
Closely related. A fair value gap is a three-candle imbalance; 'imbalance' can describe a wider inefficient range.
Does price always fill imbalances?
Not always, but often. In our test of 1,441 large 1H displacement candles, price came back to the candle's midpoint within 24 hours 84% of the time. Strong trends can leave imbalances open for much longer.
How do I use imbalances?
As logical targets for open trades, and as context for entries at the base of the move once price returns.
Which imbalances matter most?
Many traders prioritise imbalances on higher timeframes and those farthest along the path of a pullback, nearest the origin of the move.
Is a displacement candle a signal to enter?
Not on its own. In our data, price was further in the same direction six hours after a displacement candle only 49% of the time, the same as after any candle. Waiting for a pullback into the imbalance usually gave a better price.
Which timeframe should I use to find imbalances?
Use the timeframe you trade, and check the next higher one for context. Imbalances on a higher timeframe usually matter more because they represent larger moves, while very small imbalances on low timeframes appear constantly and are mostly noise.
Practical Exercise
Measure how often imbalances are revisited.
Your task
Step 1: Find 20 imbalances
On 1-hour charts of one pair.
Step 2: Track each
Revisited within 5 days? Partly or fully filled?
Step 3: Note reactions
Did price react inside, or at the base?
Step 4: Summarise
What share were revisited in your sample?
Check Your Understanding
An imbalance is best described as:
Related Lessons
Previous module: Advanced Inducement. Next: Fair Value Gap. See also Liquidity Sweep vs Displacement.