
Inducement and Fake Breakouts in SMC
JustWolves is an educational platform and is not a SEBI-registered investment advisor. Trading financial instruments involves significant risk of loss and may not be suitable for all investors. Past performance is not indicative of future results. Read our full disclaimer →
What you'll learn
- In SMC, inducement is a price move that looks like a clear signal and draws traders in before reversing
- A fake breakout usually follows four phases: orders build up, a convincing break, brief follow-through, then reversal
- Common types occur at support and resistance, at range edges and against established trends
- Traders who are right about direction can still be stopped out if their stops sit at the obvious level
- Plan around inducement by waiting for confirmation and placing stops beyond the obvious cluster
In this article · 16 sections
Almost every trader knows the feeling: you buy a clean breakout, price pushes a little further, then reverses straight through your stop. SMC has a name for the setup that causes this: inducement. This lesson explains what SMC means by it, how fake breakouts typically unfold, the three common types, and how to plan your trades so you're less likely to be on the wrong side.
What You Will Learn
- What inducement means in SMC
- The four phases of a typical fake breakout
- Three common types of inducement
- How to plan entries and stops around it
Before You Start
Read Liquidity Sweep vs Displacement first.
What Inducement Means
In SMC, inducement describes price action that looks like a clear trading signal (a breakout, a breakdown, a new trend) and draws traders in, before the market moves the other way. It's closely related to the classical idea of a false breakout or bull and bear trap.
SMC often describes inducement as deliberately engineered by large participants to create the orders they need. That's an interpretation; nobody outside those firms can confirm intent. The useful, testable part is the pattern itself: obvious signals at obvious levels that fail.
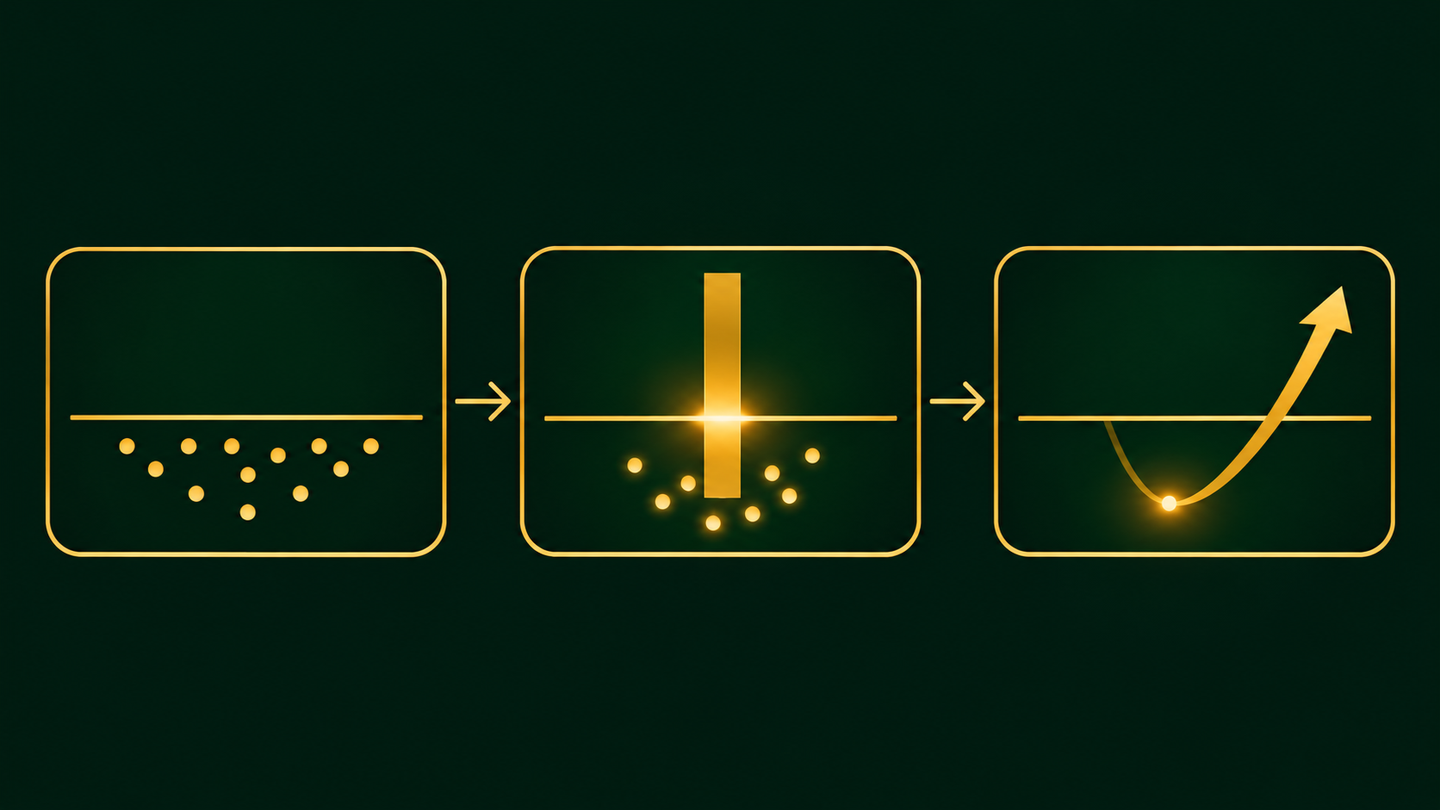
Anatomy of a Fake Breakout
Four phases
Step 1: 1. Orders build up
Around an obvious level, stops and breakout orders accumulate over hours or days.
Step 2: 2. A convincing break
A large candle breaks the level. It looks like confirmation, and breakout traders enter.
Step 3: 3. Brief follow-through
Price holds beyond the level for one to three candles, drawing in more traders.
Step 4: 4. Reversal
Price turns sharply back through the level, stopping out the breakout traders and often accelerating as their stops are hit.
Watch a Fake Breakout Unfold
The interactive chart below follows the worked example in this lesson: support at 150.00, a break that looks like confirmation, and a reclaim that traps the breakdown sellers. Step through it and pay attention to where each group of traders placed their stop. That, more than direction, decides who survives.
Inducement at support: who gets trapped, and how to survive it
Step 1 of 6
Support holds three times
USD/JPY bounces from just above 150.00 three times. Every test adds buyers, and most of them place stops just under the round number.
- What to observe
- A clean, obvious level, and a round number.
- Condition
- The more obvious the level, the more orders sit just beyond it.
Three Common Types
1. Support and resistance inducement
Price breaks an obvious support or resistance level, often at a round number such as 1.1000, then reverses. The more times the level has held and the more obvious it is, the more orders are likely beyond it.
2. Range inducement
After a long consolidation, price breaks one edge of the range, triggering stops and breakout orders, then reverses and often runs to the opposite edge. Ranges can produce a fake break on both sides before a real move.
3. Trend inducement
In an established trend, price breaks a level against the trend, suggesting the trend is ending, and then resumes. This catches traders who were correctly positioned with the trend but whose stops sat just beyond the obvious level, as well as traders who jumped in to call a reversal.
| Type | Where | Who tends to get caught |
|---|---|---|
| Support/resistance | Obvious levels, round numbers | Breakout traders; holders with stops at the level |
| Range | Range high or low after consolidation | Breakout traders on the first side broken |
| Trend | Counter-trend break in a strong trend | Early reversal traders; with-trend traders with tight stops |
Inducement, Sweep and CRT: How They Relate
These three terms describe overlapping ideas, and different educators use them loosely. In this course:
| Term | What it describes | Time frame of the failure |
|---|---|---|
| Liquidity sweep | A move through an obvious high or low that closes back inside | Usually one candle on your classification timeframe |
| Inducement | A move that looks like a trading signal and draws traders in before reversing | Can unfold over several candles, as in the chart above |
| CRT setup | A sweep of one specific candle's high or low that closes back inside that candle's range | Exactly one candle (C2) |
Every CRT setup is a sweep. Not every sweep is inducement, because there may be no convincing "signal" that draws traders in. And not every inducement is a one-candle sweep: the example above needed two closes below support before the reversal. For a real example of equal lows being swept at the New York open, see Equal Highs and Equal Lows.
Why Both Sides Get Stopped Out
In a fake break below support, traders who were long (correctly bullish) are stopped out because their stops sat just below the level. Traders who sold the breakdown are then stopped out as price recovers. Both lost money; one of them was right about direction. The lesson is that stop placement matters as much as direction.
Step by Step: Planning Around Inducement
Before entering a breakout
Step 1: Map the obvious levels
Where would most traders place stops and breakout orders?
Step 2: Check the higher timeframe
A break against the higher-timeframe trend is more suspect.
Step 3: Wait for confirmation
Let one to three candles close beyond the level and hold, or wait for a retest.
Step 4: Or trade the failure
If price reverses back through the level, consider the opposite trade with a stop beyond the false-break extreme.
Step 5: Size for the real stop
Beyond the cluster, not at it.
Practical Example
Hypothetically, USD/JPY has respected support at 150.00 three times over two days. A 1-hour candle breaks to 149.82; breakout sellers pile in. The next candle closes at 149.88, still below. Then price rallies hard and closes at 150.25.
Faisal, who had been bullish, had placed his stop at 149.70, below the obvious cluster, not at 149.95. His long survived. Meanwhile, he notes the failed breakdown as a possible long entry: on the next pullback to 150.05 he adds to his position with a stop at 149.75, below the false-break low.
Warning Signs a Breakout May Be Inducement
No signal identifies fake breakouts in advance with certainty. Hindsight makes every failed break look obvious. These conditions make a break more suspect, and are worth checking before you trade one:
- The level is extremely obvious. Round numbers, triple-tested support, the previous day's high. The more traders who can see it, the more stops and breakout orders sit just beyond it.
- The break is against the higher-timeframe trend. A breakdown in a strong daily uptrend has more buyers waiting below it than a breakdown in a downtrend.
- The breakout candle is small or closes near the level. Genuine breaks tend to close decisively beyond the level and leave a gap behind; weak breaks barely clear it.
- No follow-through on the next candle. A real break usually continues; a break that stalls immediately, or whose next candle closes back inside, is a warning.
- It happens at a session open. The first hour of London or New York frequently trades through overnight highs or lows before choosing a direction.
None of these means "fade the break". They mean "do not chase it". The safer trades are usually after the outcome is visible: a pullback entry after a confirmed break, or a reversal entry after a confirmed failure.
The Psychology of Being Induced
Inducement works because it targets two emotions: fear of missing out when a level breaks, and relief when a stop is placed somewhere that feels "safe", just beyond an obvious level. Both feel rational in the moment.
A useful habit is to ask one question before every breakout entry: if this break fails, where will I be, and how much will it cost? If the honest answer is "trapped, with a stop in the most crowded place on the chart", either wait for the next candle or adjust the plan. The traders who survive inducement are rarely the ones who predicted it. They are the ones whose stops and sizes could absorb it.
Common Mistakes
- Entering the first breakout candle of an obvious level.
- Stops just beyond round numbers and obvious highs or lows.
- Calling every failed move 'inducement' after the fact.
- Assuming every breakout is fake. Many aren't.
- Treating SMC stories about intent as fact.
Professional Insight
Traders have discussed false breakouts and bull and bear traps for as long as charts have existed. Professionals don't try to predict which breakouts will fail; they size breakout trades so failures are affordable, or they wait for the failure and trade the reversal. Both approaches are rules you can test.
Risk Considerations
- Genuine breakouts happen too; fading every break is also a losing approach.
- Wider stops beyond clusters require smaller positions.
- Hindsight: inducement is easy to label afterwards and hard to identify in advance.
Important Terminology
| Term | Meaning |
|---|---|
| Inducement | In SMC, price action that looks like a clear signal and draws traders in before reversing. |
| Fake breakout | A break of a level that quickly reverses. |
| Bull / bear trap | Classical names for false upside and downside breaks. |
| Stop cluster | Many stop orders resting at a similar price. |
| Retest | Price returning to a broken level. |
What is inducement in trading?
In SMC, price action that looks like a clear signal, such as a breakout, and draws traders in before price moves the opposite way.
Is inducement the same as a fake breakout?
Closely related. A fake breakout is the most common form of what SMC calls inducement.
How do I avoid fake breakouts?
Wait for candles to close and hold beyond the level or for a retest, and check that the break agrees with the higher-timeframe trend.
Why does my stop get hit before price reverses?
Often because it sits at an obvious level where many stops cluster. Place it beyond the cluster and reduce position size.
Do institutions deliberately create inducement?
That's SMC's interpretation. It can't be verified from a retail chart, but the pattern of failed obvious breaks can be observed and tested.
Is inducement the same as a bull trap or bear trap?
They describe the same price behaviour. A bull trap is a false break above resistance; a bear trap is a false break below support. SMC uses "inducement" for both, and adds the idea that the move draws traders into positions that fuel the reversal.
How do I avoid being caught by inducement?
Avoid entering the first breakout candle of an obvious level, place stops beyond the obvious cluster rather than inside it, and size the trade for that wider stop. Many traders wait for either a confirmed break with a pullback, or a confirmed failure, before entering.
Practical Exercise
Study 20 breakouts.
Your task
Step 1: Find 20 breaks
Of obvious levels on a 1-hour chart.
Step 2: Classify them
Held, or failed within three candles.
Step 3: Note context
With or against the 4-hour trend; at a round number or not.
Step 4: Compare
Which context produced more failures in your sample?
Check Your Understanding
Inducement in SMC is best described as:
Related Lessons
Previous: Liquidity Sweep vs Displacement. Next: Advanced Inducement. See also Stop-Loss Orders.