
Internal vs External Structure in SMC
JustWolves is an educational platform and is not a SEBI-registered investment advisor. Trading financial instruments involves significant risk of loss and may not be suitable for all investors. Past performance is not indicative of future results. Read our full disclaimer →
What you'll learn
- External structure is the main swing highs and lows that define the trend on your timeframe
- Internal structure is the smaller swings inside one external leg
- Only breaks of external swings change the trend on that timeframe
- Internal breaks can signal the end of a pullback and help time entries
- Confusing the two is a leading cause of premature trend calls
In this article · 15 sections
Look closely at any trend leg and you'll find smaller swings inside it. Should a break of one of those small swings change your view of the trend? SMC answers this with the idea of internal and external structure. Getting the distinction right stops you from calling a reversal every time a pullback wobbles.
What You Will Learn
- What external and internal structure are
- How to tell which swings are external
- Why only external breaks change the trend
- How internal structure helps time entries
Before You Start
Read Market Structure in SMC first.
External Structure
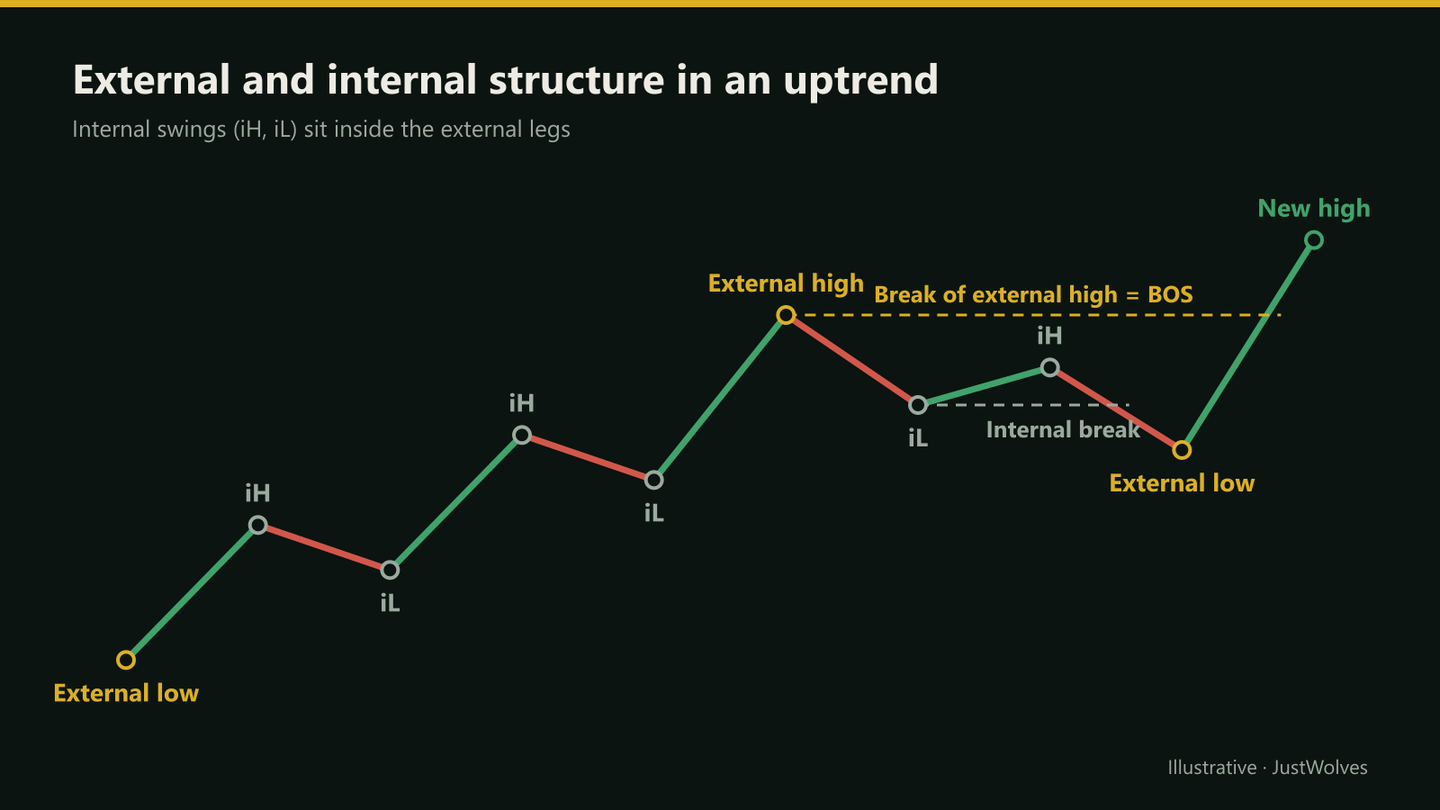
External structure (sometimes called swing structure) is formed by the major swing highs and lows on your chosen timeframe: the points that mark the start and end of each trend leg. In an uptrend, the external high is the last major high and the external low is the low the most recent rally started from. These are the levels that define the trend.
Internal Structure
Internal structure consists of the smaller swings that form *within* one external leg, for example the minor highs and lows during a pullback. On a lower timeframe, internal structure might look like a full trend of its own, but on your chosen timeframe it's just the inside of a leg.
Telling Them Apart
- Ask which swing started the leg. The low that a rally to a new high started from is the external low.
- External highs and lows are the ones that broke structure. In an uptrend, the external high is the one that made a new high; the external low is the one that led to it.
- Zoom out one timeframe. External swings usually remain visible on the next higher timeframe; internal swings often disappear.
- Ignore swings that didn't break anything. A minor high inside a pullback that never exceeded the previous high is internal.
See the Difference Step by Step
The chart below shows the situation that confuses most new SMC traders: a pullback that breaks an internal low inside an intact external uptrend.
An internal break inside an external uptrend
Step 1 of 4
The external leg
Price rallies from the external low at 1.0780 to the external high at 1.0920. That leg defines the trend on this timeframe.
- What to observe
- The swing that started the move and the high it reached.
- Condition
- External structure is bullish.
Why It Matters
Only a break of external structure changes the trend on your timeframe. If an uptrend's pullback breaks an internal low, the uptrend is still intact as long as the external low holds. Calling a reversal on an internal break is one of the most common SMC mistakes.
Internal structure is still useful. When a pullback ends, the first internal break back in the trend's direction (for example, price breaking an internal high during an uptrend pullback) can be an early sign that the pullback is finishing, which helps time an entry while the external low gives a logical stop.
Does an External Break Really Matter More? Our Test
JustWolves tested this on about six months of real 1H candles for EUR/USD, GBP/USD, USD/JPY and gold. We looked only at uptrends (a new 48-hour high within the last 12 hours). External low: the lowest point of the 24 hours before that high, the low the leg started from. Internal low: the latest small swing low above it. We recorded each close below either, and where price was 24 hours later.
| Level broken | Cases | Price lower 24 hours later | Average move |
|---|---|---|---|
| Internal low | 113 | 48% | −0.24 hourly ranges |
| External low | 31 | 52% | −1.23 hourly ranges |
External breaks were followed by average declines about five times larger than internal breaks, which supports this lesson's main point: an external break is the one that matters. But neither type predicted direction reliably; in both cases, price was lower a day later about half the time. The same pattern appeared in our test of ICT's intermediate-term lows.
In practice: an internal break is a pullback signal and a reason for patience; an external break is a reason to take risk seriously, reduce exposure or stop trading in the old direction. Neither is, by itself, a reason to reverse.
Step by Step: Mapping Both
On one timeframe
Step 1: Mark the external swings
The major highs and lows that made the trend's progress.
Step 2: Name the current leg
Are we in an impulse leg or a pullback?
Step 3: Map internal swings in the current leg
Only within the current leg, not across the whole chart.
Step 4: Watch the external levels for trend changes
These define bias.
Step 5: Watch internal breaks for timing
These help with entries inside the trend.
Practical Example
On the 4-hour chart, EUR/USD is in an uptrend with an external low at 1.0780 and an external high at 1.0920. During the pullback, price breaks an internal low at 1.0860 and falls to 1.0815. Siddharth's friend calls a trend change; Siddharth doesn't, because the external low at 1.0780 still holds.
Price then rallies and breaks the last internal high of the pullback at 1.0848. Siddharth takes that as a sign the pullback may be over and looks for a long with a stop below 1.0815. If price later closes below 1.0780, he'll treat the 4-hour structure as having changed.
Using Two Timeframes
The cleanest way to keep internal and external structure apart is to give each its own timeframe:
- Higher timeframe (for example 4H): external structure only. Mark the swing low the current leg started from and the high it reached. This decides your bias.
- Lower timeframe (for example 15m): internal structure. Use it for timing entries during pullbacks, in the direction the higher timeframe allows.
With this split, a lower-timeframe CHoCH inside a higher-timeframe pullback is not a reason to change your bias. It can even be the entry signal, if it turns back in the higher timeframe's direction.
Internal Structure as Targets
Internal swings are also useful as targets. When price leaves an external low and heads for the external high, the internal highs along the way are where partial profits are often taken, because each has its own small pool of stops. Planning exits at internal levels and keeping a runner for the external high combines the two layers of structure in one trade plan.
Common Mistakes
- Treating internal breaks as trend changes.
- Mapping internal structure across the whole chart instead of the current leg.
- Moving external levels to fit a view.
- Using internal levels for stops on trend trades, which are often too tight.
- Ignoring the timeframe the structure belongs to.
Professional Insight
Many traders effectively use two timeframes for this: they take external structure from the higher one and internal structure from the lower one. Whether you call it internal/external or higher/lower timeframe structure, the principle is the same: direction from the big swings, timing from the small ones.
Risk Considerations
- Deep pullbacks can come close to the external low before resuming; size for the full stop.
- Labelling is subjective; write rules and test them.
- Fast markets can break external levels without warning.
Important Terminology
| Term | Meaning |
|---|---|
| External structure | Major swing highs and lows defining the trend on a timeframe. |
| Internal structure | Smaller swings within one external leg. |
| Leg | A move from one external swing to the next. |
| Impulse | A leg in the trend's direction. |
| Pullback | A leg against the trend's direction. |
What is internal structure in SMC?
The smaller swing highs and lows that form within one external leg of the trend.
What is external structure?
The major swing highs and lows that define the trend on your chosen timeframe.
Does breaking internal structure change the trend?
No. Only a break of external structure changes the trend on your timeframe. In our test, closes below internal lows inside 1H uptrends were followed by only small average moves, and price was lower 24 hours later 48% of the time.
How do I use internal structure?
To time entries, for example an internal break in the trend's direction at the end of a pullback.
Is internal structure the same as lower-timeframe structure?
Closely related: internal swings on one timeframe are often the external swings of a lower timeframe.
Which timeframe should I use for external structure?
Use the timeframe one or two steps above your entry chart, for example the 4H chart for 15-minute entries. Mark only the swing the current leg started from and the high or low it reached; everything smaller is internal.
Is an external break a reversal signal?
It is a strong warning, not a reliable reversal signal. In our test, external breaks were followed by much larger average declines than internal breaks, but price was lower a day later only about half the time (31 cases).
How do I tell internal and external structure apart on a chart?
Mark the main swing high and swing low of the current leg on your trading timeframe: those are external structure. The smaller swings that form between them are internal structure. If you are unsure whether a swing is major, check whether it is visible on the next higher timeframe.
Practical Exercise
Separate internal and external swings.
Your task
Step 1: Pick a trending 4-hour chart
Any major pair.
Step 2: Mark external swings
In one colour.
Step 3: Mark internal swings of the current leg
In another colour.
Step 4: Find an internal break
Note whether it changed the external trend afterwards.
Check Your Understanding
Which swings define the trend on a timeframe?
Related Lessons
Previous: Market Structure in SMC. Next: Break of Structure vs Change of Character. See also Top-Down Forex Analysis.