
Premium, Discount and Equilibrium: Where to Buy and Sell in a Range
JustWolves is an educational platform and is not a SEBI-registered investment advisor. Trading financial instruments involves significant risk of loss and may not be suitable for all investors. Past performance is not indicative of future results. Read our full disclaimer →
What you'll learn
- A dealing range runs from a swing low to a swing high (or the reverse) on your chosen timeframe
- Equilibrium is its 50% level; above is premium, below is discount
- In an uptrend, look to buy in discount; in a downtrend, look to sell in premium
- The 62–79% retracement area is often called the optimal trade entry (OTE)
- Premium and discount tell you where to look, not when to act
In this article · 17 sections
'Buy low, sell high' is the oldest advice in markets, and the least specific. Premium and discount make it precise: within any trading range, the upper half is expensive and the lower half is cheap. SMC traders use this to decide which zones are worth trading. This lesson shows how to draw the range, where the levels sit and how to use them without overcomplicating it.
What You Will Learn
- How to draw a dealing range
- What equilibrium, premium and discount are
- How the optimal trade entry area fits in
- How to combine premium and discount with structure and zones
Before You Start
Read Market Structure in SMC first.
The Dealing Range
A dealing range is the span between a significant swing low and swing high on your timeframe. In an uptrend, draw it from the swing low that started the latest leg to the high it made. In a downtrend, from the swing high to the low.
You can draw it with a Fibonacci retracement tool or a simple box. Some material calls the box a 'GAN box'; the name doesn't matter, the 50% line does.
Equilibrium, Premium and Discount
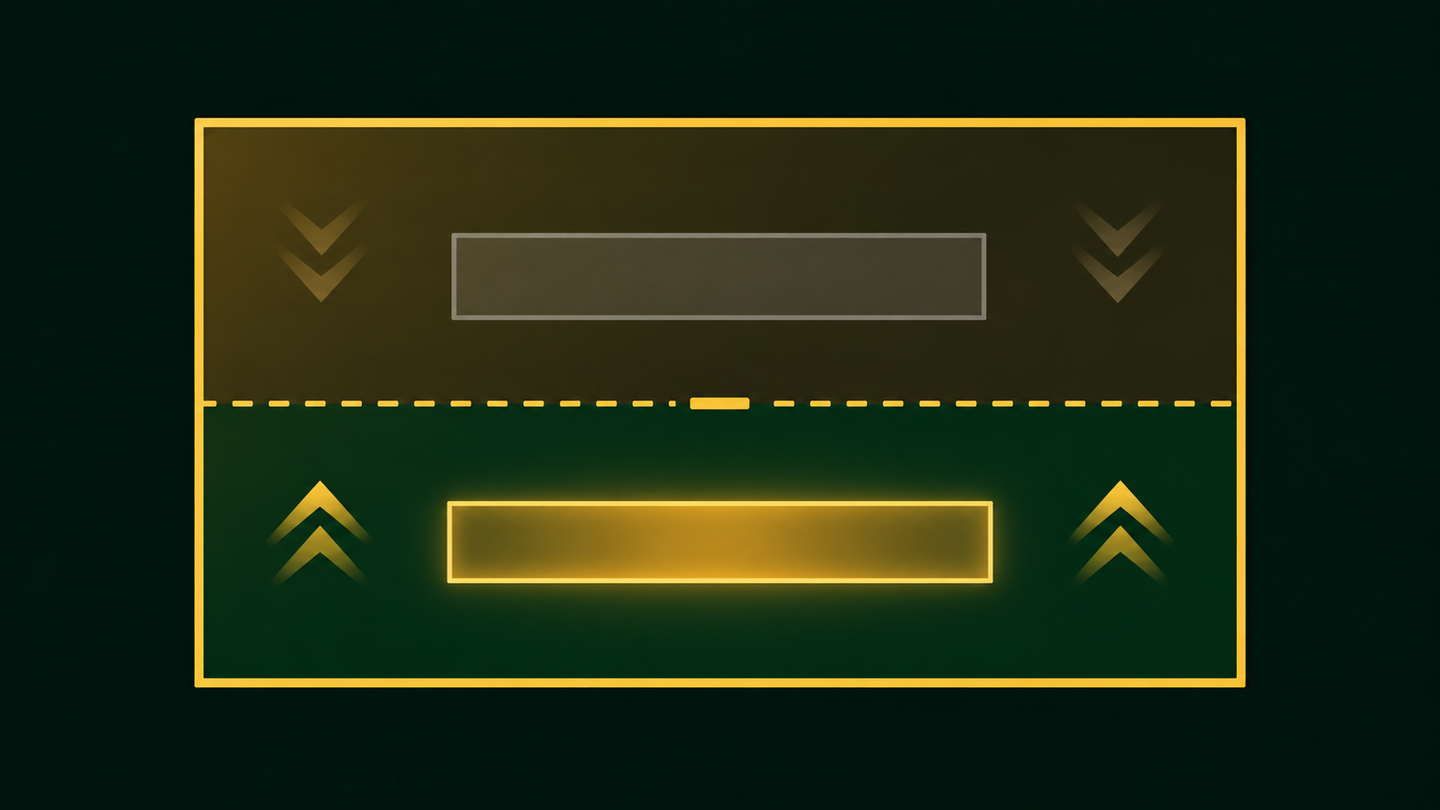
- Equilibrium: the 50% level of the range, the 'fair' middle.
- Premium: above 50%. Prices are relatively expensive within this range, so it's where sellers look to act.
- Discount: below 50%. Prices are relatively cheap, so it's where buyers look to act.
The Optimal Trade Entry (OTE)
ICT-derived material highlights the 62% to 79% retracement of the range as the 'optimal trade entry' area: deep enough to offer a good price, before the 100% level that would invalidate the leg. Many traders use the 62%, 70.5% and 79% levels as reference points inside discount (for longs) or premium (for shorts). Treat it as a refinement within the discount or premium half, not as a precise level price must respect.
The Range on a Chart
Step through the chart below to see a dealing range drawn, split at equilibrium, and traded only from discount.
Buying in discount: a USD/JPY range step by step
Step 1 of 5
Draw the dealing range
USD/JPY rallies from 148.20 to 150.60 and breaks structure. That leg is the dealing range.
- What to observe
- From the swing low that started the leg to the new high.
- Condition
- Only buy in the lower half.
Combining with Structure and Zones
| Question | Bullish setup |
|---|---|
| What's the trend? | Bullish structure on your timeframe |
| Where's the range? | From the last swing low to the swing high |
| Which half? | Discount: below 50% |
| Which zone? | An unmitigated FVG or order block in discount, ideally in the 62–79% area |
| What confirms? | A lower-timeframe CHoCH or MSS from that zone |
Does Range Position Matter? Our Test
JustWolves tested premium and discount on about six months of real 1H candles for EUR/USD, GBP/USD, USD/JPY and gold. For each hour we placed the close within the previous 48 hours' high–low range, noted the 4H trend (close above or below a rising or falling 20-candle average), and checked whether price was higher 12 hours later.
| Range position | All hours | In a 4H uptrend | In a 4H downtrend |
|---|---|---|---|
| Deep discount (lowest 25%) | 55% | 64% | 55% |
| Discount (25–50%) | 50% | 57% | 48% |
| Premium (50–75%) | 50% | 50% | 48% |
| Deep premium (top 25%) | 43% | 42% | 48% |
Three findings support this lesson, with one twist:
- The extremes of the range mattered; the middle did not. In the top and bottom quarters, price tended to move back toward the middle over the next 12 hours. Between 25% and 75%, it was a coin flip.
- Discount worked best with the trend. Deep discount in a 4H uptrend was followed by higher prices 64% of the time, the strongest result in the table. This is exactly the combination the lesson recommends.
- Deep premium was weak even in uptrends. Buying in the top quarter of the range during a 4H uptrend was followed by higher prices only 42% of the time. That is the strongest evidence in our tests for the rule "do not buy in premium".
The twist: on the 4H chart over a longer period, premium did not show the same effect, partly because gold trended strongly upward. Range position is a short-term tendency, not a law.
Ranges Change
When price breaks structure and makes a new high, the dealing range updates: the new range runs from the low of that leg to the new high, and equilibrium moves. Redraw the range after each break, and use the timeframe that matches your trade; a 4-hour range and a 15-minute range can give opposite answers at the same moment.
Step by Step: Using Premium and Discount
Each time you plan a trade
Step 1: Confirm the trend
On your analysis timeframe.
Step 2: Draw the range
From the swing that started the leg to its extreme.
Step 3: Mark 50%, and the 62–79% area
Equilibrium and the OTE area.
Step 4: Select zones in the correct half
Discount for longs, premium for shorts.
Step 5: Wait for confirmation
And size from your stop.
Practical Example
Hypothetically, on the 4-hour USD/JPY chart, price rallies from 148.20 to 150.60 and breaks structure. Equilibrium is 149.40; the 62–79% area runs from about 149.11 down to 148.70.
An unmitigated bullish FVG sits at 148.90–149.05, inside the OTE area. Harish waits for price to reach it, sees a 15-minute bullish MSS, and buys at 149.00 with a stop at 148.60, targeting the high at 150.60: 40 pips of risk for 160 pips. A second FVG at 149.80–149.95, in premium, he ignores for longs.
Premium and Discount on Two Timeframes
Ranges exist on every timeframe, and they can disagree. A price that is in discount on the 1H range can be in premium on the daily range. A practical rule is to use the higher-timeframe range to decide which side you trade, and the lower-timeframe range to decide where you enter:
- If price is in daily discount and your bias is bullish, look for longs.
- On the 1H chart, wait for price to reach the discount half of the current 1H leg before entering.
When both ranges agree, the entry has location on two timeframes. In our 1H data, the strongest result came from exactly this kind of agreement: deep discount during a 4H uptrend.
Common Mistakes
- Buying in premium because the zone is closer.
- Drawing ranges from minor swings.
- Not updating the range after a new break of structure.
- Treating 62–79% as exact levels.
- Using premium and discount alone without structure or confirmation.
Professional Insight
This is one of the more robust ideas in SMC because it's mostly about risk–reward: entering lower in a bullish range automatically gives you more room to the high and a closer invalidation point. Even traders who don't use SMC terms tend to prefer buying pullbacks in an uptrend rather than breakouts at the top.
Risk Considerations
- Deep pullbacks can become reversals.
- Different timeframes give different ranges.
- Waiting for discount means missing some moves.
Important Terminology
| Term | Meaning |
|---|---|
| Dealing range | The span from a significant swing low to swing high, or the reverse. |
| Equilibrium | The 50% level of the dealing range. |
| Premium | The upper half of the range. |
| Discount | The lower half of the range. |
| Optimal trade entry (OTE) | The 62–79% retracement area of the range. |
What are premium and discount in trading?
The upper and lower halves of a dealing range. Premium is relatively expensive, discount relatively cheap.
What is equilibrium in SMC?
The 50% level of the dealing range.
Should I buy in premium?
Generally not, in this framework. Longs are preferred in discount, where the price is better and the target further away. In our data, buying in the top quarter of the range was followed by higher prices only 43% of the time over the next 12 hours, and only 42% even during 4H uptrends.
What is the optimal trade entry?
The 62–79% retracement area of a range, often used as a refined entry area within discount or premium.
How do I draw the dealing range?
From the swing low that started the current bullish leg to its high, or from the swing high to the low in a bearish leg.
Does buying in discount really work?
At the extremes, it helped in our test. On real 1H data, price was higher 12 hours later 55% of the time from deep discount overall and 64% of the time from deep discount in a 4H uptrend. In the middle of the range, results were a coin flip.
How do I find equilibrium on a chart?
Draw the dealing range from the most recent swing low to swing high (or high to low in a downtrend) and mark the 50% level. Prices above it are premium, prices below it are discount. Redraw the range whenever a new swing high or low forms.
Practical Exercise
Draw ranges and classify zones.
Your task
Step 1: Pick three charts
4-hour charts with a clear trend.
Step 2: Draw each range
And mark 50% and 62–79%.
Step 3: Classify zones
Label every FVG and OB as premium or discount.
Step 4: Review
Where did the next pullback actually turn?
Check Your Understanding
Equilibrium is:
Related Lessons
Previous: Breaker Blocks and Mitigation Blocks. Next: Supply and Demand Zones vs Order Blocks. See also Filtering High-Quality FVGs.