
Top-Down Forex Analysis: A Daily-to-Hourly Workflow
JustWolves is an educational platform and is not a SEBI-registered investment advisor. Trading financial instruments involves significant risk of loss and may not be suitable for all investors. Past performance is not indicative of future results. Read our full disclaimer →
What you'll learn
- Start on the higher timeframe for direction and work down for timing
- Daily chart: trend and key levels; 4-hour: zones; 1-hour: entries
- Trade in the direction of the higher timeframe unless you have a clear reason not to
- Fewer timeframes, used the same way every time, beat many used loosely
- Write the analysis down before the session starts
In this article · 16 sections
Open a 5-minute chart and price looks random; open a daily chart and a trend is often obvious. Top-down analysis puts these views in order: the higher timeframe tells you the direction and the important levels, and the lower timeframe tells you when to act. This lesson gives you a concrete daily-to-hourly workflow for currency pairs, the kind you can complete in about 20 minutes before your session.
What You Will Learn
- Why analysis should flow from higher to lower timeframes
- What to look for on the daily, 4-hour and 1-hour charts
- How to combine your fundamental bias with chart structure
- A written pre-session routine you can repeat every day
Before You Start
Read Fundamental Analysis for Forex Traders first. The Price Action course covers trends, swing points and support and resistance in depth.
Why Top-Down?
Higher timeframes contain more information: a daily candle summarises a whole day of trading, and the levels visible on it are watched by more participants. Lower timeframes are noisier, and a pattern there often matters only if it agrees with the bigger picture.
Working from the top down stops you from taking a short on the 15-minute chart straight into a strong daily uptrend, or buying just under major daily resistance.
The Three Timeframes
| Timeframe | Question | What you mark |
|---|---|---|
| Weekly (quick look) | What's the big picture? | Major highs, lows and long-term trend |
| Daily | Which direction do I favour? | Trend, recent swing highs and lows, key support and resistance |
| 4-hour | Where would I act? | Zones to buy or sell within the daily trend |
| 1-hour | When do I act? | Entry trigger, stop placement, first target |
A useful rule of thumb is a factor of about four to six between timeframes. Daily, 4-hour and 1-hour fit that for swing and intraday traders; day traders sometimes use 4-hour, 1-hour and 15-minute instead. What matters is choosing a set and sticking with it.
Step 1: The Daily Chart
Identify the trend from the swing structure: higher highs and higher lows (uptrend), lower highs and lower lows (downtrend), or neither (range). Mark the most recent major swing high and low and the obvious support and resistance levels.
Then combine it with your fundamental bias from lesson 01.03.04. When both point the same way, you have a clear directional bias. When they conflict, reduce size or wait.
Step 2: The 4-Hour Chart
Within the daily trend, look for zones where you'd want to act: in an uptrend, previous resistance that may act as support, the area of the last pullback, or a level where a breakout started. Mark two or three zones at most, each as a band rather than a single price. Note how far each is from the current price; a zone that's very far away may not be reached this week.
Step 3: The 1-Hour Chart
When price reaches a 4-hour zone, drop to the 1-hour chart for the trigger: for example, a bullish reversal candle, a break back above a minor high, or a small range breaking in the direction of the daily trend. The 1-hour structure also shows where the stop belongs: beyond the swing that would prove the idea wrong.
Real Case: Daily Bias, Hourly Trigger
The two charts below use real EUR/USD data from October 2026. The first is the daily chart that sets the direction; the second is the hourly chart where the entry was timed. Step through both in order, the way this lesson's workflow runs.
Step 1, daily: EUR/USD in a downtrend, September–October 2026
Step 1 of 2
The trend
From 1.1395 on 28 September 2026, EUR/USD falls to 1.1117 on 14 October, below a falling 20-day average.
- What to observe
- A daily downtrend.
- Condition
- Bias: look for shorts only.
Step 3, hourly: the trigger, EUR/USD, 26 October 2026 (IST)
Step 1 of 4
The zone
In the Asian session EUR/USD holds a narrow range, 1.1217 to 1.1230, right at the daily lower high.
- What to observe
- A small range inside the daily resistance area.
- Condition
- A break below it would agree with the daily trend.
The Pre-Session Checklist
Twenty minutes before you trade
Step 1: Calendar
Any high-impact releases for the pair's currencies today, in IST?
Step 2: Daily
Trend, key levels, and today's bias: long, short or neutral.
Step 3: 4-hour
Two or three zones where you'd act.
Step 4: Plan
For each zone: trigger, stop, target, size.
Step 5: Write it down
If price doesn't reach your zones, there's no trade.
Practical Example
Daily. Rahul sees GBP/USD making higher highs and higher lows, with the last daily low at 1.2580 and resistance at 1.2780. His fundamental score slightly favours the pound. Bias: long.
4-hour. The previous breakout level at 1.2660–1.2675 is his main buy zone; a second zone sits at 1.2600–1.2615 near the daily low.
1-hour. Price drifts into the first zone during the London session and forms a bullish engulfing candle. He buys at 1.2672 with a stop at 1.2648, below the 1-hour swing low, and a first target at 1.2740. His plan says: no trade if price doesn't reach the zone, and no shorts today.
Does the Daily Trend Improve Hourly Trades? Our Test
The core claim of top-down analysis is that lower-timeframe setups work better in the direction of the higher timeframe. JustWolves tested it on six months of real hourly data (May to November 2026) for EUR/USD, GBP/USD, USD/JPY, gold and NIFTY 50. Hourly setups: pin bars and engulfing patterns, bullish and bearish (on mirrored prices), entered at the close with the stop beyond the pattern and a 2R target. Daily trend: taken from the previous completed daily candle, as an uptrend when it closed above a rising 20-day average and a downtrend when below a falling one.
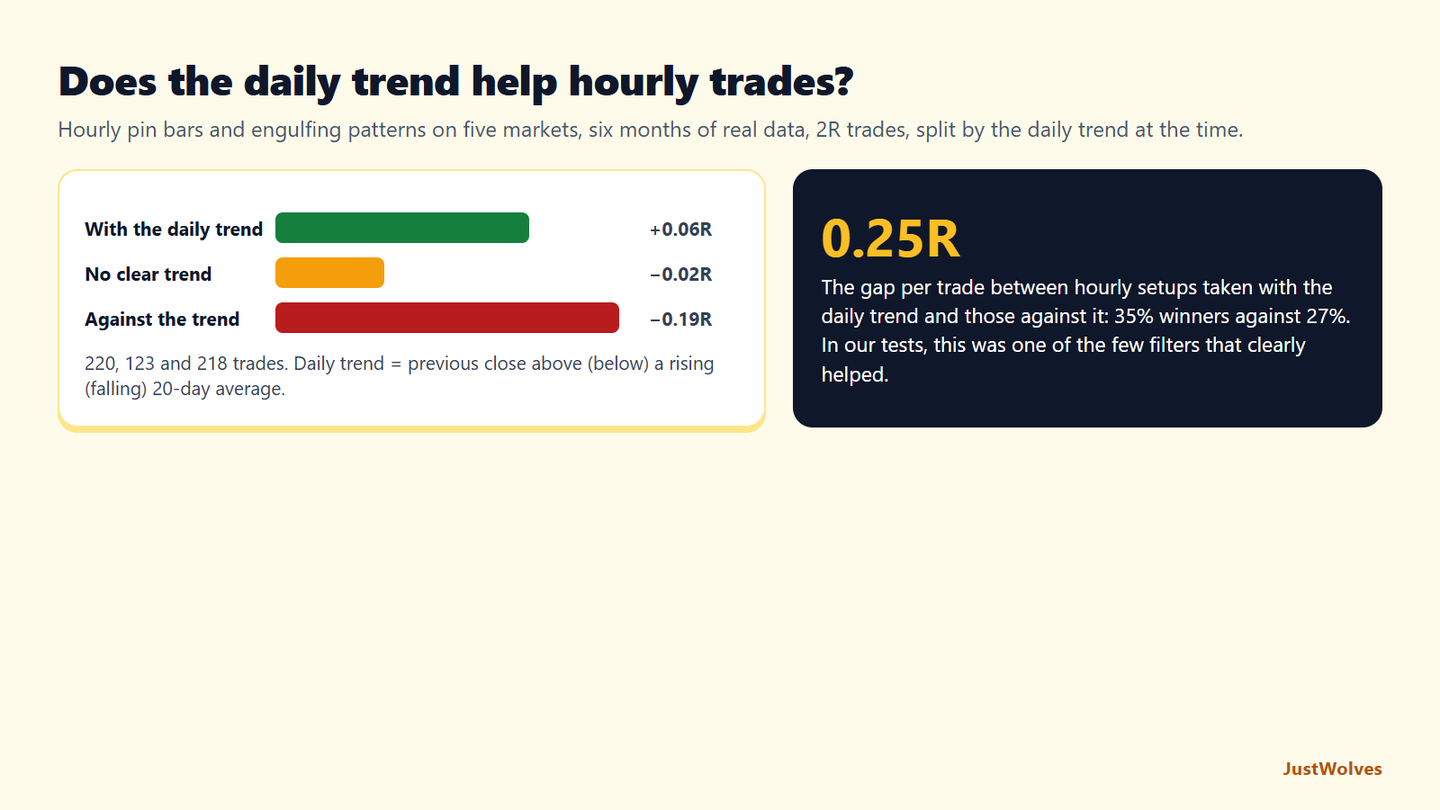
| Daily trend at the time | Trades | Reached 2R | Average result |
|---|---|---|---|
| With the hourly setup's direction | 220 | 35% | +0.06R |
| No clear daily trend | 123 | 33% | −0.02R |
| Against the hourly setup's direction | 218 | 27% | −0.19R |
This is one of the clearest results in our tests so far. The same hourly patterns did about 0.25R per trade better when the daily trend agreed with them: 35% reached the target with the trend, against 27% against it. Trading against the daily trend turned a near-break-even setup into a clearly losing one.
It is worth noting what did not work as well in earlier tests. In the Candlestick course, filtering patterns by a trend on the same timeframe made little difference. Here, using the higher timeframe's trend to filter lower-timeframe entries did. That is exactly the division of labour this lesson describes: the daily chart decides direction, the hourly chart decides timing.
The edge is still modest, +0.06R before costs, and six months of hourly data is a short period. The practical conclusion is not that this filter is a strategy, but that this lesson's rule, "trade in the direction of the higher timeframe unless you have a clear reason not to", is supported by real data, and that the rule matters most for avoiding the worst trades.
Common Mistakes
- Starting on the lowest timeframe and looking for reasons afterwards.
- Using too many timeframes until they always conflict.
- Marking dozens of levels so every price looks important.
- Ignoring the daily trend because the 1-hour chart looks convincing.
- Changing timeframes after entering to justify holding a losing trade.
Professional Insight
Professionals keep their top-down work brief and written. The point isn't to predict the day; it's to know in advance where they'd act and where they wouldn't. The plan made calmly before the session is usually better than decisions made in the middle of it.
Risk Considerations
- Higher-timeframe trends can turn; a daily bias isn't a guarantee.
- Lower-timeframe stops are small but more often hit; size accordingly.
- News can override structure; check the calendar first.
Important Terminology
| Term | Meaning |
|---|---|
| Top-down analysis | Analysing from higher to lower timeframes. |
| Bias | The direction you favour for the session. |
| Zone | A price band where you plan to act. |
| Trigger | The lower-timeframe signal that starts a trade. |
| Swing high / low | A local peak or trough in price. |
What is top-down analysis in forex?
Analysing a pair from higher to lower timeframes: direction and levels first, then entry timing.
Which timeframes should I use?
A common set is daily, 4-hour and 1-hour. Day traders often use 4-hour, 1-hour and 15-minute.
What if timeframes disagree?
Favour the higher timeframe, reduce size, or wait until they align.
How long should top-down analysis take?
With practice, about 15–20 minutes per session for a few pairs.
Should I trade against the daily trend?
Usually not as a beginner. Counter-trend trades need stronger reasons and smaller size.
Does trading with the higher timeframe trend work?
In our test on six months of real hourly data for five markets, hourly pin bars and engulfing patterns averaged +0.06R per trade when the daily trend agreed and −0.19R when it disagreed, with 35% and 27% reaching a 2R target respectively.
Practical Exercise
Complete one top-down plan.
Your task
Step 1: Daily
On EUR/USD, mark the trend, last swing high and low, and two key levels.
Step 2: 4-hour
Mark two zones where you'd act in the direction of the daily trend.
Step 3: 1-hour
Write the trigger you'd need in each zone.
Step 4: Review
At the end of the week, check whether price reached your zones and what happened.
Check Your Understanding
Which timeframe sets the direction in this workflow?
Related Lessons
Previous: Currency Correlation. Next: Forex Trading Strategies (01.04.03). See also Executing a Forex Trade from Entry to Exit.