
How the Forex Market Works: Participants, Liquidity and Volatility
JustWolves is an educational platform and is not a SEBI-registered investment advisor. Trading financial instruments involves significant risk of loss and may not be suitable for all investors. Past performance is not indicative of future results. Read our full disclaimer →
What you'll learn
- Most forex trades happen over the counter, through a tiered network of banks, platforms and brokers
- Your price comes from a broker or exchange, not from a single central market
- Liquidity is deepest in the major pairs and during overlapping sessions
- Volatility is how much prices move; it changes with sessions, news and market mood
- Market structure explains spreads, slippage and why some times and pairs are better to trade
In this article · 17 sections
When you click 'buy' on a currency pair, who is selling it to you, and where does the price come from? The answers explain a lot about trading costs, slippage and the best times to trade. This lesson walks through how the forex market is put together, who the participants are, and two ideas you'll meet in every later lesson: liquidity and volatility.
What You Will Learn
- How the over-the-counter forex market is structured
- The main participants and why each one trades
- What liquidity and volatility mean and how they change through the day
- How these affect the prices and costs you actually get
Before You Start
Read What Is Forex Trading? first. You should know what a currency pair is and what buying or selling a pair means.
A Market Without a Single Exchange
Shares of Reliance trade on NSE and BSE, where every order meets in a central order book. Spot forex mostly doesn't work like that. It is an over-the-counter (OTC) market: participants trade directly with each other or through electronic platforms, and there is no single official price at any moment.
In practice, prices across major dealers stay very close to each other because thousands of participants and arbitrage keep them in line. But the price you see depends on where you trade, which is why two brokers can show slightly different quotes for the same pair at the same second.
Currency futures and options are different: they trade on exchanges such as the CME in the US and NSE, BSE and MSE in India, with a central order book and published prices. Indian residents trade currencies through these exchange contracts.
The Tiers of the Market
| Tier | Who | What they do |
|---|---|---|
| Interbank / dealer market | Large global banks | Trade large amounts with each other and quote prices to everyone below them |
| Electronic platforms | Trading venues and aggregators | Match orders from banks, funds and brokers, and distribute prices |
| Institutions | Corporations, asset managers, hedge funds, central banks | Trade for business, investment, hedging or policy reasons |
| Retail access | Brokers and, in India, exchanges via SEBI-registered brokers | Give individuals access to prices, usually in smaller sizes |
The Participants and Their Motives
- Dealer banks make markets: they quote buying and selling prices and earn the spread, managing the risk of the positions they take on.
- Companies exchange currency to pay for imports, receive export earnings and hedge future payments. Their trades often happen regardless of the price outlook.
- Asset managers buy and sell currency when investing abroad; their flows can be large and persistent.
- Hedge funds take speculative views on currencies and interest rates.
- Central banks manage reserves and occasionally intervene to influence their currency. The RBI, for example, is an active participant in the rupee market.
- Retail traders speculate on short-term moves, usually with leverage.
Liquidity
Liquidity is how easily you can buy or sell a meaningful amount without moving the price much. Liquid markets have many buyers and sellers, tight spreads and little slippage.
In forex, liquidity is deepest in the major pairs, such as EUR/USD and USD/JPY, and during the hours when major financial centres overlap, especially London and New York. It is thinner in exotic pairs, around holidays, late in the US afternoon and when the week opens on Monday morning in Asia.
| High liquidity | Low liquidity | |
|---|---|---|
| Typical pairs | EUR/USD, USD/JPY, GBP/USD | Exotics such as USD/TRY or USD/ZAR |
| Typical times | London–New York overlap | Holidays, rollover hour, weekend opens |
| Spreads | Tight | Wide |
| Slippage on stops | Small | Can be large |
Volatility
Volatility is how much prices move. It isn't good or bad: traders need some movement to profit, but too much makes stops easier to hit and gaps more likely.
Forex volatility changes through the day (quieter in the Asian session for EUR/USD, busier when London opens), around scheduled events (central bank decisions and major data releases), and with the general mood of markets. A useful way to measure it is the Average True Range (ATR), the average size of a candle over recent periods, which you'll use for setting stops.
Real Data: One Day of EUR/USD, Hour by Hour
The chart below shows real hourly EUR/USD candles for 5 June 2026, with times in IST. It is close to the practical example later in this lesson: a quiet Asian session, a pick-up when London opens, and a burst of volatility in the New York morning.
Real data: one day of EUR/USD, hour by hour in IST, 5 June 2026
Step 1 of 4
The Asian session: almost still
From 00:30 to 11:30 IST, EUR/USD trades between 1.1612 and 1.1623: about 11 pips in eleven hours. Liquidity is there, but few large participants are active in this pair.
- What to observe
- A tight range in the quietest hours for EUR/USD.
- Condition
- Little opportunity, and little reason to trade.
Spot, Settlement and Rollover
In the interbank market, a spot trade usually settles two business days later (T+2), with a few exceptions such as USD/CAD at T+1. Retail traders rarely deal with delivery: brokers roll open positions forward each day, crediting or debiting the interest-rate difference between the two currencies, called swap or rollover.
Exchange-traded currency futures handle this differently: each contract has an expiry date, and profits and losses are settled daily through mark-to-market, as covered in the Futures & Options course.
Step by Step: Reading the Market Before You Trade
A quick market check
Step 1: Which session is active?
Check whether you're in the Asian, London or New York session, or an overlap (lesson 01.03.01).
Step 2: Any scheduled events?
Look at the economic calendar for central bank decisions and major data in the next few hours.
Step 3: How liquid is this pair right now?
Compare the current spread with its normal level. A spread much wider than usual is a warning.
Step 4: How volatile is it?
Compare today's range so far with the pair's ATR.
Step 5: Adjust or wait
In thin or very volatile conditions, trade smaller or not at all.
Practical Example
At 10:00 am IST, EUR/USD is in the Asian session with a 1-pip spread and a quiet range. At 1:30 pm IST, London opens, volume rises and the range starts to widen. At 6:00 pm IST, a major US data release is due: in the seconds after it, the spread briefly widens to several pips and price jumps 30 pips.
A trader with a stop just 10 pips away during that release could be filled several pips beyond the stop, not because of the broker but because liquidity thinned for a moment while volatility spiked.
When Does the Market Move? Our Data
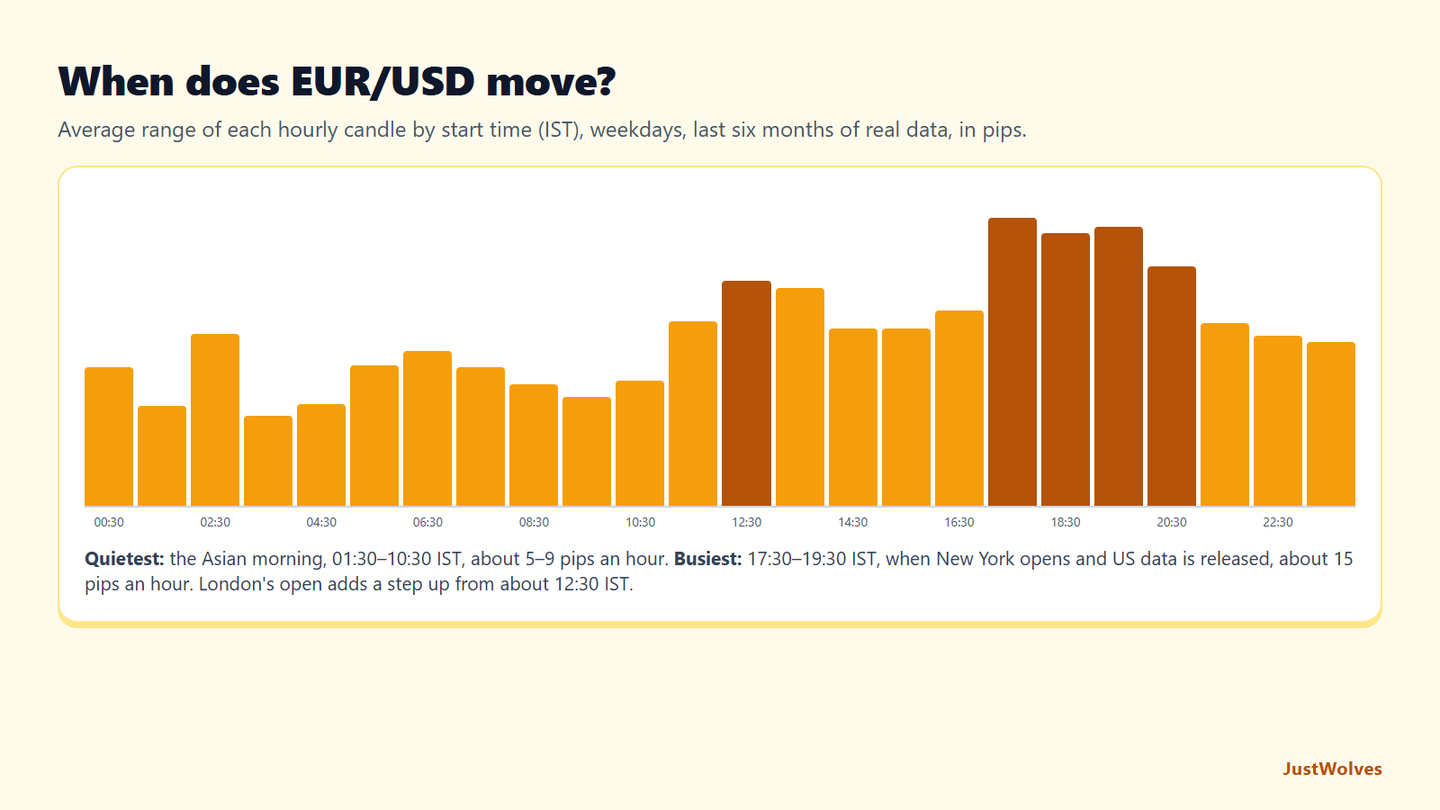
JustWolves measured the last six months of real hourly candles (May to November 2026) for EUR/USD, GBP/USD and USD/JPY, grouping them by start time in IST and leaving out weekends. The table shows the average distance from each hourly candle's high to its low.
| Candle start (IST) | EUR/USD | GBP/USD | USD/JPY |
|---|---|---|---|
| 03:30 (Asian, quietest for EUR/USD) | 4.9 | 5.7 | 13.4 |
| 08:30 (Asian) | 6.6 | 7.5 | 13.7 |
| 12:30 (London opening) | 12.2 | 15.1 | 20.6 |
| 15:30 (London afternoon) | 9.6 | 12.6 | 15.0 |
| 17:30 (New York open, US data) | 15.6 | 18.9 | 25.7 |
| 19:30 (London and New York overlap) | 15.1 | 20.0 | 24.8 |
| 22:30 (late New York) | 9.2 | 11.4 | 15.5 |
The pattern matches this lesson's description closely. EUR/USD and GBP/USD move about three times as much in the 17:30–19:30 IST hours as in the quietest Asian hours. USD/JPY is busier in the Asian session than the euro and pound, as you would expect for a yen pair, and it has an extra spike at 05:30 IST, the start of the Tokyo morning.
We also measured the weekend gap: the difference between Friday's last price and the first price when trading restarts early on Monday morning in Asia.
| Pair | Weekends | Median gap | Gaps over 10 pips | Largest |
|---|---|---|---|---|
| EUR/USD | 26 | 5.8 pips | 9 | 41.9 pips (25 May 2026) |
| GBP/USD | 26 | 6.0 pips | 7 | 52.7 pips (25 May 2026) |
| USD/JPY | 26 | 11.1 pips | 14 | 43.6 pips (28 Sep 2026) |
Most weekend gaps are small, a few pips. But about one weekend in three gapped more than 10 pips on EUR/USD, and the largest gaps were 40 to 50 pips. A stop order sitting inside such a gap is filled at the first available price, beyond the stop. That is the "overnight and weekend gaps" risk from the previous lesson, measured.
Common Mistakes
- Assuming one 'true' price. Prices differ slightly between brokers and venues.
- Trading exotics like majors. Wider spreads and bigger slippage change the maths.
- Ignoring the clock. The same setup behaves differently in a quiet session and an overlap.
- Trading through major releases without a plan. Spreads and slippage can jump.
- Holding positions without understanding swap. Overnight costs or credits add up.
Professional Insight
Professional traders think in terms of liquidity first: when it's there, when it disappears, and how much size they can trade without moving the price. Retail traders rarely move the market, but they still pay for low liquidity through wider spreads and slippage, so choosing liquid pairs and liquid hours is a simple, free improvement.
Risk Considerations
- Slippage increases when liquidity is thin.
- Gaps happen at the weekend open and around unexpected news.
- Broker risk varies with how your broker sources prices and holds client money; use regulated, authorised routes.
Important Terminology
| Term | Meaning |
|---|---|
| OTC | Over-the-counter: traded directly between participants, not on a central exchange. |
| Dealer / market maker | A firm that quotes buy and sell prices and earns the spread. |
| Liquidity | How easily you can trade without moving the price. |
| Volatility | How much prices move over a period. |
| ATR | Average True Range: the average size of recent candles. |
| Spot (T+2) | A currency exchange that settles two business days after the trade. |
| Swap / rollover | The interest credit or debit for holding a position overnight. |
How does the forex market work?
It is a global over-the-counter network where banks, institutions, brokers and individuals exchange currencies electronically, around the clock on weekdays.
Who sets forex prices?
No single entity. Dealer banks and trading platforms quote prices based on supply and demand, and competition keeps quotes close together.
What is liquidity in forex?
How easily a pair can be traded without moving its price. Major pairs during the London and New York sessions are the most liquid.
What is the difference between liquidity and volatility?
Liquidity is about ease of trading; volatility is about how much price moves. A market can have both at once.
Is forex traded on an exchange in India?
Yes. Indian residents trade currency futures and options on NSE, BSE and MSE through SEBI-registered brokers.
What time is the forex market most active in India?
For EUR/USD and GBP/USD, our data shows the largest hourly ranges from about 17:30 to 20:30 IST, when New York is open and overlaps with London, with a smaller rise from about 12:30 IST when London opens. The Asian morning was the quietest.
How big are forex weekend gaps?
Usually small. Over six months of real data, the median weekend gap was about 6 pips on EUR/USD and GBP/USD and 11 pips on USD/JPY, but the largest were 40 to 50 pips, which can carry a price beyond a stop.
Practical Exercise
Observe one pair across a trading day.
Your task
Step 1: Pick EUR/USD or USD/INR
Note the spread and the price at three times: morning, early afternoon and evening IST.
Step 2: Note the range
Write down the high and low of each period.
Step 3: Check the calendar
Did any scheduled event happen near the biggest move?
Step 4: Summarise
When was the spread tightest and the range largest? What does that suggest about when to trade this pair?
Check Your Understanding
What does 'over-the-counter' mean for spot forex?
Related Lessons
Previous: What Is Forex Trading? (01.01.01). Next: Understanding Currency Pairs. Later: Bid, Ask and Spread (01.01.06) and Forex Trading Sessions (01.03.01).