
How to Use a Forex Economic Calendar
JustWolves is an educational platform and is not a SEBI-registered investment advisor. Trading financial instruments involves significant risk of loss and may not be suitable for all investors. Past performance is not indicative of future results. Read our full disclaimer →
What you'll learn
- An economic calendar lists scheduled releases with time, impact, forecast, previous and actual
- The surprise, actual minus forecast, drives the reaction
- Major US data is usually released at 6:00 or 7:00 pm IST, depending on US daylight saving
- Spreads widen and slippage rises around high-impact news
- Decide your news rule in advance: stay out, reduce size, or trade only after the release settles
In this article · 16 sections
Most large, sudden moves in currency pairs happen at scheduled times, and those times are published in advance. An economic calendar is the tool that tells you when they are. Checking it takes a minute a day, and it's one of the simplest ways to avoid being stopped out by a release you didn't know was coming.
What You Will Learn
- What an economic calendar shows and how to read each column
- How to judge the importance of a release
- When major releases happen in IST
- Practical rules for trading around news
Before You Start
Read Forex Trading Sessions and Market Hours in IST first, because release times shift with daylight saving.
Reading the Calendar
| Column | What it means |
|---|---|
| Time | When the figure is released, ideally shown in your timezone |
| Currency / country | Which currency is most directly affected |
| Event | The indicator or announcement, e.g. CPI y/y, interest rate decision |
| Impact | Expected importance: usually low, medium or high |
| Forecast | The consensus expectation |
| Previous | The last figure, sometimes with a revision |
| Actual | The released figure, filled in at the release time |
JustWolves has a global economic calendar and an India economic calendar, both shown in IST.
Judging Importance
High-impact events for the major currencies typically include central bank decisions, inflation (CPI), employment (such as US non-farm payrolls), GDP and major PMIs. A release matters most when it bears directly on the next central bank decision, so the same indicator can be more or less important depending on what the central bank is focused on at the time.
Also note clusters: several high-impact releases on the same day, or a central bank decision after a big data week, can cause larger and more erratic moves.
Release Times in IST
| Release | Local time | IST (northern summer / winter) |
|---|---|---|
| Most US data (CPI, payrolls, retail sales) | 8:30 am New York | 6:00 pm / 7:00 pm |
| US Federal Reserve decision | 2:00 pm New York | 11:30 pm / 12:30 am |
| European Central Bank decision | 2:15 pm Frankfurt | 5:45 pm / 6:45 pm |
| Bank of England decision | 12:00 noon London | 4:30 pm / 5:30 pm |
| RBI policy decision | 10:00 am IST | 10:00 am |
What Happens Around a Release
In the minutes before a high-impact release, liquidity often thins and spreads widen as dealers protect themselves. At the release, price can jump several pips in a second, and stop orders may fill well beyond their trigger. In the following minutes, the first move sometimes reverses as traders digest details and revisions.
After a few minutes, spreads usually return to normal and a clearer direction can emerge, often in the direction of the surprise if it was large.
Real Data: A Jobs-Report Hour on EUR/USD
The chart below uses real hourly EUR/USD candles for 7 August 2026, in IST. It follows the sequence this lesson describes: a quiet market before a high-impact release, a sharp move when the figure is published, and a partial reversal as spreads return to normal.
Real data: EUR/USD on a US jobs-report day, 7 August 2026 (IST)
Step 1 of 3
Before the release
Through the London session on 7 August 2026, EUR/USD trades in a 15-pip band, 1.1522 to 1.1537. The calendar shows the US jobs report at 8:30 am New York time, 18:00 IST, marked high impact.
- What to observe
- Quiet before a scheduled event.
- Condition
- Deepa's rule: flat in dollar pairs from 17:45 to 18:15 IST.
Three Ways to Handle News
- Stay out: close or avoid positions in the affected currencies from shortly before until shortly after high-impact releases. Simplest and often best for beginners.
- Reduce and widen: keep a smaller position with a stop placed beyond the likely spike range, accepting the risk deliberately.
- Trade after the release: wait for spreads to normalise and look for a setup in the direction of the surprise, using your normal rules.
Step by Step: A Daily Calendar Routine
Two minutes before trading
Step 1: Filter
Show only medium and high-impact events for your currencies.
Step 2: Note the times in IST
Write them on your trading plan.
Step 3: Check open positions
Do any face a release today? Apply your news rule.
Step 4: Note forecasts
So you can judge the surprise when the actual comes out.
Step 5: Review after
Record the surprise and the reaction to build your own experience.
Practical Example
On a Friday in January, Deepa sees US payrolls due at 7:00 pm IST, marked high impact. She's long EUR/USD from the afternoon with a 20-pip stop. Her rule is to be flat in dollar pairs from 15 minutes before a high-impact US release until 15 minutes after.
She closes the trade at 6:45 pm with a small profit. At 7:00 pm, payrolls come in well above forecast, EUR/USD drops 40 pips in two minutes, and the spread briefly widens to several pips. At 7:20 pm, with spreads back to normal, she reviews the chart and decides there's no setup matching her rules. No trade, and no stop-out.
What Happens on Jobs-Report Days? Our Data
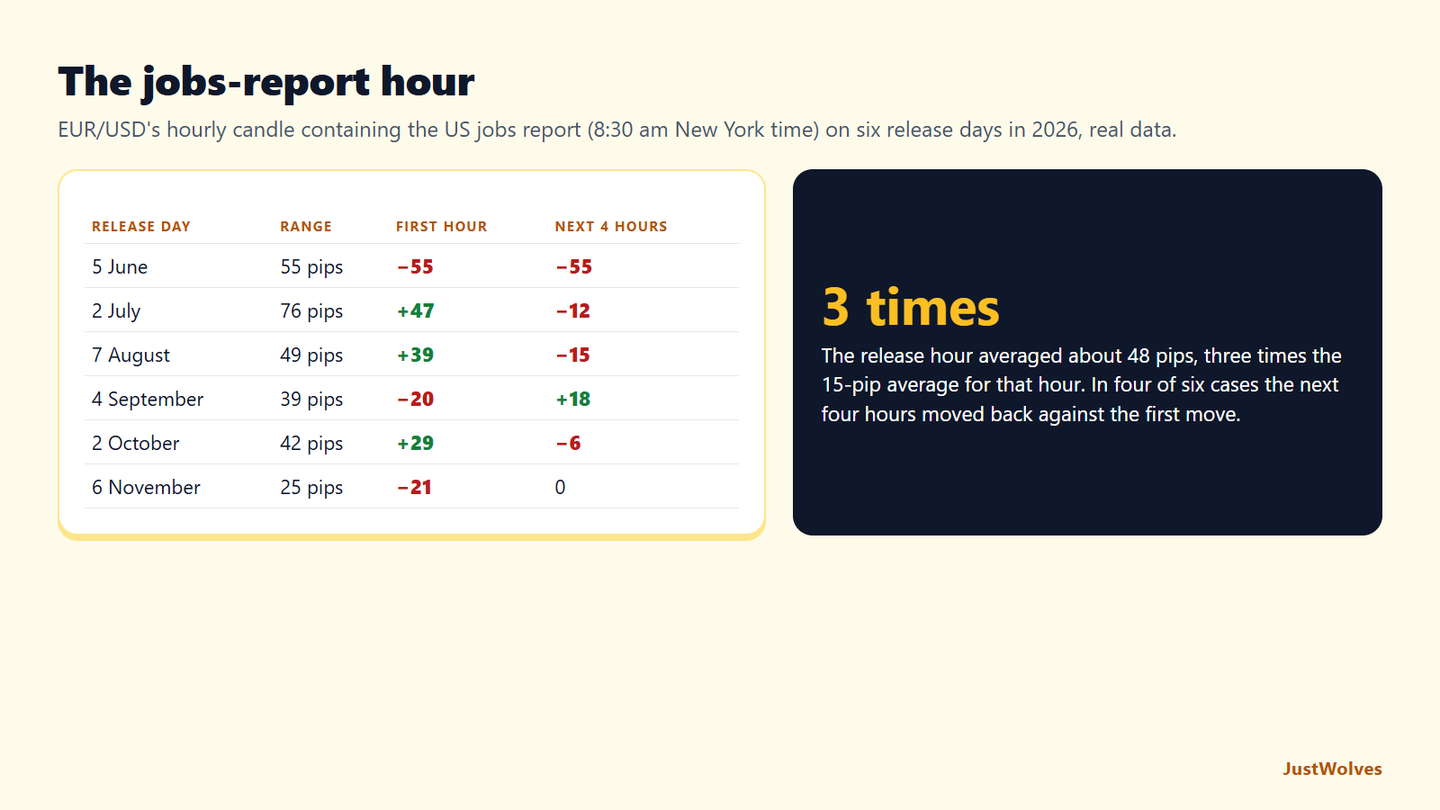
The US jobs report (non-farm payrolls) is usually published at 8:30 am New York time on the first Friday of the month: 18:00 IST in summer and 19:00 IST in winter. JustWolves looked at EUR/USD's hourly candle containing the release on the six release days in our six months of real hourly data (June to November 2026; in July the report came on Thursday 2 July because of the US holiday), and at what happened in the four hours that followed.
| Release day | Release-hour range | Release-hour move | Next four hours | Pattern |
|---|---|---|---|---|
| 5 June | 55 pips | −55 pips | −55 pips | Continued |
| 2 July | 76 pips | +47 pips | −12 pips | Partly reversed |
| 7 August | 49 pips | +39 pips | −15 pips | Partly reversed |
| 4 September | 39 pips | −20 pips | +18 pips | Mostly reversed |
| 2 October | 42 pips | +29 pips | −6 pips | Partly reversed |
| 6 November | 25 pips | −21 pips | 0 pips | Flat |
Two observations support this lesson's rules. The release hour averaged about 48 pips, three times a normal hour, so a stop sitting 10 or 20 pips away during the release was in real danger whatever the direction. The first move often did not hold: in four of the six cases the following hours moved back against it, and only once (5 June) did the first move carry on strongly. That is the trap behind the warning against trading the spike: the trader who chases the first seconds pays the widest spreads and then faces a frequent pullback.
Deepa's approach in the example below, flat before the release and back only once spreads have normalised and a setup matches her rules, avoids both problems. Six releases is far too few to build a strategy on, and our data has no forecasts, so we cannot measure surprises. But the size of the release-hour moves is consistent across all six.
Common Mistakes
- Not checking the calendar at all.
- Reading times in the wrong timezone or forgetting daylight saving.
- Ignoring medium-impact events that can still move a pair.
- Trading the first seconds of a release.
- Judging the number without the forecast.
Professional Insight
Professional traders plan their week around the calendar: they know which days carry event risk for their pairs, adjust position sizes beforehand, and often prepare scenarios: if the figure is well above forecast, what do I expect, and what will I do? Preparation turns news from a shock into a known risk.
Risk Considerations
- Slippage and gaps at releases can exceed your planned loss.
- Unscheduled news such as geopolitical events isn't on the calendar.
- Forecasts can be wrong and releases can be delayed or revised.
Important Terminology
| Term | Meaning |
|---|---|
| Economic calendar | A schedule of upcoming data releases and events. |
| Impact level | The expected importance of a release for the market. |
| Forecast (consensus) | The expected figure. |
| Actual | The released figure. |
| Surprise | Actual minus forecast. |
| Non-farm payrolls (NFP) | The monthly US employment report. |
What is a forex economic calendar?
A schedule of upcoming economic releases and central bank events, with the time, expected impact, forecast, previous and actual figures.
What time is US data released in India?
Most major US data comes out at 8:30 am New York time: 6:00 pm IST in the northern summer and 7:00 pm IST in winter.
Should beginners trade the news?
Generally no. Staying flat around high-impact releases, or waiting until spreads normalise afterwards, is safer.
What does 'actual vs forecast' mean?
The actual is the released figure; the forecast is what was expected. The difference is the surprise that moves price.
Where can I see the Indian economic calendar?
JustWolves has an India economic calendar with RBI decisions and Indian data releases in IST.
How much does EUR/USD move on US jobs-report days?
In six 2026 releases in our data, the hourly candle containing the report averaged about 48 pips, against about 15 pips for the same hour on other days. The largest was 76 pips on 2 July 2026.
Practical Exercise
Track one week of releases.
Your task
Step 1: Pick three releases
High-impact events for currencies you trade this week.
Step 2: Record the forecast
Before each release.
Step 3: Record the reaction
Actual, surprise, and the pair's move after 1 minute and 30 minutes.
Step 4: Note the spread
Just before, at and after the release.
Step 5: Conclude
Write your own news rule from what you saw.
Check Your Understanding
CPI is forecast at 3.0% and released at 3.4%. The surprise is:
Related Lessons
Previous: Fundamental Analysis for Forex Traders. Next module: Analysis, Strategy and Risk, starting with Currency Correlation (01.04.01). See also Central Banks and Monetary Policy.