
Forex Trading Strategies: Trend, Range and Breakout Approaches
JustWolves is an educational platform and is not a SEBI-registered investment advisor. Trading financial instruments involves significant risk of loss and may not be suitable for all investors. Past performance is not indicative of future results. Read our full disclaimer →
What you'll learn
- Most forex strategies are variations of trend-following, range-trading or breakout approaches
- Each works in a particular market condition and fails in others
- Identify the condition first, then choose the approach
- Every strategy needs written rules for entry, stop, target and size
- Test a strategy on past charts and a demo account before risking money
In this article · 16 sections
There are thousands of named forex strategies online, but most are variations of three ideas: trade with the trend, trade the edges of a range, or trade the break out of a range. Understanding these three, including when each tends to fail, is more useful than collecting more systems. This lesson sets out each approach with clear rules and shows how to test one.
What You Will Learn
- The three core strategy types and their logic
- Example rules for each
- Which market conditions suit each approach
- How to test a strategy before trading it live
Before You Start
Read Top-Down Forex Analysis first. The strategies below use its daily, 4-hour and 1-hour workflow.
First: Identify the Market Condition
On the daily or 4-hour chart, ask whether the pair is trending (clear higher highs and higher lows, or the reverse), ranging (bouncing between roughly horizontal support and resistance), or compressing (a narrowing range before a potential breakout). Choosing a strategy that suits the condition matters more than the details of the entry.
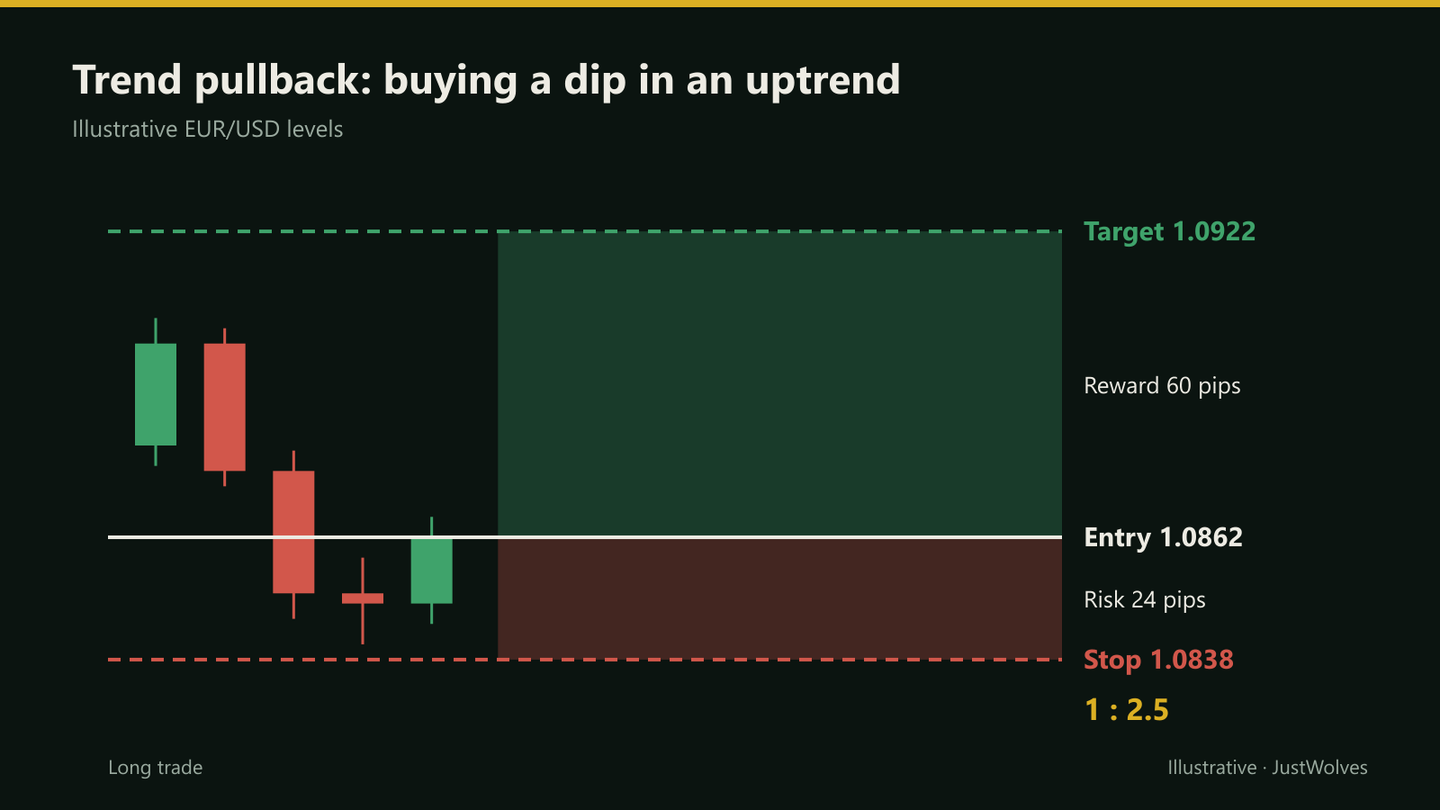
1. Trend Pullback
Logic: in a trend, buy dips (or sell rallies) rather than chasing moves.
- Condition: daily uptrend with clear higher highs and higher lows.
- Entry: price pulls back to a 4-hour support zone; buy on a 1-hour bullish trigger.
- Stop: below the pullback low.
- Target: the previous swing high first, then trail the stop.
- Fails when: the trend is ending; pullbacks become reversals.
2. Range Trading
Logic: when price is contained between clear support and resistance, sell near the top and buy near the bottom.
- Condition: at least two touches of both support and resistance, no strong trend.
- Entry: a rejection signal at the edge of the range.
- Stop: just outside the range, beyond the spread and recent spikes.
- Target: the middle or the opposite side of the range.
- Fails when: the range breaks; a breakout runs straight through your stop.
Ranges are common in the Asian session and in quieter periods before major news. Keep targets realistic: the full width of a range is rarely captured.
3. Breakout Trading
Logic: when price breaks out of a range or pattern with momentum, trade in the direction of the break.
- Condition: a clear range or compression, ideally in the direction of the higher-timeframe trend.
- Entry: a stop order beyond the range, or a retest of the broken level.
- Stop: back inside the range.
- Target: a measured move (the height of the range) or the next higher-timeframe level.
- Fails when: the breakout is false and price returns into the range.
False breakouts are common, which is why many traders wait for a candle to close beyond the level or for a retest. The Breakout Trading course covers them in depth.
Choosing Between Them
| Approach | Best condition | Typical failure | Typical profile |
|---|---|---|---|
| Trend pullback | Clear trend | Trend reversal | Fewer, larger winners |
| Range | Sideways market | Range breaks | More frequent, smaller wins |
| Breakout | Compression before expansion | False breakout | Many small losses, some large wins |
Real Case: A Breakout With the Trend
The chart below uses real daily EUR/USD candles from May and June 2025. It follows the breakout rules from this lesson in the condition where our data says they worked best: a pause inside an existing uptrend.
Real case: a breakout in the direction of the trend, EUR/USD, May–June 2025
Step 1 of 4
Condition: an uptrend, pausing
EUR/USD has been rising since March 2025, above a rising 50-day average. In late May it pauses in a range below 1.1422, the highest price of the previous 20 days.
- What to observe
- A trend with a consolidation: a breakout setup in the trend's direction.
- Condition
- Wait for a close above the range.
Step by Step: Testing a Strategy
Before risking money
Step 1: Write exact rules
Condition, entry, stop, target, size, and when not to trade.
Step 2: Backtest manually
Go back through charts and record every valid setup, at least 50–100 trades, including costs.
Step 3: Measure
Win rate, average win and loss in R, expectancy, maximum drawdown.
Step 4: Forward test
Trade it on a demo account for several weeks, following the rules exactly.
Step 5: Go small
Start live at reduced size and compare results with the test.
Backtesting a Trading Strategy explains how to avoid common testing mistakes.
Which Strategy Works in Which Condition? Our Test
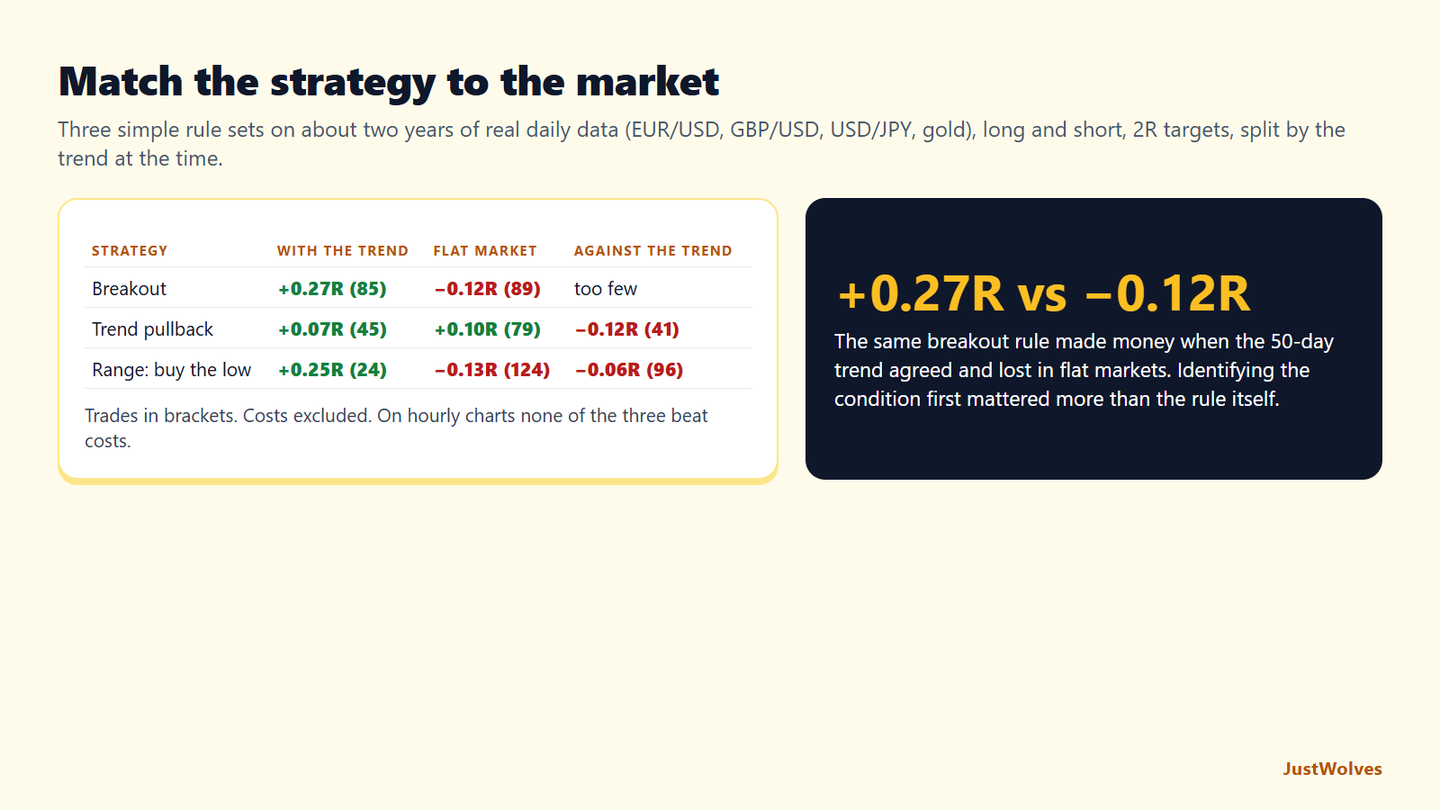
This lesson's main advice is to identify the market condition first, then choose the approach. JustWolves tested simple versions of all three strategies on real data: about two years of daily candles and six months of hourly candles for EUR/USD, GBP/USD, USD/JPY and gold, with long and short trades (short trades tested on mirrored prices), a stop beyond the setup and a 2R target.
Trend pullback: the candle dips to the 20-period average and closes back above the previous candle's high. Range: price in the bottom 15% of a 20-period range no wider than six average candles, closing up. Breakout: a close above the 20-period high. Condition: the 50-period average rising (with the trend), falling (against it) or roughly flat.
| Strategy | With the trend | Flat market | Against the trend | All |
|---|---|---|---|---|
| Breakout | 85 trades, 42% wins, +0.27R | 89 trades, 29% wins, −0.12R | too few | 196 trades, +0.09R |
| Trend pullback | 45 trades, 36% wins, +0.07R | 79 trades, 37% wins, +0.10R | 41 trades, 29% wins, −0.12R | 168 trades, +0.04R |
| Range: buy the low | 24 trades, 42% wins, +0.25R | 124 trades, 29% wins, −0.13R | 96 trades, 31% wins, −0.06R | 268 trades, −0.10R |
Three findings stand out.
Breakouts depended on the trend. The same breakout rule made +0.27R per trade when the 50-day trend agreed and lost 0.12R in flat markets. That is the failure mode described above: in a range, a break of the 20-day high is more often a false breakout.
The range rule did poorly in flat markets. Surprisingly, buying the bottom of a range lost in exactly the condition it was designed for. Its best results came when the "range" sat inside an uptrend, which makes it a pullback trade in disguise. Ranges need clearer edges and better triggers than this simple rule.
On hourly charts, none of the three beat zero before costs (breakouts −0.13R, pullbacks −0.04R, range +0.01R overall). Short timeframes add noise and, after spreads, these simple rules would all have lost. That supports this lesson's approach of using the daily chart for the condition and lower timeframes only for timing, as in Top-Down Forex Analysis.
These are simple, mechanical versions of each idea, not the full rules in this lesson, so treat them as a demonstration of why condition matters rather than as strategies to trade.
Practical Example
Pooja tests a trend-pullback strategy on EUR/USD over two years of 4-hour charts. Her written rules produce 84 trades. After spread and slippage, her test shows a 41% win rate with an average win of 2.1R and an average loss of 1R: an expectancy of (0.41 × 2.1) − (0.59 × 1) = +0.27R per trade. These are her own test results, not a general statistic.
She then forward-tests for six weeks on demo. Her live results are worse at first, because she skips valid trades after two losses. She adds a rule, 'take every valid setup', and her demo results start to resemble the test.
Common Mistakes
- Using one strategy in every condition.
- Strategy hopping after a few losses.
- Vague rules that change from trade to trade.
- Testing without costs.
- Trusting screenshots and claims of other people's results.
Professional Insight
Many professional traders run one or two strategies they know deeply, with clear conditions for when to switch them off. Knowing when your strategy shouldn't be traded is as important as knowing when it should.
Risk Considerations
- Every strategy has losing streaks; size so you can survive them.
- Past test results don't guarantee future performance.
- Market conditions change; a strategy can stop working.
Important Terminology
| Term | Meaning |
|---|---|
| Trend pullback | Entering in the trend's direction after a temporary counter-move. |
| Range | Sideways price movement between support and resistance. |
| Breakout | Price moving decisively beyond a range or level. |
| False breakout | A break that quickly reverses back inside the range. |
| Backtest / forward test | Testing rules on past data / in real time on demo. |
| Expectancy | Average result per trade, often in R. |
What is the best forex trading strategy?
There's no single best one. The right approach depends on the market condition and on rules you've tested and can follow consistently.
What is a trend pullback strategy?
Buying dips in an uptrend or selling rallies in a downtrend, with a stop beyond the pullback.
How do I avoid false breakouts?
Wait for a close beyond the level or a retest, trade breakouts in the direction of the higher-timeframe trend, and keep size small.
How many trades do I need to test a strategy?
At least 50–100 for a rough picture, more for confidence, always including costs.
Should I use several strategies?
Start with one, learn it well, and add another only once you understand its conditions and results.
Which forex strategy works best in a trending market?
In our test on about two years of real daily data, breakouts above the 20-day high in the direction of a rising 50-day trend averaged +0.27R per trade with a 2R target, the best result among the three simple strategy types. The same breakouts lost in flat markets.
Practical Exercise
Write and test one strategy.
Your task
Step 1: Pick an approach
Trend pullback, range or breakout.
Step 2: Write five rules
Condition, entry, stop, target, size.
Step 3: Find 20 examples
On past charts, applying the rules exactly.
Step 4: Score them
Record each result in R, including costs, and calculate expectancy.
Check Your Understanding
Which approach suits a sideways market?
Related Lessons
Previous: Top-Down Forex Analysis. Next: Spot Forex vs CFDs vs Currency Futures (01.04.04). See also the Breakout Trading course.