
Currency Correlation: How Forex Pairs Move Together
JustWolves is an educational platform and is not a SEBI-registered investment advisor. Trading financial instruments involves significant risk of loss and may not be suitable for all investors. Past performance is not indicative of future results. Read our full disclaimer →
What you'll learn
- Correlation measures how consistently two pairs move together, from −1 to +1
- Pairs sharing a currency are often strongly correlated, positively or negatively
- Two correlated trades behave like one larger trade
- Correlations change over time; measure them, don't assume them
- Limit total exposure per currency, not just risk per trade
In this article · 15 sections
Many traders size each trade carefully at 1% of their account, then open three trades that are really the same bet. Currency pairs share currencies, so they often move together, and a portfolio of 'different' trades can carry far more risk than it seems. Understanding correlation lets you see the real risk you're taking.
What You Will Learn
- What correlation means and how it's measured
- Why some pairs move together and others in opposite directions
- How correlated positions add up to more risk
- How to measure correlation and set exposure limits
Before You Start
Read Forex Position Sizing first. This lesson extends sizing from one trade to several.
What Correlation Means
The correlation coefficient measures how consistently two price series move together. It ranges from +1 (they always move in the same direction, in proportion) through 0 (no consistent relationship) to −1 (they always move in opposite directions).
As a rough guide, values above about +0.7 or below about −0.7 are usually described as strong. Correlation describes the past; it says nothing certain about tomorrow, and it can change sharply when market conditions change.
Why Pairs Move Together
The main reason is shared currencies. EUR/USD and GBP/USD both have the US dollar as quote currency, so news that moves the dollar tends to move both in the same direction. They've often been strongly positively correlated, though the euro and pound have their own drivers too.
EUR/USD and USD/CHF share the dollar on opposite sides: when the dollar strengthens, EUR/USD tends to fall and USD/CHF to rise. They've often been strongly negatively correlated. Economic links matter too: the Australian and New Zealand dollars, both tied to commodity exports and Asian demand, often move together.
| Pairs | Shared currency | Typical relationship |
|---|---|---|
| EUR/USD and GBP/USD | USD as quote in both | Positive |
| AUD/USD and NZD/USD | USD as quote; similar economies | Positive |
| EUR/USD and USD/CHF | USD on opposite sides | Negative |
| GBP/USD and USD/JPY | USD on opposite sides | Often negative, but varies |
| EUR/USD and USD/INR | USD on opposite sides | Often negative, but the rupee has its own drivers |
How Correlation Changes Your Risk
Suppose you risk 1% on each of two trades. If they're unrelated, they won't often lose together. If they're perfectly correlated, they win and lose together, and your real risk is 2% on one idea. If they're perfectly negatively correlated, they cancel out.
Statistically, the combined risk of two equal positions is the single-trade risk × √(2 + 2 × correlation). The chart shows the result for two trades at 1% each:
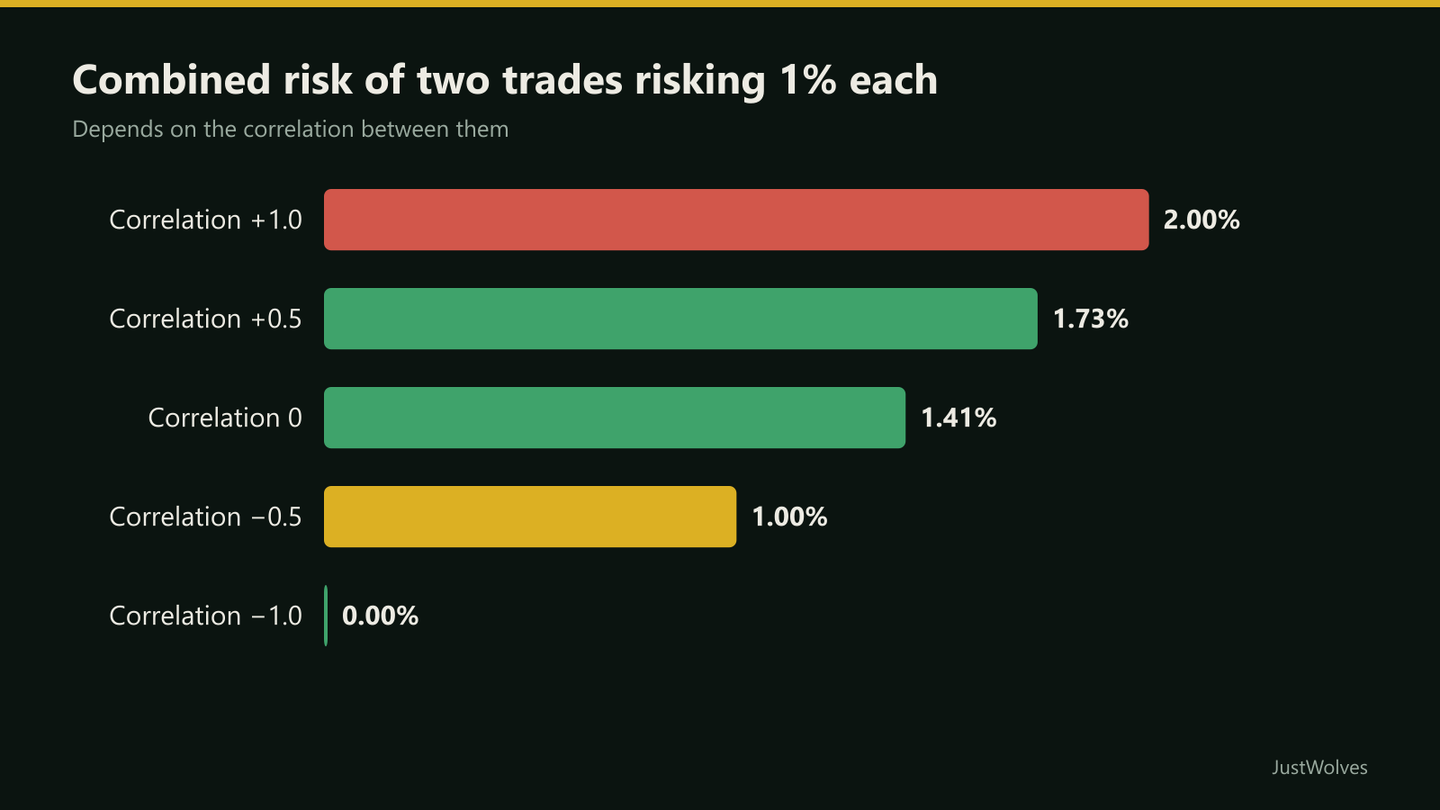
Note the direction matters. Long EUR/USD and short USD/CHF are both bets against the dollar, so a negative correlation between the pairs becomes a positive correlation between your positions.
Real Data: Three Positions, One Dollar Move
The chart below uses real daily EUR/USD candles from January 2026. It shows the situation in Farhan's example on a real day: positions in different pairs that were all, underneath, the same view on the US dollar.
Real data: one dollar move, three positions, EUR/USD, January 2026
Step 1 of 3
A quiet start to the year
In early January 2026 EUR/USD drifts between 1.159 and 1.175. On quiet days like these, EUR/USD and GBP/USD often move independently: in our data they closed in the same direction only about half the time on the quietest days.
- What to observe
- Low correlation when nothing big is happening.
- Condition
- Holding several dollar pairs looks diversified.
Measuring Correlation
A spreadsheet method
Step 1: Get closing prices
Daily closes for both pairs over the same 50–100 days.
Step 2: Convert to returns
Daily percentage change: today ÷ yesterday − 1.
Step 3: Apply CORREL
In Excel or Google Sheets, =CORREL(returnsA, returnsB).
Step 4: Compare periods
Calculate it for the last 20 days and the last 100 days to see whether it's changing.
Use returns rather than prices: two trending price series can look correlated just because both went up.
Using Correlation in Practice
- Set a currency exposure limit, for example no more than 2% total risk on any one currency.
- Choose the clearest chart when two correlated pairs give the same signal, rather than taking both.
- Halve the size if you do take both.
- Use correlation as confirmation: a USD move showing in several dollar pairs is more convincing than one pair alone.
Practical Example
Farhan has a $10,000 account and three open trades at 1% each: long EUR/USD, long GBP/USD and short USD/CHF. On paper, that's 3% at risk across three pairs. In reality, all three are bets on a weaker dollar.
When strong US data lifts the dollar, all three hit their stops on the same afternoon: a 3% loss from a single idea. With a 2% currency limit, he would have taken the two clearest setups at 1% each, or all three at about 0.67%.
How Stable Is Correlation? Our Data
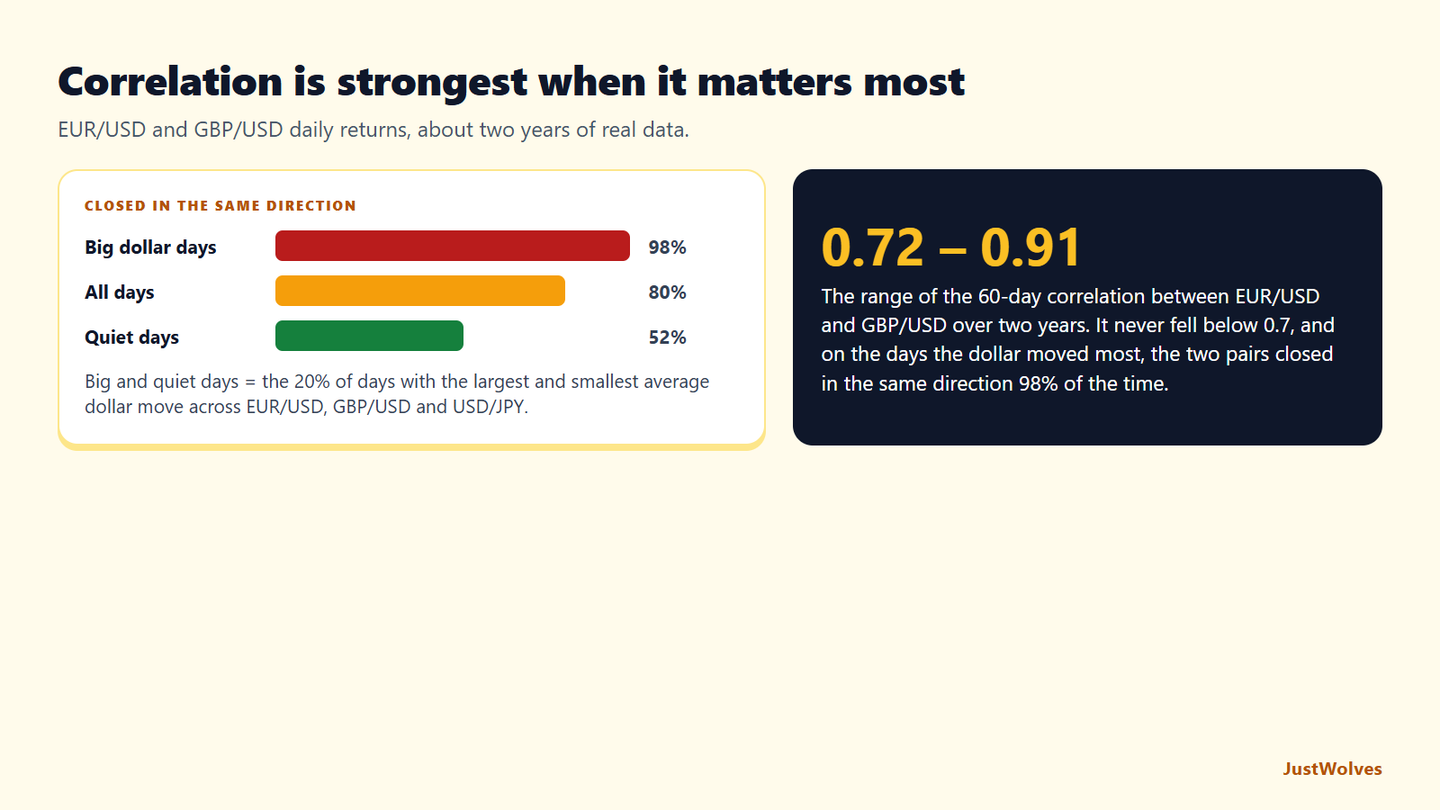
This lesson says correlations change over time and tend to rise in stress. JustWolves measured both on about two years of real daily data (November 2024 to November 2026), using daily returns, as this lesson's measuring steps recommend.
| Pairs | Median | Lowest | Highest |
|---|---|---|---|
| EUR/USD and GBP/USD | +0.82 | +0.72 (window ending 5 Jan 2026) | +0.91 (window ending 3 Jun 2026) |
| EUR/USD and USD/JPY | −0.64 | −0.86 (window ending 19 Jun 2025) | −0.23 (window ending 19 Mar 2025) |
| Days | Correlation | Closed in the same direction |
|---|---|---|
| Biggest 20% of dollar-move days | +0.89 | 98% |
| All days | +0.81 | 80% |
| Quietest 20% of days | +0.31 | 52% |
Three findings matter for this lesson.
EUR/USD and GBP/USD were reliably correlated. Their three-month correlation never fell below 0.72, comfortably in the "strong" range this lesson describes. Treating them as one dollar position is a sound default.
EUR/USD and USD/JPY were much less stable. Their correlation swung from −0.86 to −0.23. In some quarters the yen's own drivers dominated, and the two pairs barely moved against each other. "They usually move opposite" can be badly wrong for months at a time, which is why this lesson tells you to measure correlations, not assume them.
Correlation was highest on the days that matter most. On the biggest dollar-move days, EUR/USD and GBP/USD closed in the same direction 98% of the time; on the quietest days, barely more than half. Quiet days make a set of dollar trades look diversified. Big days, the ones that decide your monthly result, turn them back into one trade. That is the practical case for the currency exposure limit in this lesson.
Common Mistakes
- Counting trades instead of exposures.
- Assuming correlations are fixed. They change, especially in crises.
- Ignoring direction: long one pair and short another can still be the same bet.
- Correlating prices instead of returns.
- 'Hedging' with a correlated pair and paying two spreads for no real reduction in risk.
Professional Insight
Professional risk managers often report exposure by currency rather than by trade: so many dollars short, so many euros long. Translating a book of pairs into net currency exposures makes hidden concentrations obvious at a glance.
Risk Considerations
- Correlations tend to rise in stress, just when diversification is needed.
- Short look-back periods give noisy estimates.
- Event days can move all pairs with a shared currency at once.
Important Terminology
| Term | Meaning |
|---|---|
| Correlation coefficient | A measure from −1 to +1 of how consistently two series move together. |
| Positive correlation | Pairs tend to move in the same direction. |
| Negative correlation | Pairs tend to move in opposite directions. |
| Returns | Percentage price changes, used to measure correlation. |
| Currency exposure | Your net long or short position in one currency across all trades. |
What is currency correlation?
A measure of how consistently two currency pairs move together, from +1 (same direction) to −1 (opposite directions).
Which forex pairs are positively correlated?
Pairs sharing a currency on the same side, such as EUR/USD and GBP/USD, are often positively correlated, though the strength varies.
Which pairs are negatively correlated?
Pairs with a shared currency on opposite sides, such as EUR/USD and USD/CHF, are often negatively correlated.
How do I calculate correlation?
Take daily percentage returns for both pairs over the same period and use a correlation function such as CORREL in a spreadsheet.
Why does correlation matter for risk?
Correlated positions win and lose together, so their combined risk can be much larger than each trade's risk suggests.
Is the correlation between EUR/USD and GBP/USD stable?
Fairly stable in our data: their 60-day correlation of daily returns stayed between 0.72 and 0.91 over about two years. On the biggest dollar-move days they closed in the same direction 98% of the time.
Does EUR/USD always move opposite to USD/JPY?
Usually, but not reliably. Their 60-day correlation ranged from −0.86 to −0.23 over about two years of real data, so in some periods they moved almost independently.
Practical Exercise
Measure a correlation yourself.
Your task
Step 1: Download data
60 daily closes for EUR/USD and GBP/USD.
Step 2: Calculate
Returns, then CORREL over 60 days and over the last 20.
Step 3: Compare
Is the recent correlation stronger or weaker?
Step 4: Apply
If you hold both pairs long at 1% each, what's the combined risk from the chart's formula?
Check Your Understanding
A correlation of −1 means two pairs:
Related Lessons
Previous module: How to Use a Forex Economic Calendar. Next: Top-Down Forex Analysis (01.04.02). See also Portfolio Exposure and Correlation Risk.