
Fundamental Analysis for Forex Traders: A Practical Framework
JustWolves is an educational platform and is not a SEBI-registered investment advisor. Trading financial instruments involves significant risk of loss and may not be suitable for all investors. Past performance is not indicative of future results. Read our full disclaimer →
What you'll learn
- Fundamental analysis builds a directional bias; technical analysis usually times the entry
- The most market-moving indicators are inflation, employment, growth and central bank communication
- Compare data with expectations: the surprise moves price, not the number
- Score each currency's outlook and trade the strong against the weak
- Review your bias regularly; fundamentals change as data arrives
In this article · 15 sections
Technical analysis asks what price is doing. Fundamental analysis asks why it might keep doing it. For currency traders, fundamentals are mostly about comparing two economies and their central banks. You don't need a forecasting model to use them; a simple, repeatable framework is enough to keep you trading in the direction the bigger picture supports.
What You Will Learn
- Which economic indicators matter most for currencies
- How to turn data into a directional bias for a pair
- How to combine a fundamental bias with technical timing
- The traps that catch traders using fundamentals
Before You Start
Read Interest Rates and Inflation first.
The Indicators That Matter
| Indicator | What it measures | Why it matters |
|---|---|---|
| Consumer price index (CPI) | Inflation in consumer prices | Directly shapes interest-rate expectations |
| Employment (e.g. US non-farm payrolls, unemployment rate) | Jobs and wages | Strong labour markets can keep rates higher |
| GDP | Overall economic output | Confirms the growth trend, though it's released with a lag |
| Purchasing managers' indices (PMI) | Business surveys, released early each month | An early read on growth |
| Retail sales | Consumer spending | A key part of growth |
| Trade and current account balance | Flows of goods, services and income | Affects underlying demand for the currency |
| Central bank decisions and speeches | Policy and guidance | Often the biggest single driver |
For India, the most-watched releases include CPI inflation, GDP, industrial production, the trade balance and RBI policy decisions. The site's India economic calendar lists them with dates.
Data vs Expectations
Every major release has a consensus forecast. The market has already priced that forecast in, so what moves price is the surprise: actual minus forecast. A strong number that's weaker than expected can still weaken a currency.
Also watch revisions to the previous figure. A headline beat with a large downward revision to last month can be a weaker report overall, and markets often react to the combination.
Building a Currency Bias
A simple way to organise fundamentals is to score each currency on a few questions and compare the scores for the two currencies in a pair:
- Policy direction: is the central bank expected to raise (+1), hold (0) or cut (−1)?
- Inflation: above target and rising (+1), near target (0), or below and falling (−1)?
- Growth: recent data beating expectations (+1), mixed (0), or missing (−1)?
- Risk sentiment: does today's risk mood favour this currency (+1) or not (−1)?
If one currency scores +3 and the other −2, the fundamental bias favours buying the first against the second. A gap near zero means fundamentals offer no clear edge, and you either trade purely on technicals or not at all. This isn't a forecasting model; it's a checklist that stops you trading against an obvious macro backdrop by accident.
Combining Fundamentals with Technicals
Fundamentals can stay right for months while price moves against you for weeks, so most traders use them for direction and technicals for timing. With a bullish fundamental bias on a pair, you look only for long setups: pullbacks to support in an uptrend, breakouts above resistance. You skip short setups, however good they look.
The Price Action course covers the technical side: trend, structure and support and resistance.
Real Data: A Fundamental Trend With Technical Pullbacks
The chart below uses real EUR/USD prices from January to July 2025, condensed into weekly candles. It covers the first half of a year-long rise and shows why this lesson recommends fundamentals for direction and technicals for timing.
Real data: a fundamental trend with technical pullbacks, EUR/USD weekly, January–July 2025
Step 1 of 4
A base near 1.02–1.05
In January and February 2025 EUR/USD moves sideways between about 1.018 and 1.054, after a long decline in 2024.
- What to observe
- No trend yet.
- Condition
- A fundamental bias would come from the rate and growth outlook for each currency.
Step by Step: A Weekly Fundamental Review
Thirty minutes each weekend
Step 1: Review last week's surprises
Which releases beat or missed forecasts for your currencies?
Step 2: Check central banks
Any decisions, speeches or minutes that changed expectations?
Step 3: Score each currency
Using the four questions above.
Step 4: Rank the pairs
Strongest against weakest gives the clearest bias.
Step 5: Mark next week's events
From the economic calendar, in IST.
Practical Example
Hypothetically, Sameer scores the US dollar +2 (Fed expected to hold high, inflation above target) and the yen −1 (Bank of Japan still accommodative, weak data). The bias favours buying USD/JPY.
On the daily chart USD/JPY is in an uptrend. He waits for a pullback to a support zone and buys there with a stop below it. When a Bank of Japan meeting approaches, he reduces his position, because a policy surprise from Japan could change the score quickly.
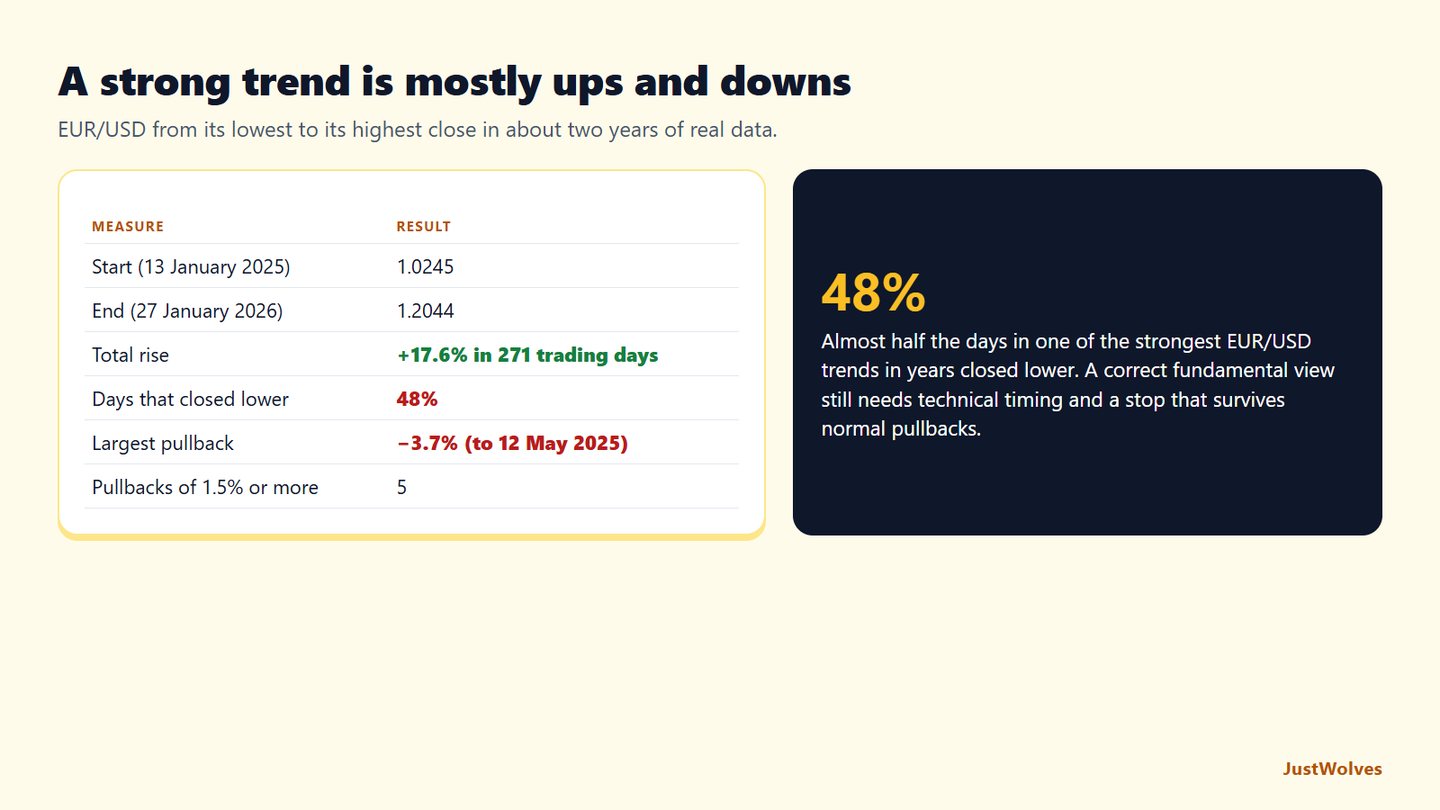
How Smooth Is a Fundamental Trend? Our Data
This lesson warns that fundamentals can stay right for months while price moves against you for weeks. To put numbers on that, JustWolves measured EUR/USD from its lowest daily close to its highest close in about two years of real data (November 2024 to November 2026), the large euro rise that ran through 2025.
| Measure | Result |
|---|---|
| Start | 1.0245 on 13 January 2025 |
| End | 1.2044 on 27 January 2026 |
| Total rise | +17.6% in 271 trading days |
| Days that closed lower | 48% |
| Largest pullback in closes | −3.7% (low on 12 May 2025) |
| Pullbacks of 1.5% or more | 5 |
Even in one of the strongest EUR/USD trends of recent years, nearly half of all days closed lower. A trader who was right about the direction for the whole year still had to sit through five pullbacks of 1.5% or more, the largest 3.7%.
That has two practical consequences, both already in this lesson. First, entries should come from technical timing, buying pullbacks to support rather than whenever the fundamental story feels strong; Sameer waits for a pullback in this lesson's example for exactly this reason. Second, stops must be placed beyond the pullbacks a trend normally makes, which on EUR/USD in this period meant at least 1.5–4% away for a position meant to ride the trend, with the position size reduced to match.
Price data cannot test the scoring method itself, because that requires historical forecasts and data surprises, which are outside our dataset. But it can show the scale of the moves a correct view has to survive.
Common Mistakes
- Trading the headline without comparing it with the forecast.
- Using fundamentals for entries, which leads to buying too early.
- Ignoring what's priced in. Old news doesn't move price.
- Sticking with a stale bias after the data changes.
- Overcomplicating the analysis with too many indicators.
Professional Insight
Professional currency analysts focus on change at the margin: they're less interested in whether an economy is strong than in whether it's getting stronger or weaker than the market expects. That's the part not yet in the price.
Risk Considerations
- Fundamentals can take time to show in price.
- Event risk around releases can stop you out even when your bias is right.
- Unexpected shocks such as geopolitical events can override everything.
Important Terminology
| Term | Meaning |
|---|---|
| Fundamental analysis | Analysing economic and policy factors that affect a currency's value. |
| Consensus forecast | The average economists' expectation for a data release. |
| Surprise | The difference between the actual figure and the forecast. |
| Revision | A change to a previously published figure. |
| Bias | The direction your analysis favours for a pair. |
| CPI / GDP / PMI | Inflation / output / business-survey indicators. |
What is fundamental analysis in forex?
Analysing economic data, interest rates and central bank policy to judge which way a currency pair is likely to move.
Which economic indicators matter most for forex?
Inflation, employment, growth indicators such as GDP and PMI, and central bank decisions and communication.
Can I combine fundamental and technical analysis?
Use fundamentals to decide which direction to favour and technical analysis to time entries in that direction, usually on pullbacks. In our data, even EUR/USD's strong 2025 rise had 48% down days and a 3.7% pullback, so timing and stop placement matter.
Why did the currency fall after good data?
Probably because the data was weaker than expected, or revisions to previous figures were negative.
Do I need fundamentals for short-term trading?
At minimum, know when major releases are due so you aren't caught by them.
How often should I update my fundamental bias?
Review it weekly and after any major release or central bank decision for your currencies. A bias based on last month's data can be wrong today, so note what would change your view and check it before each trading week.
Practical Exercise
Score two currencies and form a bias.
Your task
Step 1: Choose a pair
For example EUR/USD.
Step 2: Score both currencies
On policy, inflation, growth and risk sentiment.
Step 3: Form the bias
Which currency is stronger, and by how much?
Step 4: Check the chart
Does the daily trend agree? If not, note what would change your mind.
Check Your Understanding
What moves price on a data release?
Related Lessons
Previous: Interest Rates and Inflation. Next: How to Use a Forex Economic Calendar (01.03.05). For technical timing, see the Price Action course.