
Price Rejection: Reading Wicks and Failed Moves at Key Levels
JustWolves is an educational platform and is not a SEBI-registered investment advisor. Trading financial instruments involves significant risk of loss and may not be suitable for all investors. Past performance is not indicative of future results. Read our full disclaimer →
What you'll learn
- Rejection is price moving into a level and being pushed back out, usually within one or a few candles
- Long wicks, pin bars and failed breakouts are the common forms
- Location matters more than shape: a rejection at a key level means more than one in the middle of nowhere
- Stops usually go beyond the rejection wick
- Rejection is evidence, not a guarantee; follow-through confirms it
In this article · 17 sections
When price pushes into a level and is quickly driven back, the chart records a visible failure: a long wick, or a breakout that closes back inside. Traders call this price rejection. It's one of the most widely used pieces of evidence in price action because it shows, on the chart, that one side tried and failed. This lesson covers the forms rejection takes, why location matters, and how to trade it.
What You Will Learn
- What price rejection is
- The common forms: wicks, pin bars and failed breakouts
- Why location matters
- How to trade rejection with defined risk
Before You Start
Read What Is Support and Resistance? and Reversals, Momentum and Exhaustion first.
What Rejection Is
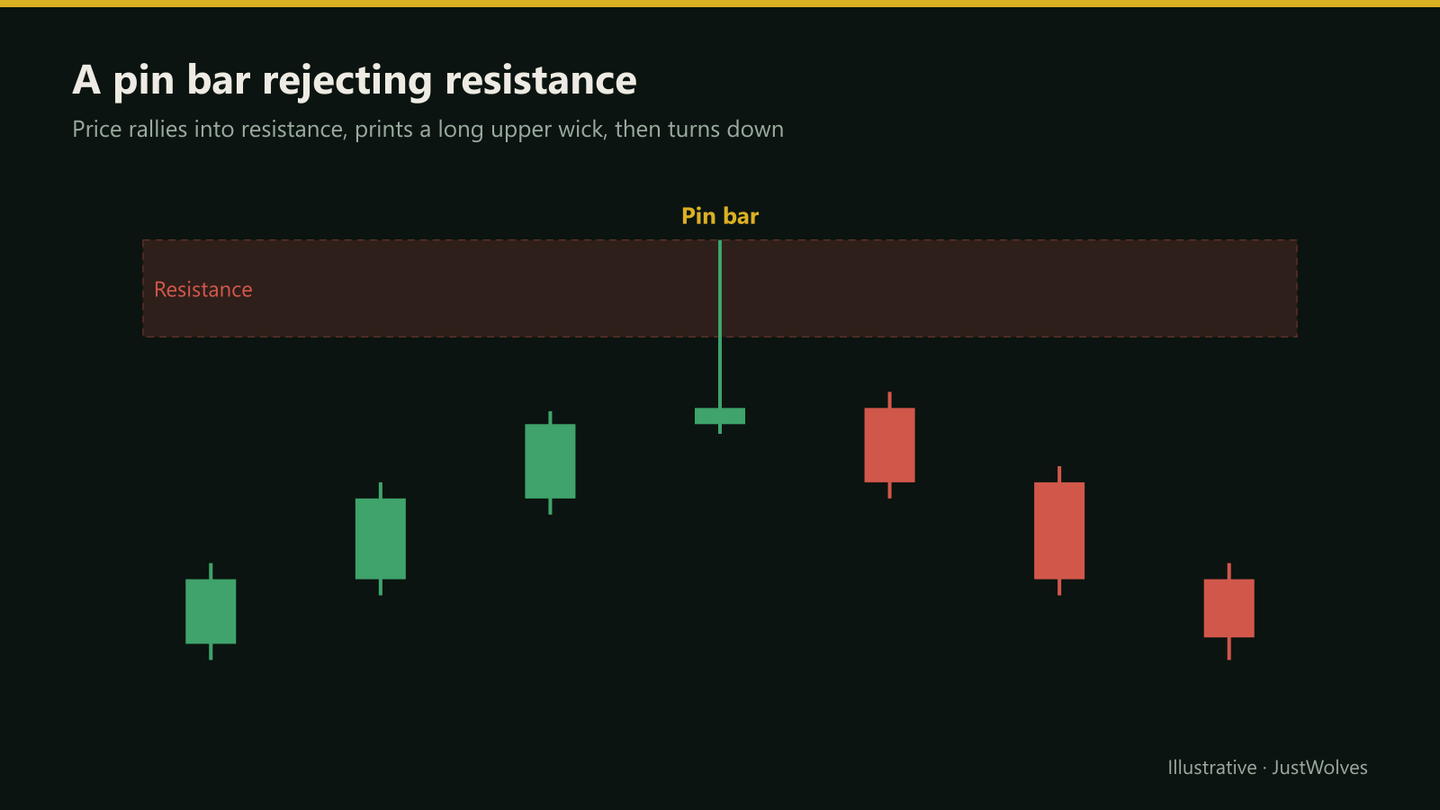
Price rejection is a move into a price area that is quickly reversed, leaving price back where it came from. On a candlestick chart, the clearest record of rejection is the wick: the part of the candle where price traded but didn't stay. A long upper wick at resistance shows that buyers pushed price up and sellers pushed it back down before the close.
Forms of Rejection
| Form | What it looks like | What it suggests |
|---|---|---|
| Long wick | A wick much longer than the body, pointing into a level | Price tested the level and was pushed back |
| Pin bar | Small body at one end, wick at least about twice the body | Strong single-candle rejection |
| Failed breakout | Price breaks a level, then closes back inside within one or a few candles | Breakout traders trapped; possible move the other way |
| Multiple wicks | Several candles with wicks into the same level | Repeated rejection; the level is being defended |
Location Matters Most
A long wick in the middle of a range, away from any level, tells you very little. The same wick at a well-marked resistance level, a supply zone or a prior day's high is much more informative.
Before trading any rejection, ask: rejection of what? If you can't name the level, it isn't a setup.
A Rejection Trade, Step by Step
The chart below follows the practical example in this lesson: the level first, then the pin bar, then an entry that needs follow-through. Step through it and notice that every price in the plan is set by the level or by the candle.
A pin bar into resistance
Step 1 of 5
The level comes first
Two earlier tops at 852 and 850 mark resistance at 848–855. The level is drawn before price returns to it.
- What to observe
- A named level: rejection of what? Of this zone.
- Condition
- Watch price as it approaches.
Real Case: A NIFTY 50 Pin Bar at Resistance
The chart below uses real NIFTY 50 daily candles from June and July 2026. It shows a clean-looking pin bar at a real resistance zone that never triggered, and why requiring follow-through protected the trader even though the market fell later.
Real case: a pin bar at resistance that never triggered, NIFTY 50, July 2026
Step 1 of 5
A resistance zone
Between June and mid-July 2026, NIFTY turns down from about 24,190–24,262 three times: 18 June, 25 June and 13 July. Price did trade above it briefly on 6–7 July before falling back on 8 July.
- What to observe
- A zone, not a perfect line.
- Condition
- Watch for rejection there.
Does Location Make Rejection Work? Our Test
This lesson's practical exercise asks you to compare pin bars at marked levels with pin bars in open space. JustWolves ran that comparison on real data: about six months of 1H candles and two years of daily candles for NIFTY 50, EUR/USD, GBP/USD, USD/JPY and gold, with bullish pin bars tested on mirrored prices.
Pin bar: an upper wick at least twice the body and at least half the candle's range, a close in the bottom third, and a range at least as large as the average candle. At a level: the wick's high within 0.3 average candle ranges of a five-candle swing high from the previous 100 candles. Follow-through: where price closed three candles later.
| Pin bar | Cases | Lower 3 candles later | Average move in the rejection direction |
|---|---|---|---|
| 1H, at a prior swing high | 252 | 48% | −0.17 candle ranges |
| 1H, in open space | 414 | 47% | −0.26 candle ranges |
| Daily, at a prior swing high | 40 | 55% | +0.04 candle ranges |
| Daily, in open space | 52 | 60% | +0.24 candle ranges |
Pin bars at levels did not follow through more often than pin bars in open space, and on 1H charts neither group beat a coin flip. On average, 1H pin bars were followed by a small move against the rejection. The daily samples were too small to read much into.
This is an uncomfortable result for one of the most popular patterns in price action, and it matches our other tests: single candles (see What Is Price Action Trading?) and levels on their own (see What Is Support and Resistance?) did not predict the next move. What a rejection candle does give you is structure for the trade: a clear invalidation point beyond the wick, and an entry that can wait for follow-through. That is how this lesson's example uses it, and it is how the Professional Insight below describes it: the rejection is the trigger, not the reason.
Step by Step: Trading a Rejection
Bearish rejection at resistance
Step 1: Level first
Mark resistance before price arrives.
Step 2: Wait for the candle to close
A wick can disappear before the close.
Step 3: Judge quality
Wick into the level, close in the lower part of the range.
Step 4: Entry
Below the rejection candle's low, or on a retrace into the wick.
Step 5: Stop and target
Stop above the wick's high; target the next support.
Rejection on Different Timeframes
A daily pin bar contains a whole sequence of lower-timeframe candles: a push into the level, a stall, and a move back out. You can often enter earlier, with a tighter stop, by watching that sequence on the hourly or 15-minute chart as it happens, provided the daily level is clear.
The reverse also applies. A long wick on a 5-minute chart can be meaningless noise on the daily chart. Give more weight to rejections on the timeframe where you marked the level, and use lower timeframes only to refine the entry, never to override the higher-timeframe picture.
Practical Example
Hypothetically, a bank stock has resistance at ₹848–₹855 from two earlier tops. It rallies to ₹856 intraday, then closes the day at ₹836. The candle has a ₹20 upper wick and a ₹4 body near its low: a pin bar into resistance.
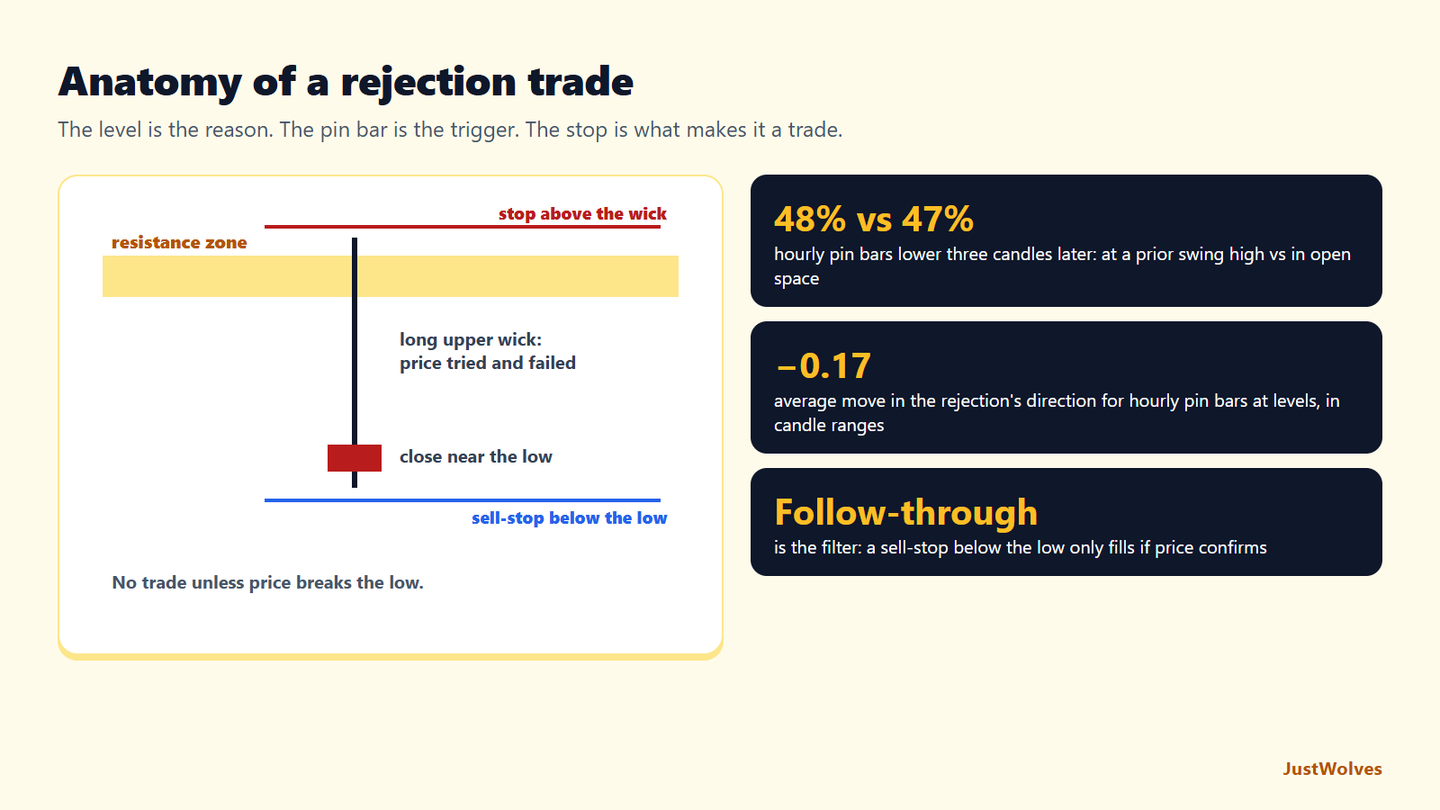
Rohan places a sell-stop below the candle's low at ₹831. It triggers the next day. His stop is at ₹859, above the wick, and his target is ₹790, the next support: ₹28 of risk for ₹41 of reward.
Three Ways to Enter a Rejection
| Entry | How | Trade-off |
|---|---|---|
| Close of the rejection candle | Sell at the close | Earliest; no follow-through required |
| Break of the candle's low | Sell-stop just below the low | Needs follow-through; fewer fills, worse price |
| Retrace into the wick | Sell limit halfway up the wick | Better price and tighter stop; many orders never fill |
The sell-stop below the low, used in this lesson's example, is the most conservative of the three. It only fills if price moves in the rejection's direction, so trades where the rejection immediately fails are never entered. Given how weak follow-through was in our data, waiting for that confirmation is a sensible default for beginners.
Failed Breakouts: Rejection over Several Candles
Not every rejection fits in one candle. A failed breakout is rejection spread over two or three candles: price closes above a level, then closes back below it soon after. Our range study found that about four in ten breakouts from 1H ranges closed back inside within three candles (Consolidation and Trading Ranges). Traders who fade failed breakouts use the high of the failed move as their stop, exactly as with a pin bar's wick.
Common Mistakes
- Trading wicks with no level behind them.
- Acting before the candle closes.
- Stops inside the wick, where the next test can reach.
- Ignoring the trend: rejection against a strong trend fails more often.
- Assuming every wick is rejection; some are just volatility.
Professional Insight
Many experienced traders treat rejection as the trigger, not the reason. The reason is the level and the context; the rejection candle is simply the moment that shows the level is being defended right now.
Risk Considerations
- Long wicks mean wide stops; size the position accordingly.
- Rejections can be overrun on the next candle.
- Gaps can open beyond the wick.
Important Terminology
| Term | Meaning |
|---|---|
| Rejection | A move into a level that is quickly reversed. |
| Wick | The part of a candle outside its body. |
| Pin bar | A candle with a small body and a long wick on one side. |
| Failed breakout | A break of a level that quickly closes back inside. |
| Follow-through | Price continuing in the rejection's direction afterward. |
What is price rejection in trading?
A move into a price level that is quickly pushed back, usually shown by a long wick or a failed breakout.
What is a pin bar?
A candle with a small body at one end and a long wick, roughly twice the body or more, showing strong rejection of a price area.
Where should the stop go on a rejection trade?
Usually beyond the extreme of the rejection wick, with a small buffer.
Does every long wick mean rejection?
No. Wicks away from any meaningful level often just reflect volatility.
How do I confirm a rejection?
Wait for the candle to close, then look for follow-through, such as the next candle breaking the rejection candle's low or high.
Are pin bars at support and resistance more reliable?
Not in our data. On real 1H charts, bearish pin bars at a prior swing high closed lower three candles later 48% of the time, against 47% for pin bars in open space. Use them for defined risk and require follow-through before entering.
What happens if price breaks above a pin bar before the entry triggers?
The setup is invalid and the order should be cancelled. In a real NIFTY example from July 2026, a pin bar at resistance was followed two days later by a rally above its high; the sell-stop below the low never filled. The index fell later, but not on the pin bar's timing.
Practical Exercise
Collect twenty rejection candles.
Your task
Step 1: Find twenty pin bars
Ten at marked levels and ten in open space.
Step 2: Record follow-through
Did the next three candles move in the rejection's direction?
Step 3: Compare
Did the at-level group follow through more often in your sample?
Check Your Understanding
A long upper wick at resistance suggests:
Related Lessons
Previous: Reversals, Momentum and Exhaustion. Next: Wick Theory. See also Liquidity Sweeps in the SMC course.