
Supply and Demand Zones: How to Find and Trade Them
JustWolves is an educational platform and is not a SEBI-registered investment advisor. Trading financial instruments involves significant risk of loss and may not be suitable for all investors. Past performance is not indicative of future results. Read our full disclaimer →
What you'll learn
- A demand zone is the base a strong rally started from; a supply zone is the base a strong drop started from
- Four patterns: rally-base-rally and drop-base-rally (demand), drop-base-drop and rally-base-drop (supply)
- Strong zones have a sharp departure, a short base and haven't been revisited
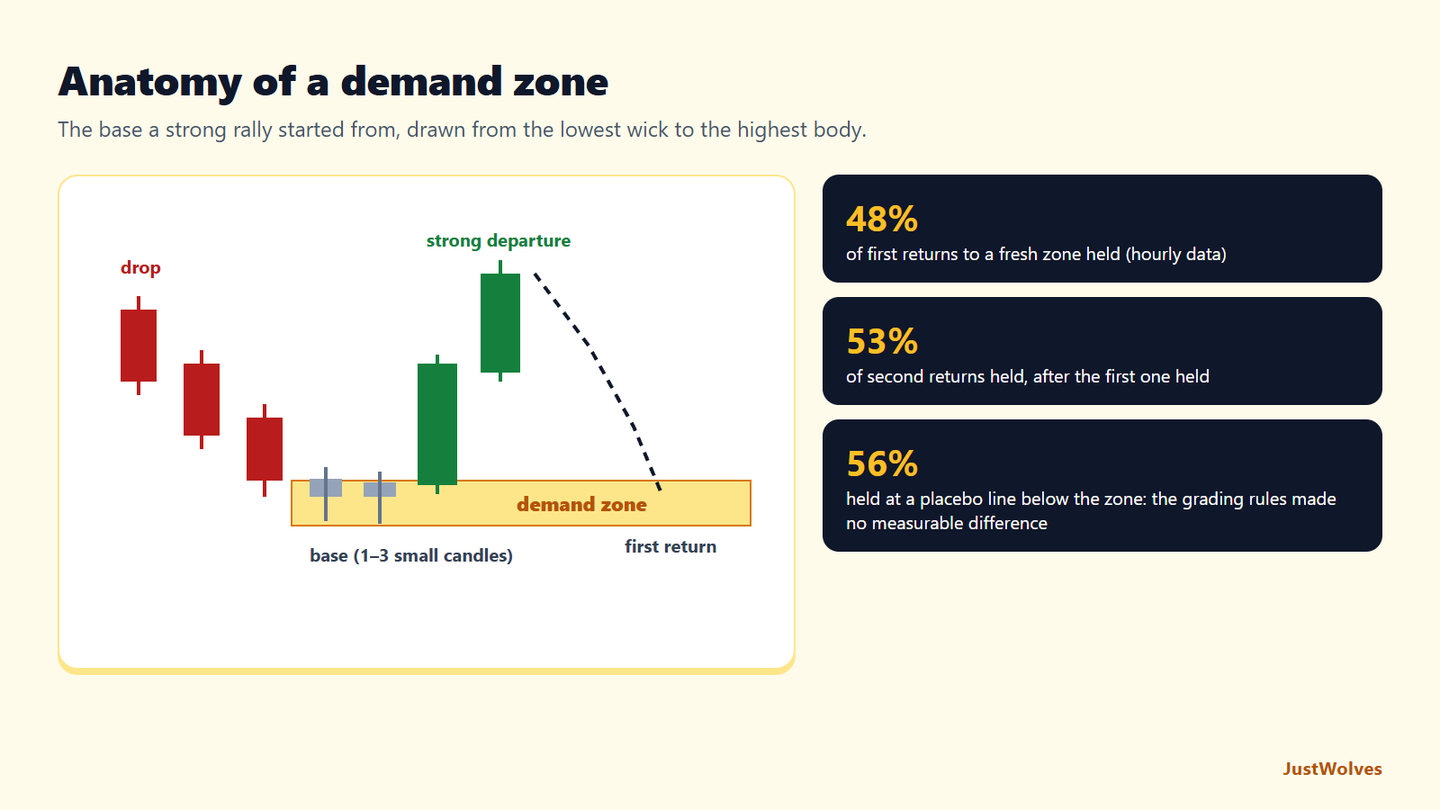
- Draw the zone around the base candles, wick to body
- Each return to a zone tends to weaken it; first returns are usually preferred
In this article · 18 sections
Supply and demand zones are a close cousin of support and resistance, with one key difference: instead of looking for places price has turned several times, you look for the place a strong move started. The idea is that a sharp departure from a small base shows an imbalance between buyers and sellers there, which may still be relevant when price returns. This lesson shows how to find, draw, grade and trade these zones.
What You Will Learn
- What supply and demand zones are
- The four base patterns
- How to draw zones and judge their strength
- How to plan trades from zones
Before You Start
Read How to Draw Support and Resistance first. If you've done the SMC course, Supply and Demand Zones vs Order Blocks compares the two approaches.
Supply and Demand
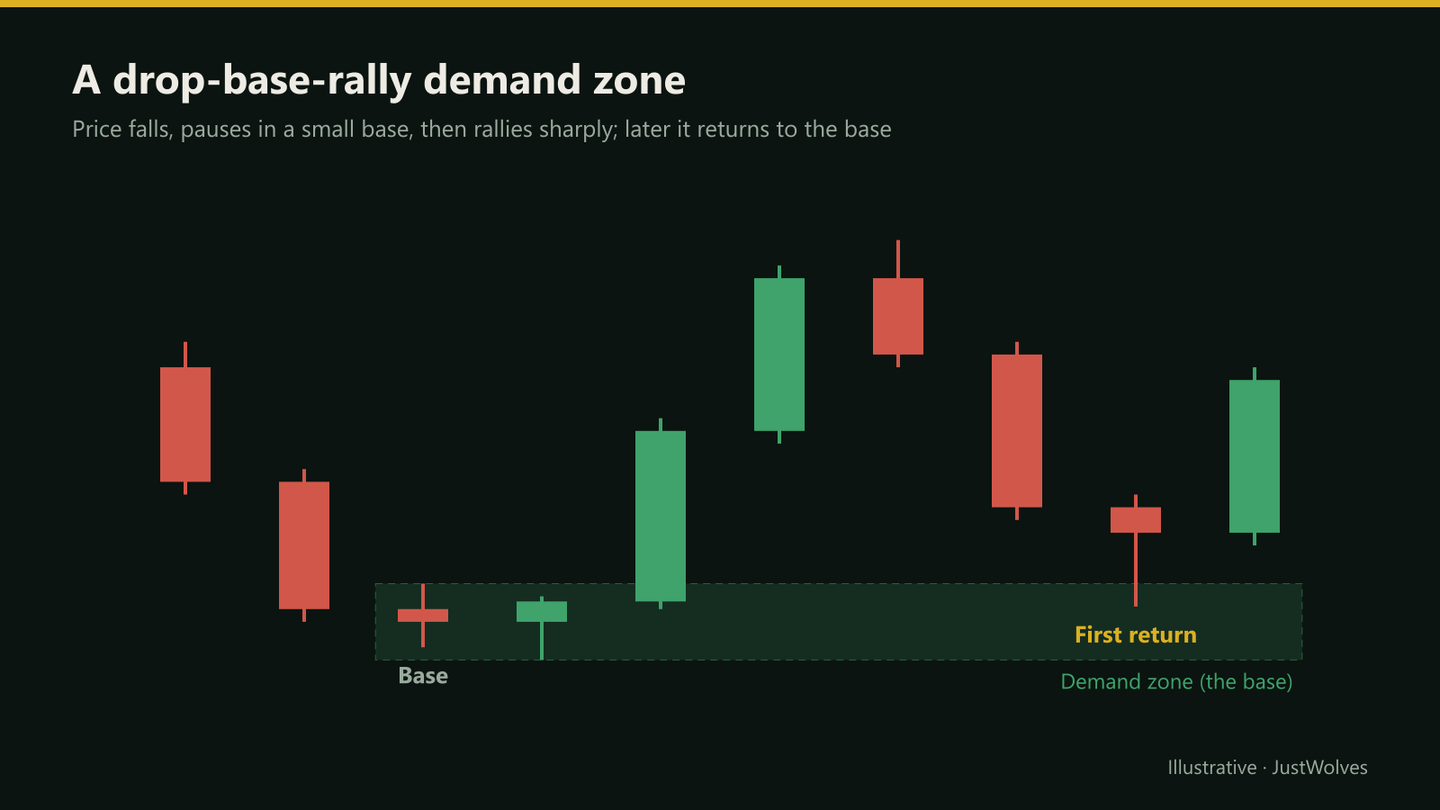
- Demand zone: the area where price paused (a 'base' of one or more small candles) before a strong move up. It's treated as an area where buying overwhelmed selling.
- Supply zone: the base before a strong move down, where selling overwhelmed buying.
Four Base Patterns
| Pattern | Type | Character |
|---|---|---|
| Rally-base-rally (RBR) | Demand | Continuation in an uptrend |
| Drop-base-rally (DBR) | Demand | Reversal from a fall |
| Drop-base-drop (DBD) | Supply | Continuation in a downtrend |
| Rally-base-drop (RBD) | Supply | Reversal from a rise |
Drawing the Zone
Demand zone
Step 1: Find the strong move
Large candles moving away sharply from a small pause.
Step 2: Identify the base
The small candles just before the move, usually one to four.
Step 3: Outer edge
The lowest wick of the base.
Step 4: Inner edge
The highest body of the base (some traders use the highest wick).
Step 5: Extend it right
Until price returns to it.
Grading Zone Strength
- Departure: how sharply and far price moved away. Strong, large-bodied candles suggest a significant imbalance.
- Base length: short bases (one to three candles) are usually preferred over long, drawn-out ones.
- Freshness: a zone price hasn't returned to yet is 'fresh'. Each revisit tends to weaken it.
- Location: demand zones in an uptrend, or at major support on a higher timeframe, are stronger.
Zones Inside the Bigger Picture
A zone on its own is only half the picture. Check the trend first: in an uptrend, demand zones are the places to look for longs, and supply zones are mainly targets. Then check the higher timeframe: a 1-hour demand zone that sits inside a daily demand zone is stronger than one sitting just under daily resistance. Finally, check the path to your target. If another supply zone sits halfway between your entry and target, either take profit before it or skip the trade, because the reward you're counting on may not be available.
Trading a Zone
- Entry: a limit order at the inner edge of the zone, or wait for a reaction candle inside it.
- Stop: beyond the outer edge, with a buffer.
- Target: the opposing zone or the next significant level; at least 2R is common.
A Demand Zone, Step by Step
The chart below follows the practical example in this lesson: the drop, the base, the rally that confirms the zone, the plan made in advance, and the first return. Notice how the target was set before the opposing supply zone, and how small the risk was compared with the reward.
Drop, base, rally: finding and trading a demand zone
Step 1 of 6
The drop
The stock falls from 620 to 548 in four strong candles.
- What to observe
- Sellers in control.
- Condition
- Nothing to do yet.
Real Case: A Demand Zone on NIFTY 50
The chart below uses real NIFTY 50 hourly candles from October 2026. Step through it to see a rally-base-rally demand zone form, drawn by this lesson's rules, and its first return.
Real case: a rally-base-rally demand zone, NIFTY 50 hourly, October 2026
Step 1 of 4
A rally, then a pause
On 13 October 2026 NIFTY opens with a strong hourly rally from 22,289 to 22,581, then pauses for a few hours. The 13:15 candle is small: a base.
- What to observe
- A strong move, then small candles.
- Condition
- Wait to see if the next move leaves the base sharply.
Which Zones Held? Our Test
JustWolves tested this lesson's grading rules on about six months of real 1H candles for NIFTY 50, EUR/USD, GBP/USD, USD/JPY and gold, with supply zones tested on mirrored prices.
Zone: a strong candle (body more than twice the recent average) closing beyond the previous five highs, with a base of one to four small candles (bodies less than half the average) right before it. The zone ran from the base's lowest wick to its highest body. Departure: how far price moved beyond the zone in the next three candles, in average candle ranges. Held: on a return to the zone, price bounced one average range before closing below the zone. As a control, we tested a placebo line one and a half average ranges below the zone.
| Zone | Cases | Held |
|---|---|---|
| First return to a fresh zone | 279 | 48% |
| Second return (after the first held) | 111 | 53% |
| Strong departure (3+ average ranges) | 86 | 50% |
| Weaker departure | 193 | 48% |
| Short base (1–2 candles) | 243 | 48% |
| Longer base (3–4 candles) | 36 | 50% |
| Placebo line below the zone | 160 | 56% |
None of the grading rules made a measurable difference in this sample. Fresh zones did not hold more often than zones on their second return; strong departures did not beat weaker ones; short bases did not beat longer ones. And none of the zone types beat the placebo line.
This is consistent with our other tests. In the Smart Money Concepts course, single-candle order blocks held on their first revisit 60% of the time, compared with 53% for wider bases (Supply and Demand Zones vs Order Blocks), and horizontal support and resistance levels also held no more often than placebo lines (What Is Support and Resistance?).
So why trade zones at all? Because of what the practical example shows: a zone gives a precise place for a limit entry and a stop just beyond it, which can produce a reward several times the risk. The edge, if there is one, comes from reward-to-risk and context, not from the zone being likely to hold. A trade that risks 13 to make 69 only needs to work about one time in six to break even before costs.
Practical Example
Hypothetically, a metals stock drops from ₹620 to ₹548, pauses for two days between ₹545 and ₹552, then rallies in large candles to ₹640: a drop-base-rally. Neel marks a demand zone at ₹544–₹551.
Three weeks later, the stock pulls back to ₹552. Neel places a buy limit at ₹551 with a stop at ₹538 and a target of ₹620, just below a supply zone at ₹625–₹635. That's ₹13 of risk for ₹69 of reward. It's the first return to a fresh zone in an uptrend.
Reward-to-Risk Decides How Often You Must Be Right
Because zones held only about half the time in our data, the reward-to-risk of each trade matters more than the grade of the zone. The table shows the win rate needed to break even at different reward-to-risk ratios, before costs.
| Reward-to-risk | Break-even win rate |
|---|---|
| 1 : 1 | 50% |
| 2 : 1 | 33% |
| 3 : 1 | 25% |
| 5 : 1 | 17% |
A zone trade with a 1-to-1 target needs the zone to hold more than half the time just to break even, which our data suggests is unlikely. A trade with a 3-to-1 target needs only one win in four. That is why this lesson asks for at least 2R and for targets before the next opposing zone: the reward has to be there for the method to make sense.
Zones Across Timeframes
A daily demand zone often contains several smaller 1H zones. The usual approach is to mark the daily zone first, then look inside it for a smaller zone on your trading timeframe to place a tighter entry and stop. This gives the context of the larger zone with the risk of the smaller one.
Be careful with the stop, though. If you trade the smaller zone, the stop goes below it, which may still be inside the larger daily zone. Price can trade through your small zone and still respect the daily zone. Decide in advance which zone your trade depends on, and place the stop beyond that one.
Common Mistakes
- Marking zones without a strong departure.
- Wide zones from long, messy bases.
- Trading zones that have been revisited several times.
- Demand zones in strong downtrends without other evidence.
- Targets beyond the next opposing zone.
Professional Insight
Supply and demand trading puts a name on something experienced traders watch anyway: where a decisive move began. Its usefulness comes from the grading rules, which give you a consistent way to choose a few zones out of many. Write your rules and test them like any other method.
Risk Considerations
- Zones fail, especially against the trend.
- Limit entries sometimes don't fill.
- Gaps can open through zones.
Important Terminology
| Term | Meaning |
|---|---|
| Demand zone | The base a strong rally started from. |
| Supply zone | The base a strong drop started from. |
| Base | A small group of candles where price paused. |
| Fresh zone | A zone price hasn't returned to yet. |
| Departure | The strength of the move away from the base. |
What is a demand zone?
The base of small candles a strong rally started from, treated as an area where buying overwhelmed selling.
What is the difference between supply and demand zones and support and resistance?
Support and resistance focus on repeated turning points; supply and demand zones focus on where a strong move began.
How do I draw a supply and demand zone?
Around the base candles before the strong move, from the extreme wick to the nearest body.
What makes a zone strong?
A sharp departure, a short base, freshness, and a good location relative to the trend and higher-timeframe levels.
How many times can a zone be traded?
Many traders prefer only the first return, since zones tend to weaken with each revisit, and stop marking a zone once price has closed through it.
Are fresh supply and demand zones better?
Not in our data. On real 1H charts, fresh zones held on their first return 48% of the time, while zones that had already held once held on their second return 53% of the time. Test the freshness rule on your own market before relying on it.
Do supply and demand zones work?
As a way to plan entries and stops, yes. In our test, zones held about half the time, no more often than a placebo line. Their value comes from the precise entry and stop they give, which allows rewards of two or three times the risk.
What does a real demand zone look like?
In a real NIFTY example from October 2026, a single small hourly candle between two strong rallies formed a demand zone at 22,522–22,582. Price returned to it the next day, held, and rallied about 600 points.
Practical Exercise
Grade ten zones.
Your task
Step 1: Find ten zones
On daily charts of liquid stocks.
Step 2: Grade each
Departure, base length, freshness and location.
Step 3: Track the first return
Did price react, and how far did it go?
Step 4: Compare
Did higher-graded zones react better in your sample?
Check Your Understanding
A drop-base-rally forms a:
Related Lessons
Previous: Trendlines and Price Channels. Next: Pivot Points and Round Numbers. See also Supply and Demand Zones vs Order Blocks.