
Pivot Points and Round Numbers as Support and Resistance
JustWolves is an educational platform and is not a SEBI-registered investment advisor. Trading financial instruments involves significant risk of loss and may not be suitable for all investors. Past performance is not indicative of future results. Read our full disclaimer →
What you'll learn
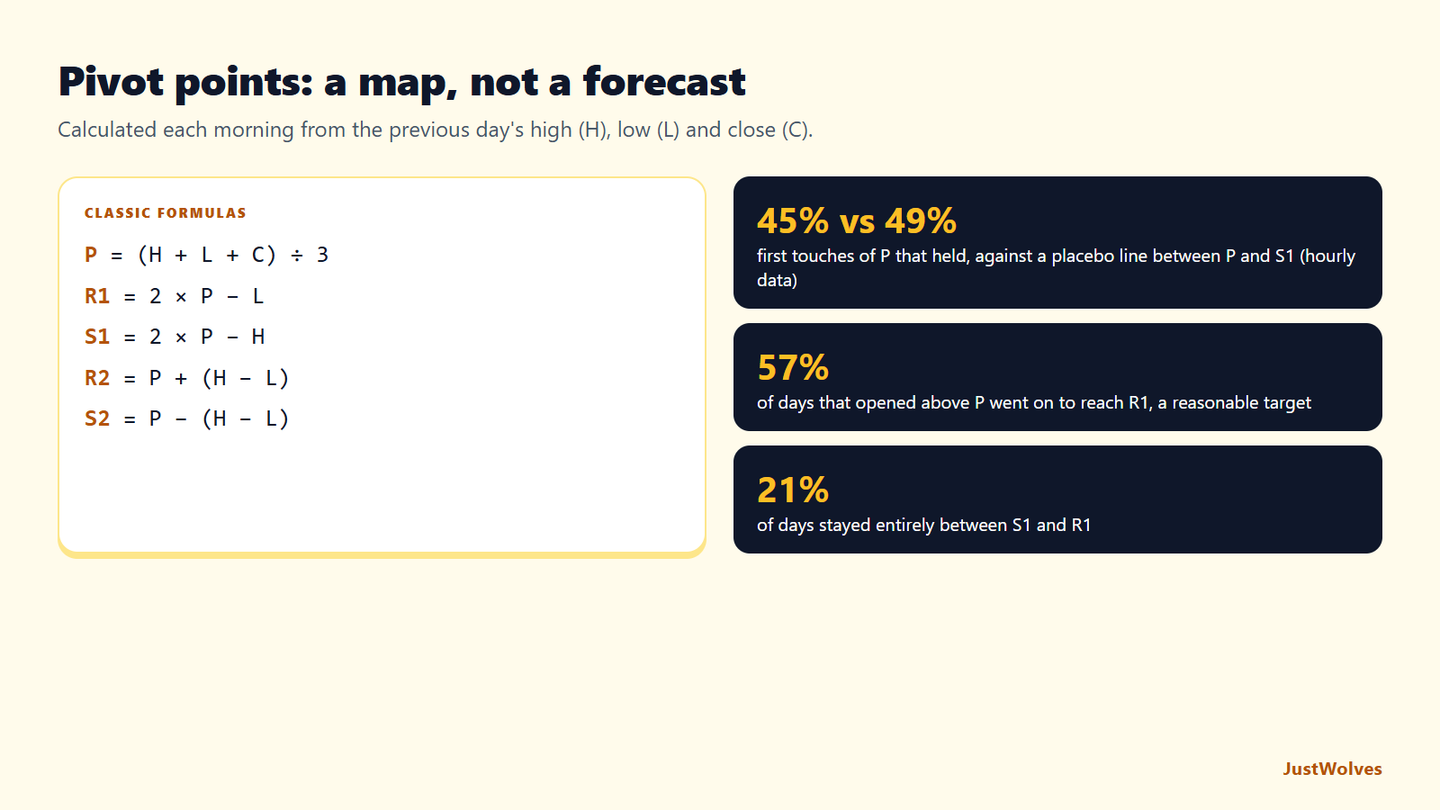
- Classic pivots come from the previous day's high, low and close: P = (H + L + C) ÷ 3
- R1 = 2P − L, S1 = 2P − H, R2 = P + (H − L), S2 = P − (H − L)
- Intraday traders use pivots as reference levels: above P is a mildly bullish backdrop, below P mildly bearish
- Round numbers, such as Nifty 24,000 or ₹1,000 on a stock, attract orders and often act as levels
- Both work best when they line up with real price structure
In this article · 16 sections
Not every level comes from looking left on a chart. Pivot points are calculated from yesterday's prices and give intraday traders a fresh set of reference levels every morning. Round numbers are even simpler: prices like 24,000 on Nifty or ₹1,000 on a stock that people naturally focus on. This lesson explains how both work and how to use them alongside the levels you draw yourself.
What You Will Learn
- How classic pivot points are calculated
- How traders use pivot levels intraday
- Why round numbers act as support and resistance
- How to combine both with price structure
Before You Start
Read Supply and Demand Zones and How to Draw Support and Resistance first.
Classic Pivot Points
Using the previous day's high (H), low (L) and close (C):
| Level | Formula |
|---|---|
| Pivot (P) | (H + L + C) ÷ 3 |
| Resistance 1 (R1) | 2 × P − L |
| Support 1 (S1) | 2 × P − H |
| Resistance 2 (R2) | P + (H − L) |
| Support 2 (S2) | P − (H − L) |
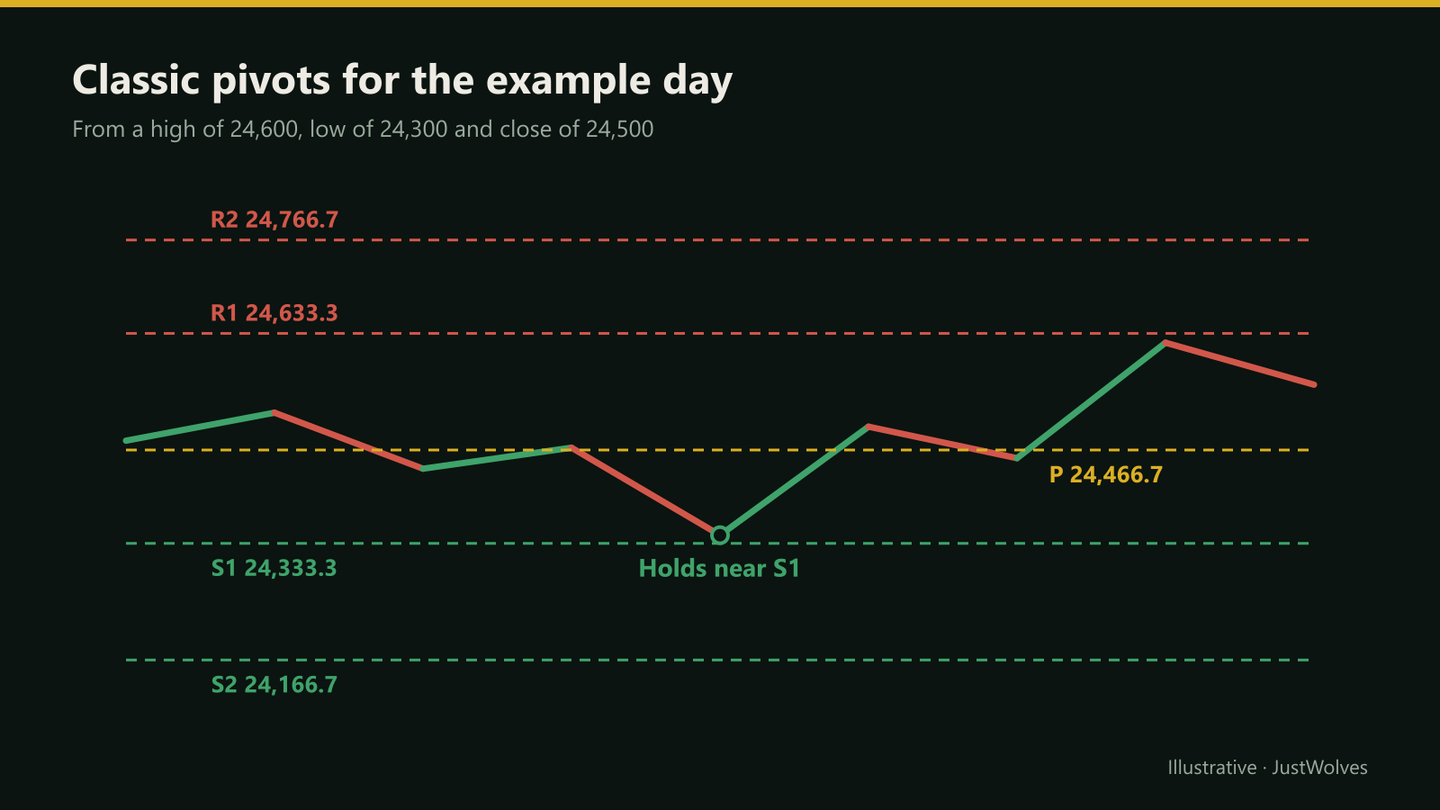
Example: if yesterday's Nifty high was 24,600, low 24,300 and close 24,500, then P = 24,466.7, R1 = 24,633.3, S1 = 24,333.3, R2 = 24,766.7 and S2 = 24,166.7. The site's pivot points calculator does this for you, including other variants such as Fibonacci and Camarilla pivots.
How Pivots Are Used
- Bias: trading above P is often treated as a mildly bullish backdrop for the day; below P, mildly bearish.
- Targets: long from near P or S1, targeting R1; short from near P or R1, targeting S1.
- Confluence: a pivot that lines up with a horizontal level, a round number or yesterday's high or low is more meaningful than a pivot alone.
- Range days vs trend days: on quiet days price often oscillates between S1 and R1; on trend days it can run straight through several levels.
The same formulas can be applied to the previous week or month to give weekly and monthly pivots, which swing traders sometimes use as broader reference levels.
Real Case: Pivots on NIFTY 50, 5 June 2026
The chart below calculates the classic pivots from NIFTY 50's real daily candle on 4 June 2026 and shows the next day hour by hour. It was one of the days when pivots looked perfect: price tested R1 in the first hour and S1 by the afternoon.
Real case: a day between S1 and R1, NIFTY 50 hourly, 5 June 2026
Step 1 of 5
The previous day
On 4 June 2026 NIFTY's daily candle has a high of 23,465, a low of 23,247 and a close of 23,417.
- What to observe
- Yesterday's high, low and close are all the pivots need.
- Condition
- Calculate before the open.
Round Numbers
Prices ending in round figures, such as Nifty at 24,000 or 25,000, Bank Nifty at 52,000, a stock at ₹500 or ₹1,000, or EUR/USD at 1.1000, attract attention. Traders place orders, stops and targets at them, and options open interest often clusters at round strikes, so price frequently pauses or reacts near them.
As with any level, treat a round number as a zone: Nifty might react at 23,980 or 24,030 rather than exactly 24,000. Stops placed exactly at round numbers are vulnerable to brief spikes through them.
The Level Map on One Chart
The chart below follows the practical example in this lesson. Step through it to see how pivots, an earlier support zone and a round number combine into two confluence zones, and how the trade uses them for location and target.
A morning level map in action
Step 1 of 5
Calculate the pivots
From yesterday's high (24,600), low (24,300) and close (24,500): P = 24,467, R1 = 24,633, S1 = 24,333. R2 and S2 (24,767 and 24,167) are off this chart.
- What to observe
- Three reference levels before the open.
- Condition
- Next, add structure.
Do Pivots and Round Numbers Work? Our Test
JustWolves tested classic daily pivots and round numbers on about six months of real 1H candles for NIFTY 50, EUR/USD, GBP/USD, USD/JPY and gold. Pivots were calculated from each previous day's high, low and close. On the first touch of P or S1 from above each day, the level held if price bounced one average candle range, and broke if a candle closed clearly through it. As controls, we used a placebo line halfway between P and S1, and, for round numbers, the half-way prices between them.
| Line | Cases | Held |
|---|---|---|
| Pivot P | 200 | 45% |
| S1 | 237 | 42% |
| Placebo: halfway between P and S1 | 295 | 49% |
| Round numbers (Nifty 100s, FX 100 pips, JPY 1.00, gold $50) | 923 | 41% |
| Half-way prices between round numbers | 1,575 | 41% |
Neither pivots nor round numbers held more often than the control lines. That fits the warning already in this lesson: pivots are arithmetic on yesterday's prices, and their value comes from being an objective map, not from any power to turn price.
We also checked the two most common pivot rules of thumb:
| Rule | What we found |
|---|---|
| Above P = bullish backdrop | When the first hour closed above P, the day finished above the first hour's close only 51% of the time; below P, 50% finished lower |
| Quiet days stay between S1 and R1 | The whole day stayed between S1 and R1 on 21% of days |
| R1 as a target on days above P | Price reached R1 on 57% of those days, and R2 on 25% |
The bias rule did not hold up: being above P in the first hour said nothing useful about the rest of the day. Only about one day in five stayed inside S1 and R1, so most days trade through at least one of them. But R1 was reached on more than half of the days that started above P, and R2 on a quarter. That supports using pivots as this lesson's example does: as realistic intraday targets and reference points, with the trade itself based on structure.
Step by Step: Morning Level Map
Before the open
Step 1: Calculate pivots
P, R1, S1, R2, S2 from yesterday's high, low and close.
Step 2: Add structure
Yesterday's high and low, and your key support and resistance zones.
Step 3: Add round numbers
The nearest ones above and below.
Step 4: Find confluence
Levels within a few points of each other form your main zones.
Step 5: Plan
Which zone would you buy, which would you sell, and where would you be wrong?
Practical Example
Using the example pivots, Lakshman notes that S1 at 24,333 sits close to a previous support zone at 24,320–24,340, while R1 at 24,633 is just below the round number 24,650 and yesterday's intraday swing high.
In the morning, Nifty futures dip to 24,338 and form a bullish rejection on the 5-minute chart. He buys at 24,355 with a stop at 24,300, targeting 24,620, just under R1 and the round number: 55 points of risk for 265 points. He's using the pivots for location and targets, not as the reason for the trade.
Other Pivot Variants
The classic formula is the most widely used, but several variants exist. They all start from the previous period's high, low and close and differ in how far apart they place the levels.
| Variant | How it differs | Typical use |
|---|---|---|
| Classic (floor) | P = (H + L + C) ÷ 3; R1/S1 from 2P | General intraday reference |
| Fibonacci | Levels at 38.2%, 61.8% and 100% of the previous range from P | Wider spacing |
| Camarilla | Several closely spaced levels around the previous close | Range-day fading |
Pivots and Round Numbers in Indian Markets
For Nifty and Bank Nifty futures, pivots are usually calculated from the previous day's regular session (9:15 am to 3:30 pm IST). A gap at the open can place the day's start beyond R1 or S1 before any trading happens, so check where the open sits relative to the levels before using them.
Round numbers on Indian indices often coincide with large options open interest at round strikes, such as every 100 or 500 points on Nifty. Some traders watch these strikes closely around weekly expiry. Our test did not find round numbers holding more often than half-way prices, so treat them like any other level: a place to plan, not a reason to expect a reversal.
Common Mistakes
- Trading every pivot touch.
- Using too many pivot variants at once.
- Ignoring trend days, when pivots are run over.
- Stops exactly at round numbers.
- Using daily pivots for multi-week swing trades.
Professional Insight
Floor traders used pivots long before electronic charts, as a quick way to set the day's reference levels. Today their main value is the same: an objective map prepared in a minute before the open. Most experienced intraday traders weight them below price structure, and use them mainly where the two agree.
Risk Considerations
- Gap opens can start the day beyond several pivots.
- Trend days ignore intraday levels.
- Round-number spikes can trigger tight stops.
Important Terminology
| Term | Meaning |
|---|---|
| Pivot point (P) | The average of the previous day's high, low and close. |
| R1 / R2 | Calculated resistance levels above the pivot. |
| S1 / S2 | Calculated support levels below the pivot. |
| Round number | A price ending in round figures that attracts attention. |
| Confluence | Several levels close together. |
How are pivot points calculated?
The classic pivot is (high + low + close) ÷ 3 of the previous day; R1 = 2P − low, S1 = 2P − high, R2 = P + range, S2 = P − range.
How do traders use pivot points?
As intraday reference levels for bias, entries and targets, especially where they line up with other levels.
Do pivot points work for Nifty?
Many intraday Nifty and Bank Nifty traders use them as reference levels. They work best alongside real price structure.
Do round numbers act as support and resistance?
They are widely watched: traders place orders, stops and targets at them, and options open interest often clusters at round strikes. But in our test on real 1H charts, round numbers held 41% of the time on a touch, exactly the same as the half-way prices between them. Use them for planning and avoid placing stops exactly on them.
Which pivot type is best?
Classic pivots are the most widely watched. Choose one type and use it consistently.
Do pivot points work?
As a planning map, yes; as turning points, not in our data. On real 1H charts, P and S1 held on their first touch 45% and 42% of the time, compared with 49% for a placebo line between them. Price did reach R1 on 57% of days that started above P, which makes it a reasonable target.
What does a good pivot day look like?
On 5 June 2026, NIFTY tested R1 (23,506) in its first hour, fell to within 5 points of S1 (23,288) by the afternoon and closed near P. Days like this stay roughly between S1 and R1 about one time in five; on other days price runs through the levels.
Practical Exercise
Build tomorrow's level map.
Your task
Step 1: Calculate pivots
From today's Nifty high, low and close.
Step 2: Add yesterday's high and low
And the nearest round numbers.
Step 3: Mark confluence
Levels within 20 points of each other.
Step 4: Review tomorrow
Which levels did price react to?
Check Your Understanding
The classic pivot is:
Related Lessons
Previous: Supply and Demand Zones. Next module: Price Behaviour, starting with Consolidation and Trading Ranges. See also the Day Trading course.