
Dynamic Support and Resistance: Using Moving Averages
JustWolves is an educational platform and is not a SEBI-registered investment advisor. Trading financial instruments involves significant risk of loss and may not be suitable for all investors. Past performance is not indicative of future results. Read our full disclaimer →
What you'll learn
- A moving average smooths price; in trends, price often pulls back to it and resumes
- SMA weights all periods equally; EMA weights recent prices more and reacts faster
- Common periods: 20 for short-term trend, 50 for medium, 200 for long-term
- Use the slope and price's position relative to the average to judge trend
- Moving averages lag and whipsaw in ranges; use them with horizontal levels, not instead of them
In this article · 18 sections
Horizontal support and resistance stay at fixed prices. In a trending market, though, pullbacks often stop at a level that moves with price. A moving average is the simplest way to draw that moving level. This lesson explains how moving averages work, which ones traders watch, and how to use them as dynamic support and resistance without over-relying on them.
What You Will Learn
- What a moving average is and how SMA and EMA differ
- Which periods traders commonly watch
- How to use moving averages for trend and pullbacks
- Their limitations
Before You Start
Read How to Draw Support and Resistance first.
What a Moving Average Is
A moving average (MA) is the average closing price over a set number of periods, recalculated each period. A 20-day moving average is the average of the last 20 daily closes; each new day, the oldest close drops out and the newest is added.
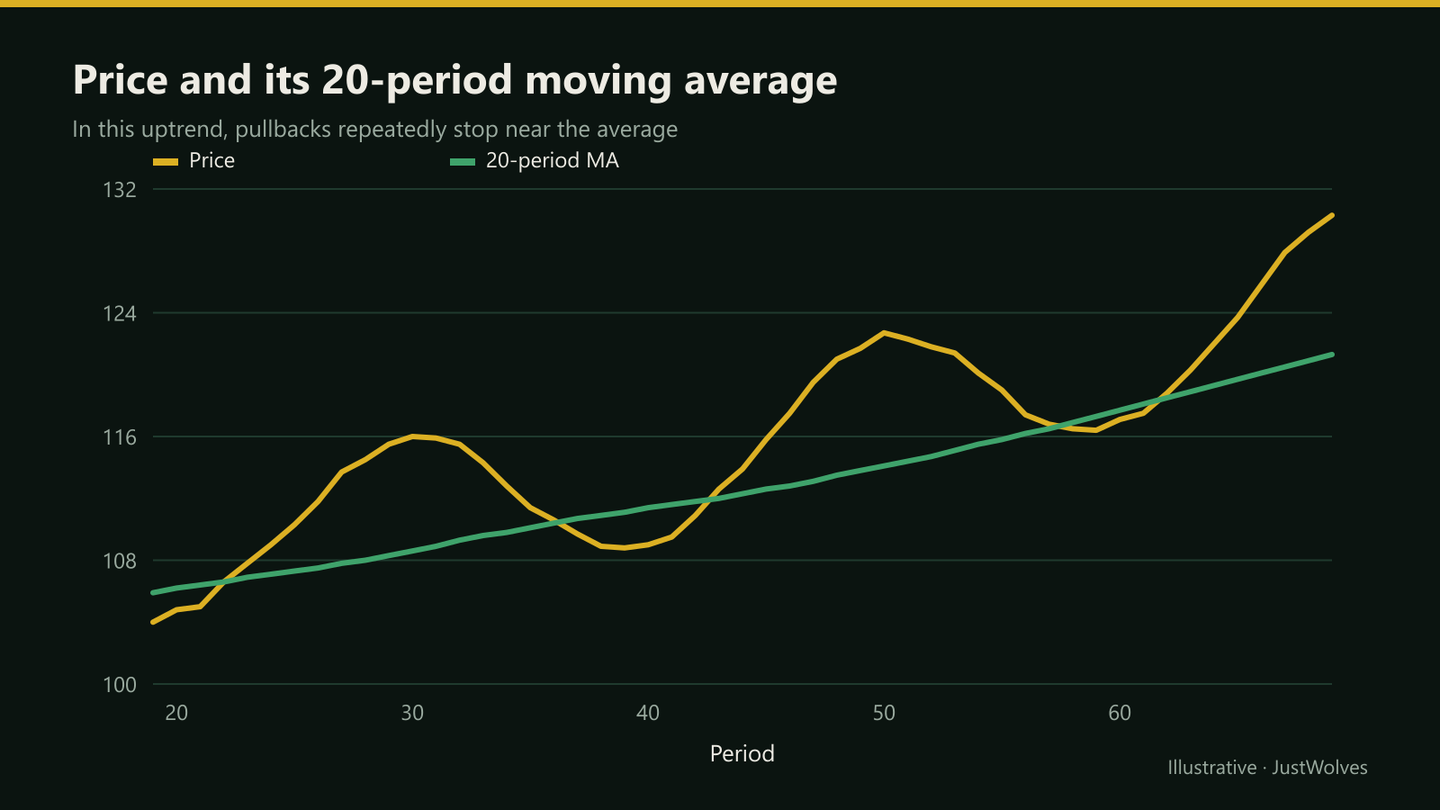
The result is a smooth line that follows price with a delay. In a steady uptrend it slopes up beneath price; in a downtrend it slopes down above it.
SMA vs EMA
| Simple (SMA) | Exponential (EMA) | |
|---|---|---|
| Weighting | Equal weight to every period | More weight to recent prices |
| Reaction | Slower | Faster |
| False signals | Fewer, later | More, earlier |
| Common use | Longer-term trend (50, 200) | Shorter-term trend (9, 20, 21) |
Which Periods Traders Watch
- 20 (or 21): short-term trend; often used for pullback entries in strong trends.
- 50: medium-term trend; widely watched on daily charts of stocks and indices.
- 200: long-term trend; price above a rising 200-day average is commonly treated as a long-term uptrend.
These periods have no special mathematical property. They matter mostly because so many traders watch them, which can make reactions near them more likely.
Using Moving Averages
- Trend filter: only look for longs when price is above a rising MA, and shorts when below a falling one.
- Dynamic support: in a clear uptrend, a pullback to the 20 or 50 MA, combined with a bullish candle, is a common entry idea.
- Confluence: an MA that sits on top of a horizontal level is stronger than either alone.
- Stops and exits: a close below the MA used for entry can serve as an exit signal.
An MA Pullback, Step by Step
The chart below follows the practical example in this lesson. The orange line is the rising 50-day average. Step through it and notice that the trade combines three things: the trend shown by the average, a horizontal level at the same price, and a reversal candle.
A pullback to a rising moving average
Step 1 of 5
Trend: price above a rising average
The stock trades above its 50-day simple moving average, and the average is sloping up. By this lesson's trend filter, only longs are considered.
- What to observe
- Price above the line; the line rising.
- Condition
- Look for pullbacks, not breakouts.
Real Case: The 20 EMA on NIFTY 50
The chart below uses real NIFTY 50 daily candles with the 20-day EMA and 50-day SMA calculated from the full daily history. Step through it to see two textbook touches that worked, and the third test that went straight through both averages.
Real case: two touches of the 20 EMA, then a break, NIFTY 50, June–July 2026
Step 1 of 5
Below falling averages
In early June 2026 NIFTY trades below a falling 20-day EMA. The 50-day SMA is flat around 23,690. By this lesson's trend filter, there is no long setup.
- What to observe
- Price below the faster average; the slower one flat.
- Condition
- No longs.
A Note on Crossovers
You'll often hear about moving average crossovers, such as the 50-day crossing above the 200-day (sometimes called a golden cross) or below it (a death cross). Because both averages lag, crossovers usually happen well after the turn in price, and in sideways markets they flip back and forth. Many traders use them as a slow-moving description of the long-term trend rather than as entry signals.
Do Moving Averages Act as Support? Our Test
JustWolves tested the 20-period exponential moving average (EMA) as dynamic support on real data: about two years of daily candles and six months of 1H candles for NIFTY 50, EUR/USD, GBP/USD, USD/JPY and gold, with resistance tested on mirrored prices.
Uptrend: the close above a 50-period simple average that was rising over the previous ten candles. A touch: the first time price reached the EMA after at least three closes clearly above it. Held: price bounced one and a half average candle ranges before a close clearly below the EMA. As a control, we ran the same test on a placebo line: the EMA shifted down by one average candle range.
| Line | Daily: held | 1H: held |
|---|---|---|
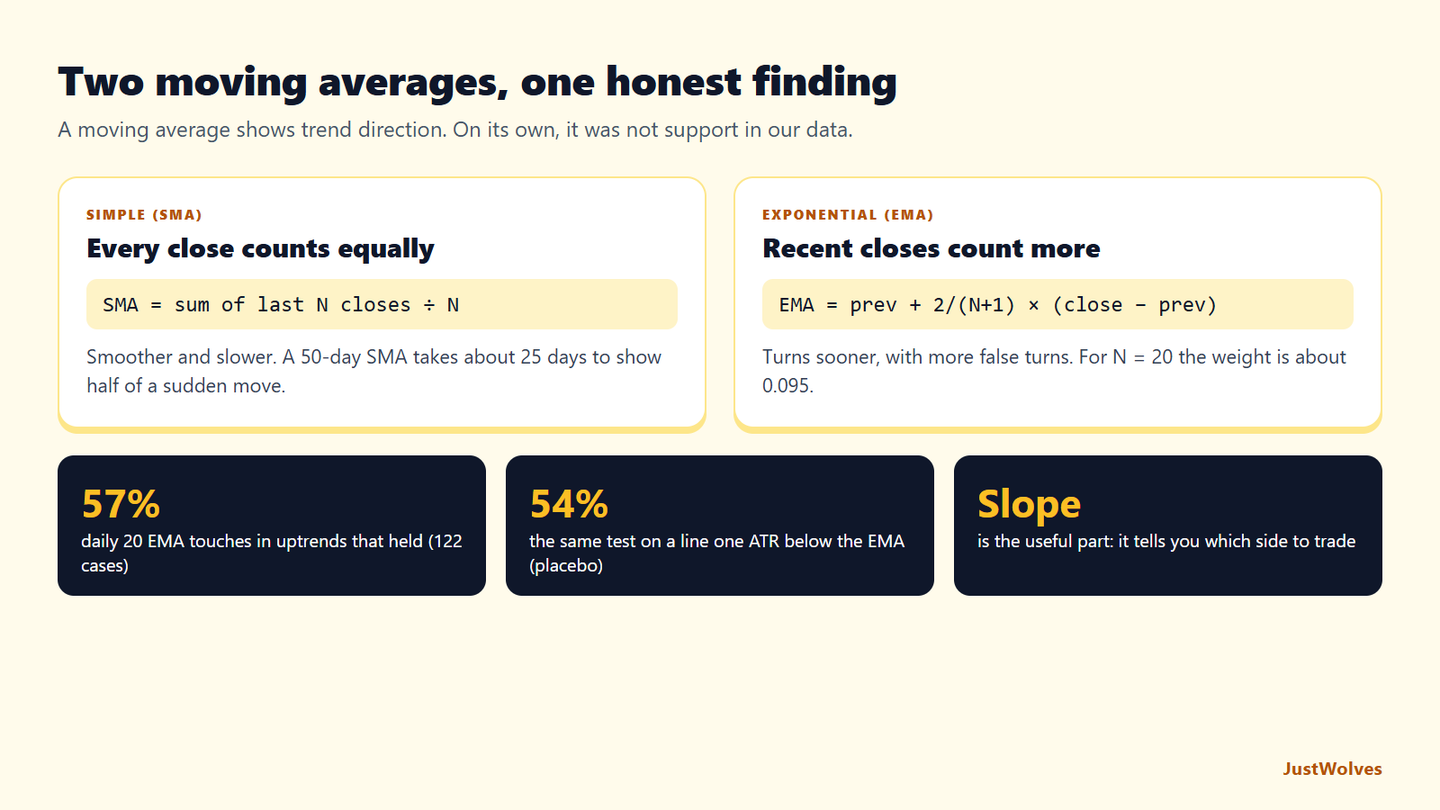
| EMA 20 in an uptrend | 57% (122) | 61% (643) |
| Placebo: EMA 20 minus one average range | 54% (89) | 62% (392) |
| EMA 20 when the 50 SMA is flat | 56% (75) | 63% (402) |
The moving average did not hold noticeably better than a line drawn one average range below it. On daily charts the EMA was slightly ahead (57% against 54%), on 1H charts slightly behind, and both differences are well within what small samples produce by chance. Touches during flat periods did no worse.
The honest reading is that a moving average is not support in itself. Pullbacks in an uptrend often bounce, and the average happens to be a convenient place where many pullbacks end. That still makes it useful, in the ways this lesson describes: as a quick read of trend, and as a place to look for confluence with horizontal levels. It does not make the line a reason to buy on its own.
Step by Step: An MA Pullback Plan
Bullish example
Step 1: Trend
Price above a rising 50 MA on the daily chart.
Step 2: Pullback
Price returns to the 20 or 50 MA, ideally near a horizontal support level.
Step 3: Reaction
A bullish reversal candle closes at or above the average.
Step 4: Entry and stop
Buy after the close; stop below the candle's low or the nearby swing low.
Step 5: Target
The recent high, or the next resistance level.
Practical Example
Hypothetically, an Indian capital-goods stock trades above its rising 50-day SMA, which sits at ₹3,240. The stock pulls back from ₹3,420 to ₹3,250, close to the average and to a previous breakout level at ₹3,230–₹3,260.
A hammer forms and closes at ₹3,275. Kunal buys at ₹3,280 with a stop at ₹3,215, below the hammer's low and the zone, targeting ₹3,410 just below the recent high: ₹65 of risk for ₹130 of reward.
How the Two Averages Are Calculated
A simple moving average adds the last N closes and divides by N. For a 5-day SMA with closes of 100, 102, 101, 104 and 103, the average is 510 ÷ 5 = 102.
An exponential moving average gives more weight to recent prices using a smoothing factor of 2 ÷ (N + 1). For a 20-period EMA, that is 2 ÷ 21, about 0.095. Each day: new EMA = previous EMA + 0.095 × (today's close − previous EMA). If yesterday's EMA was 102 and today closes at 106, the new EMA is 102 + 0.095 × 4 ≈ 102.38.
Because recent prices carry more weight, the EMA turns sooner after a change in direction. That is the trade-off in this lesson's table: earlier signals, but more of them false.
| Average | Roughly half the adjustment after | Most of the adjustment after |
|---|---|---|
| 10 EMA | 3–4 candles | 10 candles |
| 20 EMA | 7 candles | 20 candles |
| 50 SMA | 25 candles | 50 candles |
| 200 SMA | 100 candles | 200 candles |
Moving Averages on Indian Charts
On Indian indices and stocks, the 50-day and 200-day averages are among the most widely quoted in market commentary, which is one reason traders watch them. Two practical points: daily averages on Indian stocks are calculated from closing prices, so a gap down that opens far below the average shows up only in the next close; and averages on intraday charts reset their context each morning after the overnight gap. Many intraday traders therefore use a short EMA for trend on the 5- or 15-minute chart, and the daily 20 or 50 average only as background.
Common Mistakes
- Using MAs in ranges, where they whipsaw.
- Expecting exact touches; treat the MA as a zone too.
- Stacking many averages until every price is near one.
- Optimising periods to fit past charts.
- Ignoring horizontal levels in favour of the line.
Professional Insight
Many professionals use one or two standard averages, often the 50- and 200-day, mainly as a quick read of trend and as context for levels. They rarely treat a moving average as a reason to trade on its own.
Risk Considerations
- Lag: averages turn after price does.
- Whipsaws in sideways markets.
- Crowded levels can see sharp spikes through them.
Important Terminology
| Term | Meaning |
|---|---|
| Moving average | The average closing price over a set number of periods. |
| SMA | Simple moving average: equal weights. |
| EMA | Exponential moving average: more weight to recent prices. |
| Dynamic support | A support level that moves with price, such as a moving average. |
| Whipsaw | Repeated false signals as price crosses back and forth. |
Can a moving average act as support?
Yes. In trending markets, pullbacks often stop near widely watched averages such as the 20 or 50, which is why they're called dynamic support.
EMA or SMA: which is better?
Neither is better overall. EMAs react faster with more false signals; SMAs are smoother but slower.
Which moving average is best for swing trading?
Many swing traders use the 20 and 50 on daily charts, with the 200 for long-term context.
Why do moving averages fail?
They lag price and give repeated false signals in sideways markets.
What is the 200-day moving average used for?
As a long-term trend gauge: many traders treat price above a rising 200-day average as a long-term uptrend.
Does the 20 EMA act as support?
Not reliably on its own. In our test on real daily and 1H data, touches of the 20 EMA in uptrends held about as often as touches of a line placed one average candle range below it. The average is more useful for showing trend direction than as a level.
Should I buy when price touches the 50-day moving average?
Only as part of a plan: the average rising, a horizontal level nearby, a reversal candle, and a stop below both. The touch alone was not an edge in our data.
Why did price fall straight through the moving average?
Moving averages are calculations on past prices, not levels where orders must sit. In a real NIFTY example from July 2026, the 20 EMA held on two pullbacks and was then broken by a fall of almost 600 points in a single day.
Practical Exercise
Test an MA as support.
Your task
Step 1: Add a 50-day SMA
To three daily charts in clear uptrends.
Step 2: Find pullbacks
Every time price came within 1% of the average.
Step 3: Record outcomes
Did price resume the trend, or close well below the average?
Step 4: Add context
Was there a horizontal level nearby in the cases that held?
Check Your Understanding
A 20-day SMA is:
Related Lessons
Previous: How to Draw Support and Resistance. Next: Trendlines and Price Channels. See also the best chart indicators for price action traders.