
Wick Theory: Reading Wicks and the 50% Rule
JustWolves is an educational platform and is not a SEBI-registered investment advisor. Trading financial instruments involves significant risk of loss and may not be suitable for all investors. Past performance is not indicative of future results. Read our full disclaimer →
What you'll learn
- A wick records a move that was reversed within the candle; on a lower timeframe it's a small reversal
- Mark the wick's 50% midpoint: halfway between the body and the wick's extreme
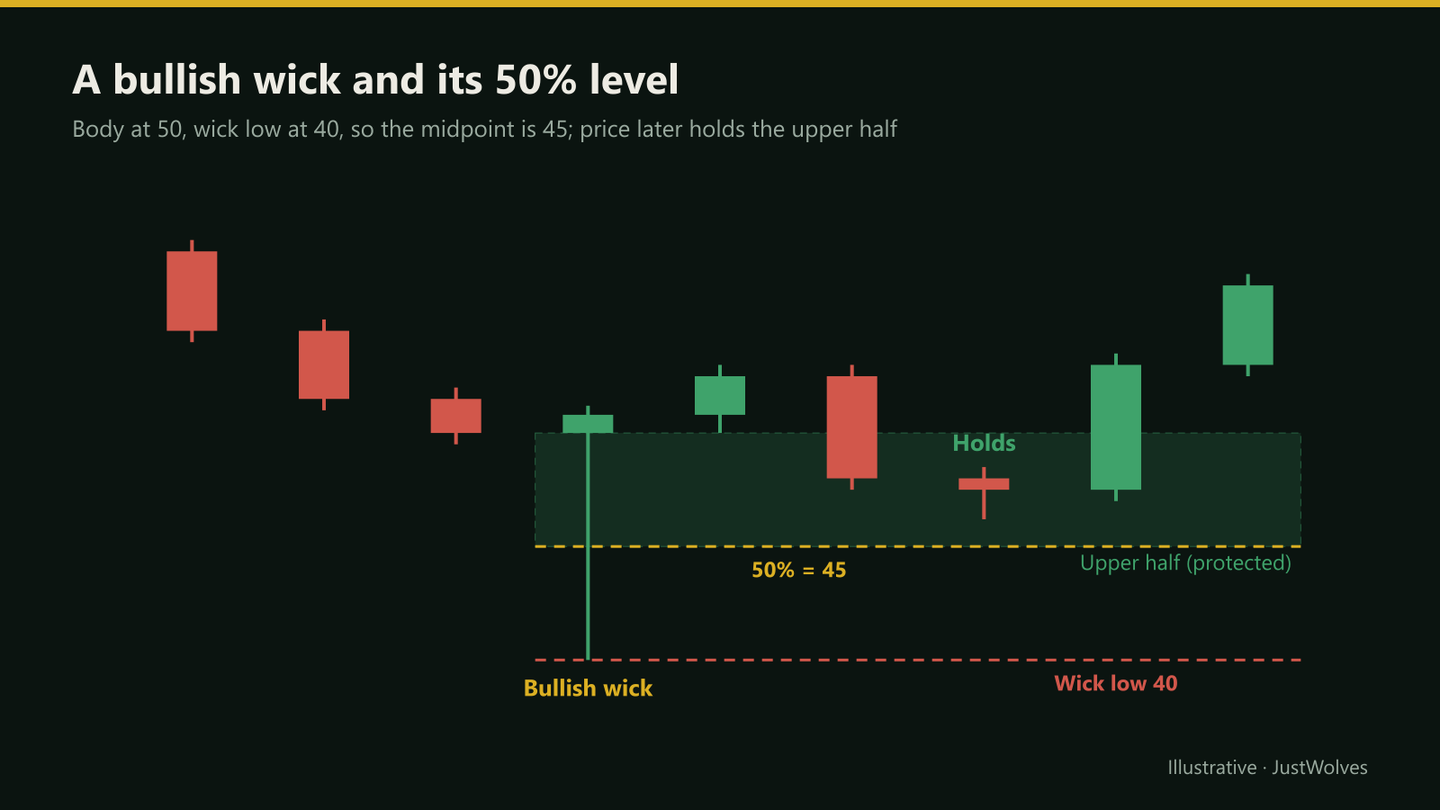
- A bullish wick is respected while price holds the upper half; a close below 50% disrespects it
- Judge respect by closes, not by wicks through the midpoint
- Use the higher-timeframe wick for the zone and a lower timeframe for the entry
In this article · 16 sections
A candle's wick is where price traded but didn't stay. Zoom into a lower timeframe and every meaningful wick turns out to be a small reversal: a move into an area, then a move back out. Wick theory turns that observation into a practical tool, using the wick's halfway point to decide whether the reversal it recorded is still being respected. This lesson explains how to mark wicks, how to judge them, and how to use them across timeframes.
What You Will Learn
- What a wick records
- How to mark a wick's 50% level
- When a wick is respected or disrespected
- How to use higher-timeframe wicks for entries
Before You Start
Read Price Rejection and Multi-Timeframe Analysis first.
What a Wick Records
A wick (or shadow) is the thin line above or below a candle's body, marking the highest and lowest prices traded. A long lower wick on a daily candle means price fell well below the open or close during the day, then recovered before the close.
On a lower timeframe, that same wick is a sequence: a decline, a low, and a rally back. In other words, every higher-timeframe wick contains a lower-timeframe reversal. Wick theory treats that reversal as a reference point for future price.
The 50% Rule
The key level is the wick's 50% midpoint: halfway between the body edge the wick extends from and the wick's extreme. For a bullish wick (a long lower wick), measure from the bottom of the body down to the wick low and mark the halfway point.
Respected or Disrespected
| State | What happens | What it suggests |
|---|---|---|
| Respected | Price returns, trades in the upper half, and candles close above 50% | The earlier reversal is still being defended |
| Disrespected | A candle closes below the 50% level | The reversal has lost its hold; the wick low becomes the next target |
| Pierced but respected | A wick dips below 50% but the candle closes back above | Still respected; judge by the close |
The logic mirrors for a bearish wick (a long upper wick): the protected zone is the lower half, and a close above 50% disrespects it. Use the close of the timeframe you are trading on, and decide in advance which one that is.
Using Wicks Across Timeframes
Top-down wick method
Step 1: Higher timeframe
Find a significant wick, ideally at a key level such as the previous day's low. Mark its body edge, 50% and extreme.
Step 2: Bias
A bullish wick at support gives a bullish bias while the upper half holds.
Step 3: Lower timeframe
When price returns to the upper half, drop to a timeframe roughly three to five times smaller.
Step 4: Confirmation
Wait for a reversal candle or a break of a minor swing high.
Step 5: Risk
Stop below the 50% level or below the wick low; target the higher-timeframe high or the next level.
The 50% Rule, Step by Step
The chart below follows the Bank Nifty example in this lesson. The daily wick's protected upper half is drawn on the 15-minute chart, so you can see how the higher-timeframe zone and the lower-timeframe trigger combine.
Using a daily wick on the 15-minute chart
Step 1 of 5
Mark the daily wick
Yesterday Bank Nifty swept the previous day's low and closed near its open, leaving a lower wick from 52,100 (the bottom of the body) to 51,700. The 50% level is 51,900. The upper half, 51,900–52,100, is the protected zone.
- What to observe
- Body edge, 50% and wick low marked before the session.
- Condition
- Bullish bias while the upper half holds on a closing basis.
Does the 50% Rule Work? Our Test
JustWolves tested the 50% rule on real data: about six months of 1H candles and two years of daily candles for NIFTY 50, EUR/USD, GBP/USD, USD/JPY and gold, with upper wicks tested on mirrored prices.
Wick: a candle whose lower wick was at least half its range, with a range of at least one average candle and a low below the previous candle's low (a sweep). Return: the first later candle that traded back to the body edge. Decision: made at that candle's close, as a trader would make it in real time: above or below the 50% level. Outcome: a bounce of one average candle above the body edge before a close below the wick low.
As a control, we ran the same rule on a placebo zone of the same size placed one and a half average ranges lower, where no wick existed.
| First close | 1H: bounced first | Daily: bounced first |
|---|---|---|
| Above the 50% level | 65% (594) | 60% (96) |
| Below the 50% level | 31% (171) | 40% (15) |
| Placebo zone, close in its upper half | 67% (425) | 64% (55) |
The 50% rule clearly separated better and worse returns. When the first close stayed in the upper half, price bounced about twice as often as when it closed below 50%. After a close below 50%, price went on to trade down to the wick low in nearly nine out of ten cases on the 1H chart. That supports the lesson's rule: judge the wick by closes, and treat a close below 50% as a warning.
The placebo result adds an important qualification. A zone of the same shape with no wick behind it, judged by the same close rule, did just as well. So the edge here comes mainly from where price closes relative to the stop, not from the wick having any special memory. A close in the upper half of any zone leaves room above the stop and shows buyers active at that moment. Use the wick to locate the zone and the 50% rule to filter entries, and keep the stop beyond the level that would prove you wrong.
Practical Example
Hypothetically, Bank Nifty sweeps the previous day's low and closes the day near its open, leaving a lower wick from 52,100 (bottom of the body) to 51,700. The 50% level is 51,900.
The next morning, price dips to 51,960, inside the upper half. On the 15-minute chart a bullish engulfing candle forms. Asha buys at 52,010 with a stop at 51,880, just below the midpoint, targeting the previous day's high at 52,400: 130 points of risk for 390 points of reward. A 15-minute close below 51,900 would have told her the wick was disrespected.
Measuring Wicks Correctly
| Candle | Body edge | Wick extreme | 50% level |
|---|---|---|---|
| Bullish daily candle, open 52,050, close 52,180, low 51,850 | 52,050 (the open) | 51,850 | 51,950 |
| Bearish daily candle, open 1,248, close 1,236, low 1,212 | 1,236 (the close) | 1,212 | 1,224 |
| Upper wick: close 845, open 838, high 860 | 845 (the close) | 860 | 852.5 |
The most common error is measuring from the wrong edge. For a lower wick, the body edge is whichever of the open and close is lower; for an upper wick, whichever is higher. Measure from that edge to the wick's extreme, and the 50% level is the halfway point.
Not every wick is worth marking. Our test used wicks that were at least half of the candle's range, on candles at least as large as the average, that swept the previous candle's extreme. Small wicks on ordinary candles carry little information. Daily wicks at key levels, such as the previous day's high or low, are the ones most traders watch.
Inside the Wick: What the Lower Timeframe Shows
On a 15-minute chart, a daily lower wick usually looks like a sharp drop to a low, a pause, and a rally back. The 50% level often sits near where that rally began to accelerate. When price returns, you can watch the same area on the lower timeframe: a lower-timeframe higher low or an engulfing candle inside the upper half gives a precise entry, with the stop just below 50%. That is the method used in this lesson's example, and it keeps risk small relative to the size of the daily candle.
Common Mistakes
- Entering as soon as price touches the zone, without lower-timeframe confirmation.
- Judging respect by wicks instead of closes.
- Using every small wick; focus on prominent wicks at key levels.
- Measuring from the wrong edge: measure from the body edge the wick extends from.
- Ignoring the higher-timeframe trend.
Professional Insight
The 50% midpoint is a simple, objective way to decide whether a recorded reversal is still relevant. Many traders like it because it turns a subjective question, 'is this wick still meaningful?', into a rule based on closes.
Risk Considerations
- Long wicks mean wide stops if you use the wick extreme.
- Respected wicks still fail; use a stop.
- Gaps can open below the whole wick.
Important Terminology
| Term | Meaning |
|---|---|
| Wick | The line above or below a candle body, marking its high or low. |
| 50% midpoint | Halfway between the body edge and the wick's extreme. |
| Protected half | The half of the wick nearest the body. |
| Respected | Price holds the protected half on a closing basis. |
| Disrespected | A candle closes beyond the 50% level. |
What does a long wick on a candle mean?
Price traded far beyond the body during the candle but was pushed back before the close, which on a lower timeframe shows up as a reversal.
How do I find a wick's 50% level?
Take the body edge the wick extends from and the wick's extreme, and mark the halfway point between them.
When is a wick disrespected?
When a candle closes beyond its 50% level into the half nearest the wick's extreme.
Does a wick through the 50% level count?
Not by itself. If the candle closes back in the protected half, the wick is still treated as respected.
Which timeframe should I use for wick analysis?
Mark the wick on a higher timeframe and look for entries on one roughly three to five times smaller.
Does the wick 50% rule work?
As a filter, yes. In our test on real 1H data, first returns that closed above a wick's 50% level bounced 65% of the time, against 31% for returns that closed below it. A placebo zone with no wick showed a similar pattern, so the edge comes from judging the close rather than from the wick itself.
What happens when price closes below the 50% level of a wick?
In our 1H data, after a first close below 50%, price traded down to the wick's low in about nine out of ten cases. That is why the rule treats a close below 50% as disrespect.
Practical Exercise
Track ten wicks.
Your task
Step 1: Find ten prominent daily wicks
At key levels on liquid stocks or indices.
Step 2: Mark each 50% level
Before looking at what happened next.
Step 3: Record the next return
Respected or disrespected, by close?
Step 4: Check targets
After disrespect, did price reach the wick extreme?
Check Your Understanding
A long lower wick on a daily candle shows that:
Related Lessons
Previous: Price Rejection. Next: Rejection Blocks. See also Multi-Timeframe Analysis.