
What Is Support and Resistance? A Beginner's Guide
JustWolves is an educational platform and is not a SEBI-registered investment advisor. Trading financial instruments involves significant risk of loss and may not be suitable for all investors. Past performance is not indicative of future results. Read our full disclaimer →
What you'll learn
- Support is a price area where falling prices have tended to stop; resistance is where rising prices have tended to stop
- They form because many traders remember and act on the same prices
- Treat them as zones, not exact lines
- Broken support often becomes resistance, and broken resistance becomes support
- Levels show where to pay attention, not what will happen
In this article · 18 sections
If you learn only one idea from price action, make it this one. Support and resistance are the price areas where the market has paused or turned before, and where traders watch for it to happen again. Almost every strategy uses them, in one form or another, to decide where to buy, where to sell and where to place stops. This lesson explains what they are, why they work, and how to think about them correctly from the start.
What You Will Learn
- What support and resistance are
- Why they form
- Why they're zones, not lines
- What happens when they break, and how traders use them
Before You Start
Read What Is Price Action Trading? first.
Definitions
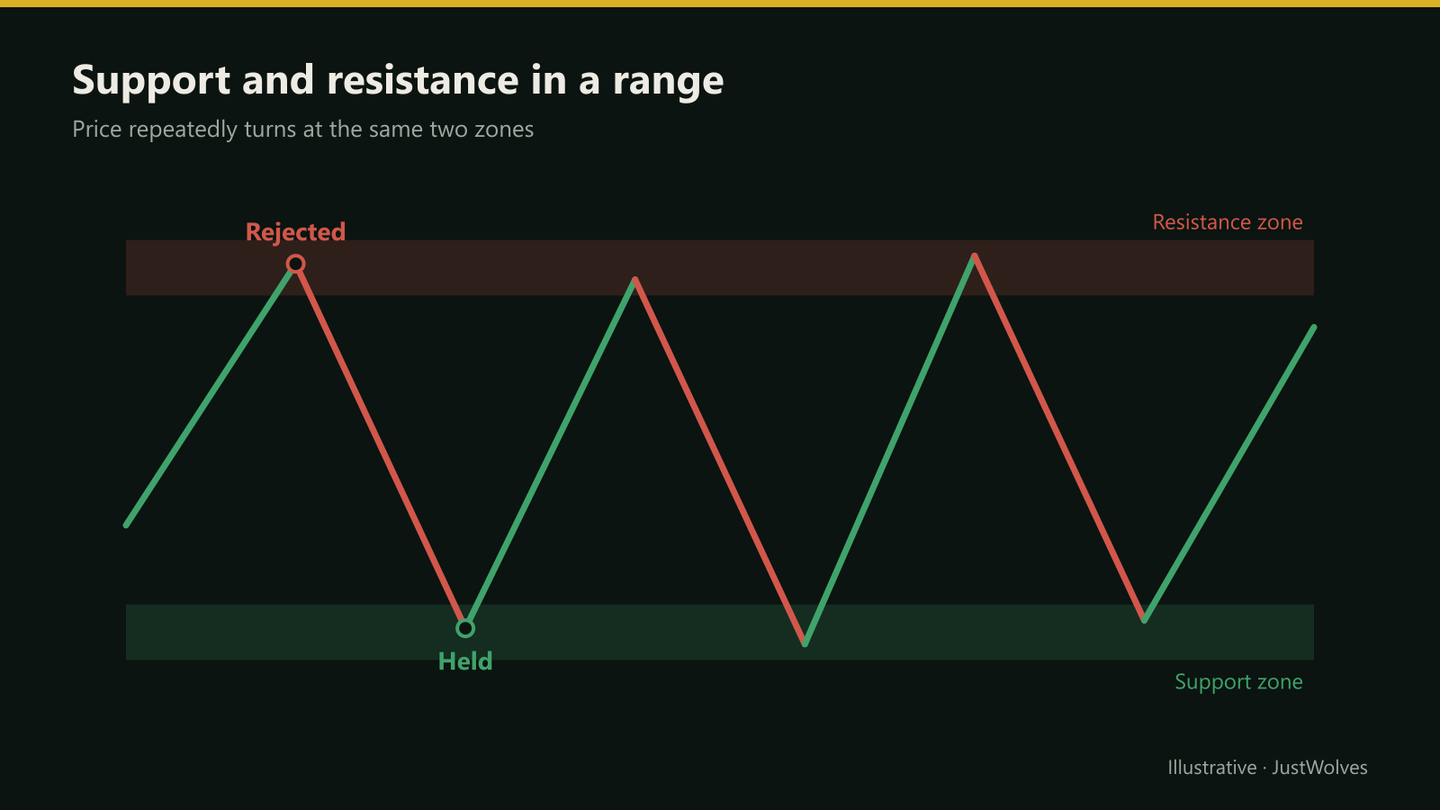
- Support is a price area below the current price where falling prices have tended to stop and turn up. Buyers have been willing to step in there.
- Resistance is a price area above the current price where rising prices have tended to stop and turn down. Sellers have been willing to act there.
Why Support and Resistance Form
- Memory: traders remember prices where the market turned before, and place orders around them.
- Regret: traders who missed buying at support often wait to buy there again if price returns.
- Trapped positions: traders who bought just before a fall may sell to get out at breakeven when price returns, creating resistance.
- Visibility: obvious levels, such as round numbers and previous highs and lows, attract orders simply because many people see them.
None of this works every time. But because many participants watch the same levels, price often reacts there, at least briefly.
Zones, Not Lines
Price rarely turns at exactly the same price twice. A support level might hold at ₹1,498 one week and ₹1,505 the next. Drawing it as a zone, say ₹1,495–₹1,510, reflects how price actually behaves and stops you treating a small overshoot as a 'break'. Lesson 04.02.02 shows how to draw zones correctly.
When Levels Break: Role Reversal
Levels don't last forever. When price closes decisively through support, that old support often becomes resistance on the way back up. When resistance breaks, it often becomes support. This is called role reversal, or polarity.
The reasoning: traders who bought at the old support are now losing money and may sell to exit near breakeven if price returns, which turns the old floor into a ceiling.
Support, Resistance and Role Reversal on One Chart
The chart below follows the practical example in this lesson from the first turn to the role reversal. Step through it and watch how the levels form only after repeated turns, why they are zones rather than lines, and how the old resistance becomes the reference for a new trade.
Support, resistance and a role reversal
Step 1 of 6
First turns
The stock falls to 980 and turns up, then rallies to 1,124 and turns down. One turn at each price is just a swing. It becomes interesting only if price reacts there again.
- What to observe
- Two prices where the market changed direction.
- Condition
- Note them; nothing to trade yet.
Real Case: NIFTY 50, June 2025
The chart below uses real NIFTY 50 daily candles from June 2025. It shows a role reversal that looked like it had failed on one day and then worked the next, which is exactly the situation where treating a level as a zone, rather than a line, makes the difference.
Real case: resistance becomes support, NIFTY 50, June 2025
Step 1 of 5
A resistance level
After a sharp fall on 12–13 June 2025, NIFTY rallies and stalls at 24,982 on 17 June, then drifts lower. That swing high is now resistance.
- What to observe
- A clear turning point.
- Condition
- Watch for a close above it.
How Traders Use Them
| Use | Example |
|---|---|
| Entries | Buy near support in an uptrend; sell near resistance in a downtrend |
| Stops | Place stops just beyond the zone, where the idea is proved wrong |
| Targets | Take profit just before the next opposing level |
| Breakouts | Trade a decisive close through a level, or its retest |
How Do Levels Really Behave? Our Test
JustWolves measured support and resistance mechanically on real data: about six months of 1H candles and two years of daily candles for NIFTY 50, EUR/USD, GBP/USD, USD/JPY and gold. Every five-candle swing low (and, on mirrored prices, every swing high) became a level. On price's first return to each level, we recorded whether it held (price bounced one average candle range away) or broke (a candle closed clearly through it).
The important part is the comparison. We ran the same test on placebo lines: prices about one and a half average candle ranges beyond a swing, where no level existed. If support and resistance had special power, real levels should hold much more often than placebo lines.
| Line tested | 1H: held | Daily: held |
|---|---|---|
| Swing-low or swing-high level | 56% | 50–51% |
| Broken level retested from the other side (role reversal) | 57% | 49% |
| Placebo line, no level there | 57–59% | 53–61% |
Real levels held no more often than placebo lines. A one-candle bounce is common almost anywhere on a chart, so "price bounced at my level" is weak evidence that the level caused it. This matches what the Professional Insight below says: experienced traders treat levels as places where risk is clear, not places where price must turn.
That does not make levels useless. A level gives you three things no prediction can: a specific place to look for a trade instead of chasing price, a logical place for a stop, and a target where the next opposing level sits. All three are about risk, and they work whether or not the level holds. What the data rules out is treating a level as a reason to expect a reversal on its own.
Why Zones Beat Lines
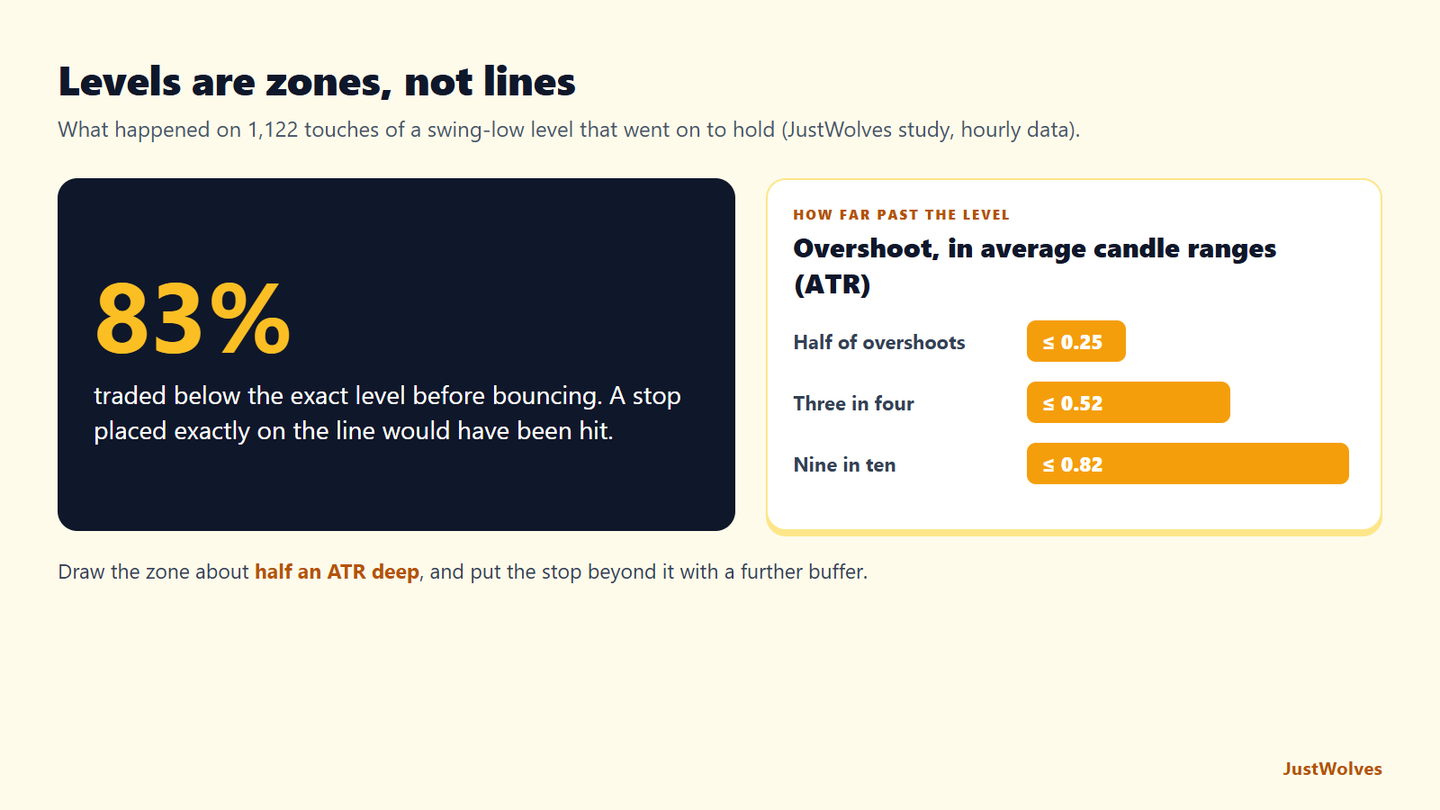
We also measured how far price traded beyond a swing-low level on the touches that did hold. The result is the strongest evidence in this lesson for drawing zones.
| Measure | Result |
|---|---|
| Traded below the exact level before bouncing | 83% |
| Median overshoot | 0.25 of an average candle range |
| 3 in 4 overshoots were within | 0.52 of an average candle range |
| 9 in 10 overshoots were within | 0.82 of an average candle range |
On more than four out of five touches that eventually held, price first traded through the exact level. A trader who treated the level as a precise line would have called a "break" that was not one, and a stop placed exactly at the line would have been hit. Drawing the level as a zone, with the stop beyond the zone plus a buffer of about half to one average candle range, matches how price really behaves around levels.
Step by Step: Finding Your First Levels
On a daily chart
Step 1: Look left
Find prices where the chart has turned at least twice.
Step 2: Mark zones
Cover the area of the turns, not just one price.
Step 3: Keep it near price
Mark the nearest one or two levels above and below current price.
Step 4: Note role reversals
Any broken level that price has since retested from the other side.
Step 5: Watch, don't predict
Note how price behaves next time it reaches a zone.
Practical Example
Hypothetically, a pharmaceutical stock turned up from around ₹980 in March, ₹985 in May and ₹978 in July. Priya marks a support zone at ₹975–₹990. It also turned down three times near ₹1,120–₹1,135, her resistance zone.
In September, the stock closes at ₹1,148, above resistance. When it pulls back to ₹1,128 and holds, Priya treats the old resistance as new support, a role reversal, and considers a long with a stop below ₹1,115.
Types of Support and Resistance
| Type | Example | Covered in |
|---|---|---|
| Horizontal swing levels | Earlier swing highs and lows | This lesson and the next |
| Round numbers | Nifty 24,000; EUR/USD 1.1000 | Pivot Points and Round Numbers |
| Dynamic levels | A rising 20- or 50-day moving average | Dynamic Support and Resistance |
| Trendlines | A line joining rising swing lows | Trendlines and Price Channels |
| Supply and demand zones | The base a strong move started from | Supply and Demand Zones |
| Previous period highs and lows | Yesterday's high, last week's low | Breakout Trading course |
All of these work the same way in practice: they mark prices where many traders are paying attention. Our tests across this course found the same pattern for several of them: the level itself is not a reliable predictor, but it is a reliable reference for planning entries, stops and targets.
Support and Resistance in Indian Markets
Indian stocks and indices add two practical details. First, overnight gaps: a stock can close above support and open well below it the next morning, filling your stop far beyond the level. Position sizes on daily-chart trades should allow for that. Second, circuit limits on individual stocks can stop trading at a fixed percentage move, which means a level can be skipped entirely on news days. For intraday trading in Nifty or Bank Nifty futures, the previous day's high, low and close, and round numbers such as every 100 or 500 points, are the levels most traders watch.
Common Mistakes
- Drawing exact lines and calling every overshoot a break.
- Marking too many levels.
- Buying support in a strong downtrend without other evidence.
- Stops exactly at the level, where they're easily hit.
- Ignoring role reversal after a break.
Professional Insight
Professional traders use support and resistance less as places where price must turn and more as places where risk is clear. A long near support with a stop just below it has a defined, small risk. If the level fails, the loss is small and the information is useful.
Risk Considerations
- Levels break, sometimes sharply on news.
- Gaps in stocks can open beyond a level overnight.
- Obvious levels attract stop runs; leave a buffer.
Important Terminology
| Term | Meaning |
|---|---|
| Support | A price area where falling prices have tended to stop. |
| Resistance | A price area where rising prices have tended to stop. |
| Zone | A price band rather than a single line. |
| Role reversal | Broken support becoming resistance, or vice versa. |
| Retest | Price returning to a broken level. |
What is support and resistance in trading?
Support is a price area where falling prices have tended to stop; resistance is where rising prices have tended to stop.
Why does support and resistance work?
Many traders remember and act on the same prices, so orders cluster there and price often reacts.
Is support and resistance a line or a zone?
A zone. Price rarely turns at exactly the same price, so a band reflects behaviour better.
What happens when support breaks?
It often becomes resistance when price returns to it, a behaviour called role reversal.
Can I buy at every support level?
No. Consider the trend and wait for evidence that the level is holding, and always use a stop.
Does support and resistance really work?
As a planning tool, yes; as a prediction, not on its own. In our test on real data, price held at swing-based levels no more often than at placebo lines where no level existed. Levels are valuable because they give clear places for entries, stops and targets.
How far can price go past support before it is broken?
In our 1H data, 83% of touches that eventually held first traded below the exact level, with a median overshoot of a quarter of an average candle range. That is why levels are best drawn as zones, with stops beyond the zone plus a buffer.
Does broken resistance always become support cleanly?
Rarely. In a real NIFTY example from June 2025, the first test of broken resistance dipped about 157 points below the level and closed just under it, before the level held the next day. That is why levels are drawn as zones.
Practical Exercise
Mark levels on three charts.
Your task
Step 1: Choose three daily charts
Nifty and two liquid stocks.
Step 2: Mark one support and one resistance zone
Near current price on each.
Step 3: Find a role reversal
On any chart, if one exists.
Step 4: Track
Over the next two weeks, note what price does at each zone.
Check Your Understanding
Support is a price area where:
Related Lessons
Previous module: Multi-Timeframe Analysis. Next: How to Draw Support and Resistance. Later: Price Rejection at Key Levels.