
CRT with Market Structure
JustWolves is an educational platform and is not a SEBI-registered investment advisor. Trading financial instruments involves significant risk of loss and may not be suitable for all investors. Past performance is not indicative of future results. Read our full disclaimer →
What you'll learn
- Market structure (higher highs and lows, or lower highs and lows) gives CRT its direction
- Trend-aligned CRT: bullish setups at pullback lows in uptrends, bearish setups at rally highs in downtrends
- Pullback (contra-trend) candles are natural C1 candidates in a trend
- Counter-trend CRT setups need stronger evidence, such as a break of structure
- Determine bias one timeframe above the CRT timeframe
In this article · 16 sections
On its own, a CRT pattern only says that a break failed. Market structure says which failed breaks are more likely to matter. In an uptrend, a sweep below a pullback candle's low that closes back inside is a with-trend signal; a sweep above a candle's high in the same uptrend is a counter-trend signal fighting the dominant direction. This lesson shows how to use structure to choose which CRT setups to trade.
What You Will Learn
- How to set a bias from market structure
- Trend-aligned CRT setups
- Pullback candles as C1
- When counter-trend CRT is justified
Before You Start
Read Bullish and Bearish CRT Setups, and from the Price Action course, Market Trends and Multi-Timeframe Analysis.
Bias from Structure
Decide the trend on the timeframe one step above your CRT timeframe: for 1-hour CRT, use the 4-hour or daily chart; for 4-hour CRT, the daily or weekly.
Higher highs and higher lows give a bullish bias: look for bullish CRT setups only. Lower highs and lower lows give a bearish bias: look for bearish CRT only. If structure is unclear or ranging, either skip CRT or trade only at the range's edges.
Pullback Candles as C1
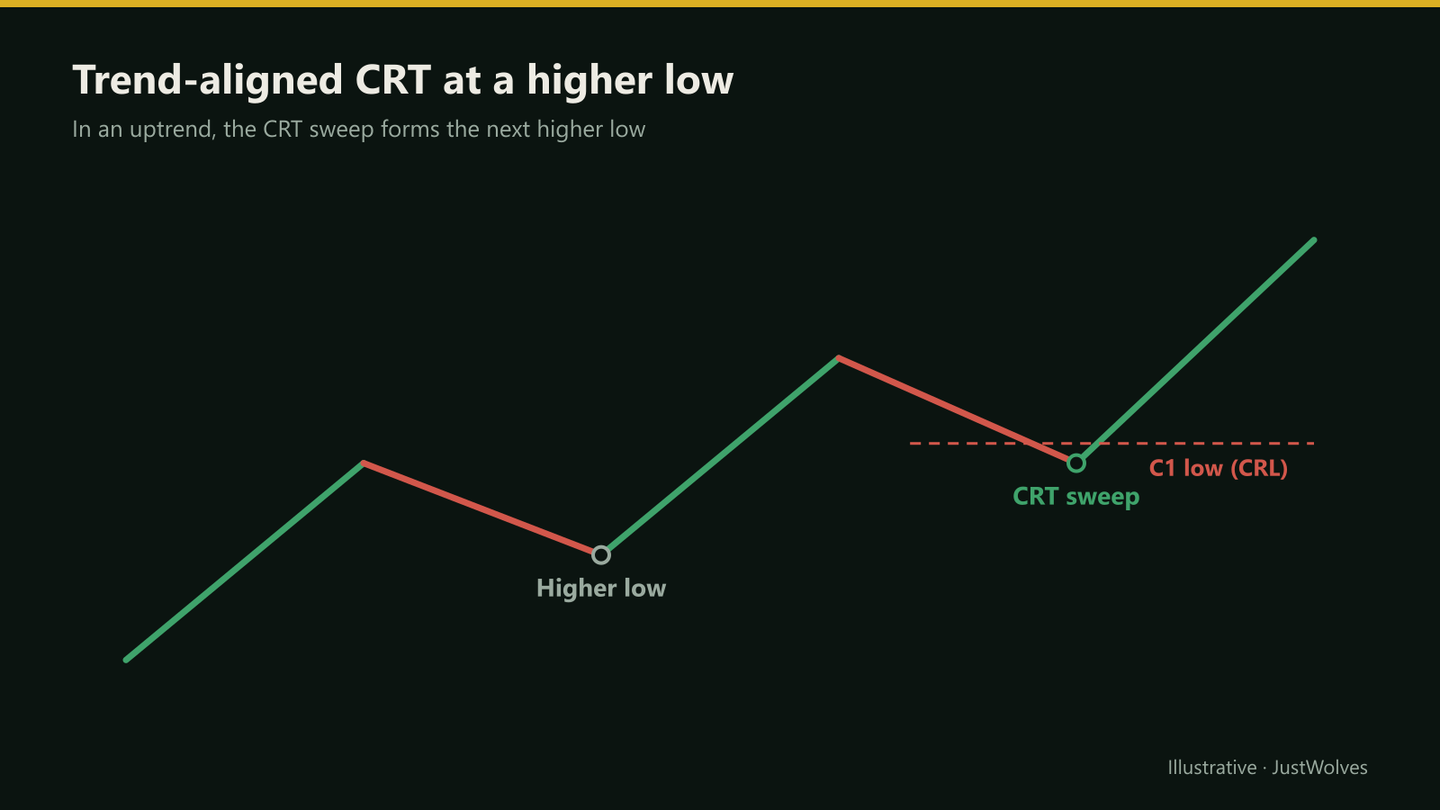
In an uptrend, pullbacks consist of bearish candles moving against the trend. Each of those candles is a natural C1: its low is where pullback sellers' stops and breakdown traders' orders cluster. When C2 sweeps that low and closes back inside, the pullback may be ending.
This turns CRT into a pullback-entry method, closely related to the pullback trading in Pullbacks and Retracements.
Counter-Trend CRT
A bearish CRT in an uptrend is asking the market to reverse its dominant direction. Many of these fail: the sweep above a high is often followed by a real breakout later.
Counter-trend CRT carries more weight when structure itself is already turning, for example after a break of structure below the last higher low, or at a major higher-timeframe level. Many traders reduce size or skip counter-trend setups entirely.
Structure Levels as Targets
Structure also sets targets beyond the opposite side of C1's range. In a bullish trend-aligned CRT, the previous swing high is a natural runner target. If that high is very close to CRH, the room for continuation is limited and the trade's reward is mostly the range itself.
Ranging Markets
When the higher timeframe is ranging rather than trending, there's no dominant direction to align with. CRT can still be useful at the edges of the larger range: bullish setups where C2 sweeps below the range low and closes back inside, bearish setups at the range high.
In the middle of a larger range, CRT setups have neither trend nor location behind them. Many traders simply skip them, or treat them as low-grade setups with smaller size and the midpoint of C1 as the only target.
CRT at a Range Edge, Step by Step
Ranges deserve more attention than they usually get in CRT material. CRT is, at its core, a failed-breakout pattern, and failed breakouts are most common when the market has no trend to carry a break further. The chart below shows the idea.
CRT at the edge of a range
Step 1 of 5
No trend: a range
Price swings between about 99.40 and 102.40 without making higher highs or lower lows. In a range, breaks of the edges tend to fail, which is exactly the behaviour CRT looks for.
- What to observe
- Repeated turns at similar levels.
- Condition
- Mark the range high and low first.
What Our Data Showed About Trend and CRT
JustWolves tested whether higher-timeframe structure improves CRT, using 830 real 4H setups on EUR/USD, GBP/USD, USD/JPY and gold (May–November 2026). We classified the daily trend at the time of each C2 with a simple, objective rule: uptrend if the last daily close was above its 20-day average and that average was rising; downtrend for the mirror image; no clear trend otherwise. Trade rules were the course standard: entry at C3's open, stop 5% of C1's range beyond C2, target at the opposite side of C1, closed after C4. Costs were excluded.
| Setup vs daily trend | Setups | Winning trades | Average result |
|---|---|---|---|
| In the direction of the daily trend | 309 | 42% | −0.16R |
| Against the daily trend | 354 | 42% | −0.10R |
| No clear daily trend | 167 | 56% | +0.21R |
| With the trend and C1 is a pullback candle | 234 | 41% | −0.16R |
| All setups | 830 | 45% | −0.06R |
This contradicts one of the most repeated pieces of CRT advice. Trading only with the trend did not help in this sample. Trend-aligned setups were the weakest group, and pullback candles in a trend did no better. The only group with a clearly positive average was setups taken when the daily chart had no clear trend.
There is a sensible explanation. A CRT setup bets that a break will fail. In a trending market, breaks of short-term lows during pullbacks often succeed, and the trend simply continues through the C2 extreme. In a range, breaks of the edges fail more often, which is what CRT needs.
Two cautions. First, 167 trades is a modest sample, and when you test many groups, one will look good by chance. Second, this is one definition of trend; a different definition could give a different answer. The useful conclusion is narrower: do not assume trend alignment improves CRT. Measure it with your own definition and market, and give ranging conditions a fair test.
When Structure Changes Mid-Trade
Occasionally, the higher-timeframe structure changes while a CRT trade is open, for example when a daily close breaks the last higher low in a bullish trade. At that point the trade has lost its main reason. Many traders exit or reduce, even if the CRT stop hasn't been hit, rather than holding a position whose context has disappeared.
Writing this rule down in advance avoids the common habit of finding new reasons to stay in a trade after its original reason has gone.
Practical Example
Hypothetically, Nifty's daily chart shows higher highs and lows. On the 1-hour chart, a two-candle pullback from 24,250 ends with a bearish C1 from 24,120 to 24,170. C2 sweeps to 24,095 and closes at 24,140.
Pooja buys early in C3 at 24,142, with a stop at 24,088 and a first target at CRH 24,170, then a runner to the swing high of 24,250. The setup is with the daily trend, at a pullback, so she takes it at full size.
Common Mistakes
- Ignoring the higher-timeframe trend.
- Taking counter-trend CRT at full size.
- Using the same timeframe for bias and setup.
- Trading CRT in choppy, structureless markets.
- Targeting beyond structure that's just above CRH.
Professional Insight
Traders who use CRT effectively often describe it as a timing tool inside a structural view. The trend decides the direction; CRT decides when a pullback has likely ended.
Risk Considerations
- Trends end; trend-aligned setups fail at turning points.
- Structure can be ambiguous in ranges.
- Higher-timeframe levels can stop moves short.
Important Terminology
| Term | Meaning |
|---|---|
| Bias | The preferred trade direction from higher-timeframe structure. |
| Trend-aligned CRT | A CRT setup in the trend's direction. |
| Contra-trend candle | A pullback candle moving against the trend. |
| Counter-trend CRT | A CRT setup against the trend. |
| Break of structure | A close beyond the swing that defined the trend. |
Should CRT be traded with the trend?
Trend-aligned CRT setups generally have the market's dominant direction behind them and are preferred by many traders.
Which timeframe sets the bias?
One step above the CRT timeframe, such as the 4-hour or daily for 1-hour CRT.
What makes a good C1 in a trend?
A pullback candle moving against the trend, often near a higher low or lower high.
Can I trade counter-trend CRT?
With stronger evidence, such as a break of structure or a major level, and usually at smaller size.
What target should I use beyond CRH?
The next structural level, such as the previous swing high in an uptrend.
Should I only trade CRT in the direction of the trend?
It is common advice, but in our test of 830 real 4H setups it did not help: trend-aligned setups averaged −0.16R before costs, counter-trend setups −0.10R, and setups with no clear daily trend +0.21R. Test trend filters on your own market before relying on them.
Does CRT work better in ranging markets?
In our sample, yes: setups taken when the daily chart had no clear trend were the only group with a positive average result (+0.21R over 167 trades, before costs). The sample is modest, so treat it as something to test rather than a proven rule.
Practical Exercise
Filter by trend.
Your task
Step 1: Find thirty CRT setups
On your chosen timeframe.
Step 2: Mark the bias
From the next timeframe up.
Step 3: Split them
Trend-aligned versus counter-trend.
Step 4: Compare outcomes
Which group reached the first target more often in your sample?
Check Your Understanding
For 1-hour CRT, bias is usually set on:
Related Lessons
Previous module: Bullish and Bearish CRT Setups. Next: CRT with SMC. See also Market Trends.