
False Breakouts, Bull Traps and Bear Traps
JustWolves is an educational platform and is not a SEBI-registered investment advisor. Trading financial instruments involves significant risk of loss and may not be suitable for all investors. Past performance is not indicative of future results. Read our full disclaimer →
What you'll learn
- A false breakout moves beyond a level and then closes back inside the range, trapping traders who acted on the break
- A bull trap is a failed upside breakout; a bear trap is a failed downside breakdown
- Common causes: stop runs at obvious levels, no follow-through demand, and trading against the larger trend
- Breakout traders limit the damage by exiting quickly when price closes back inside
- The failure itself can be a setup: trapped traders exiting can drive price to the other side of the range
In this article · 15 sections
Every breakout trader takes false breakouts. Price clears a level, triggers buying, and then falls back inside the range, leaving buyers trapped above it. How you handle these failures decides whether breakout trading works for you. This lesson explains why false breakouts happen, the early signs, how to keep the losses small, and how some traders turn the failure into a trade of its own.
What You Will Learn
- What false breakouts, bull traps and bear traps are
- Why breakouts fail
- Early warning signs
- How to manage failures and trade them
Before You Start
Read Breakout and Retest and Chart Pattern Breakouts. The Candle Range Theory course covers a closely related idea, the range sweep.
Definitions
| Term | What happens | Who is trapped |
|---|---|---|
| False breakout | Price moves beyond a level, then closes back inside | Traders who acted on the break |
| Bull trap | A failed upside breakout above resistance | Buyers above resistance |
| Bear trap | A failed downside breakdown below support | Sellers below support |
| Breakout failure | Any breakout that doesn't follow through and reverses | Breakout traders on that side |
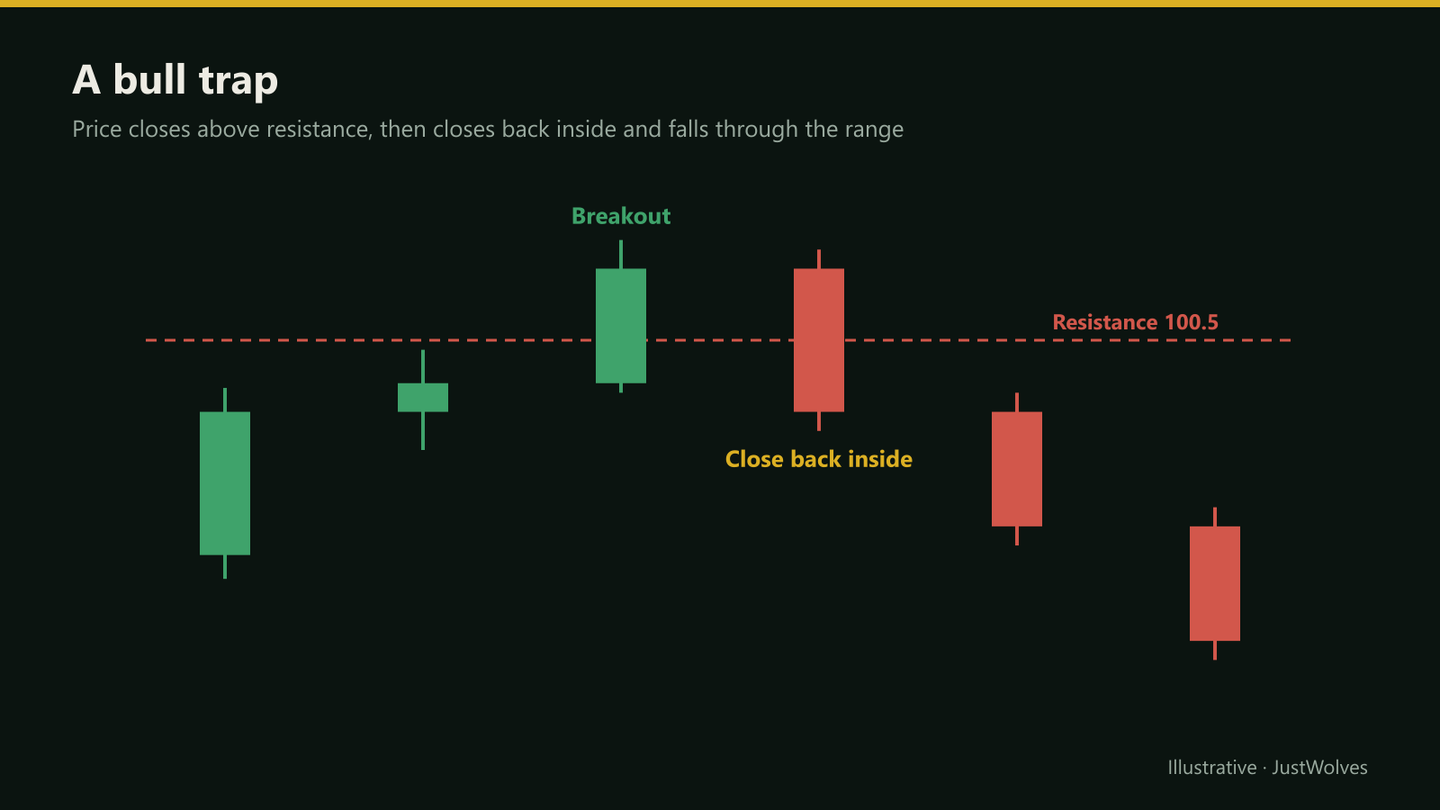
Why Breakouts Fail
- Stop runs: obvious levels collect stop and breakout orders. A push through triggers them, and once they're filled there may be no further buying.
- Absent demand: low volume and weak closes show few real buyers behind the move.
- Higher-timeframe resistance: a daily breakout running into weekly resistance just above.
- Against the trend: upside breakouts in downtrends fail more often.
- Market conditions: in falling or choppy markets, breakouts across the board struggle.
Early Warning Signs
- A weak breakout candle: long upper wick, close in the lower half, or a close barely beyond the level.
- Below-average volume on the breakout.
- No follow-through: the next candles stall just above the level.
- A close back inside the range: the clearest signal.
Limiting the Damage
False breakouts are a cost of breakout trading, not a sign that something is broken. The aim is to keep each one small. Three habits help: a stop that sits just inside the range rather than at its far side, a rule to exit on a close back inside, and a time stop if the breakout hasn't moved away from the level within a few sessions (or a few candles intraday).
Position sizing does the rest. If each failure costs 1R or less, a breakout approach can absorb many of them as long as the successful breakouts are large enough.
Trading the Failure
When a breakout fails, the traders who bought it become sellers as they exit. That can push price back through the range toward the opposite side. Some traders specialise in this: after a close back inside, they enter in the opposite direction, with a stop beyond the failed breakout's extreme and a target at the range midpoint or the opposite boundary.
This is sometimes called a breakout failure setup. It works best at clear levels, in ranging or counter-trend conditions, and when the failed breakout shows obvious rejection, such as a long wick and a strong close back inside.
Real Prices: A Bull Trap
Asha's example in this lesson is hypothetical. The chart below shows a bull trap on real Asian Paints prices from January 2026: a strong-looking breakout in a weak market, a close back inside two days later, and a fall through the whole range.
Real prices: a bull trap and the fall that followed, Asian Paints, January 2026
Step 1 of 4
The range
From December 2025 into early January 2026, Asian Paints trades between about ₹2,735 and ₹2,850, with a high of ₹2,856.7 on 9 January. NIFTY is not above a rising 50-day average at the time.
- What to observe
- A clear range with obvious levels at both ends.
- Condition
- A weak market is one of this lesson's warning signs.
Practical Example
Hypothetically, a stock has resistance at ₹1,505 and a range low of ₹1,440. It closes at ₹1,520 on average volume. The next session, it falls and closes at ₹1,494, back inside the range. Asha, who bought the breakout at ₹1,522 with a stop at ₹1,488, exits at ₹1,494 on the close back inside, losing ₹28 a share rather than waiting for her full ₹34 stop.
Kunal trades the failure instead. He shorts at ₹1,492 in the stock's futures, with a stop at ₹1,528, above the failed breakout's high of ₹1,526, risking ₹36. His target is the range midpoint at about ₹1,472, ₹20 away and only 0.6R, so he decides to target the range low at ₹1,445, ₹47 away, about 1.3R.
How Common Are False Breakouts? Our Test
JustWolves measured false breakouts on about two years of daily prices for 17 large NSE stocks (November 2024 to November 2026): 419 closes above the prior 20-day high. We compared holding each trade to its stop (half an ATR below the level, 2R target) with exiting on the first close back inside within five days. We also tested this lesson's failure trade: sell at the first close back inside, with a stop a quarter of an ATR above the failed breakout's high and a target at the range midpoint.
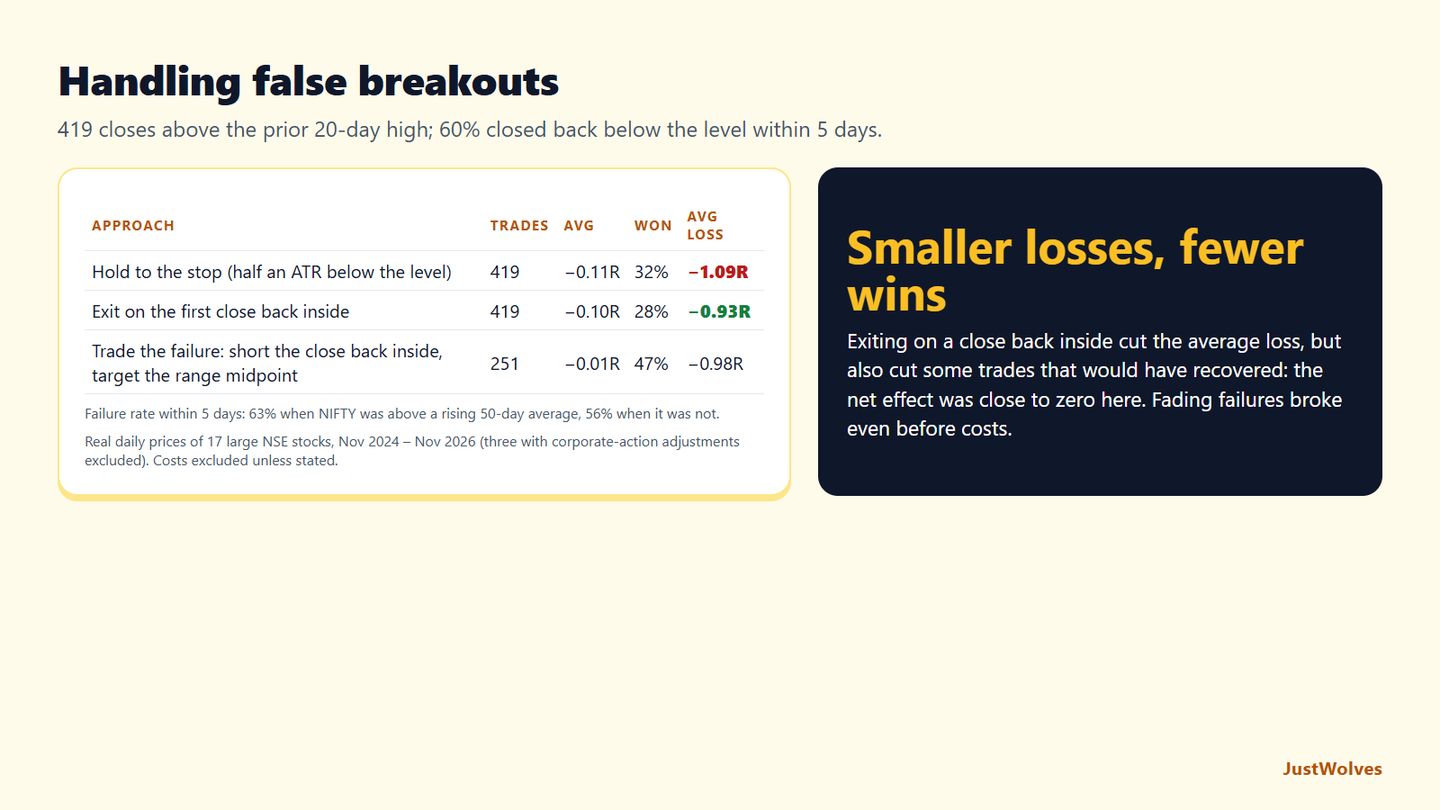
| Approach | Trades | Average | Won | Average loss |
|---|---|---|---|---|
| Hold to the stop, 2R target | 419 | −0.11R | 32% | −1.09R |
| Exit on the first close back inside (within 5 days) | 419 | −0.10R | 28% | −0.93R |
| Trade the failure, target the range midpoint | 251 | −0.01R | 47% | −0.98R |
| when NIFTY was above a rising 50-day average | 133 | 0.00R | 46% | −0.96R |
| when it was not | 118 | −0.02R | 49% | −1.01R |
False breakouts were the majority. Six in ten breakouts closed back below the level within a week. That supports this lesson's opening point: false breakouts are a normal cost of breakout trading, not a sign that something is broken.
Exiting on the close back inside cut each loss, but not the total. The average loss fell from −1.09R to −0.93R, as this lesson's callout describes. But some of those breakouts would have recovered and gone on to 2R, so the win rate fell from 32% to 28% and the overall average barely changed. The rule is worth having for the large failures, like Asian Paints above, where a close back inside was the start of a much bigger fall; it is not a free improvement.
Fading the failure broke even. Selling the close back inside won 47% of the time with a target at the range midpoint, but averaged −0.01R before costs. Failed breakouts did not reliably produce a move to the other side of the range. Specialists who trade failures likely add filters we did not test.
The market filter did not reduce failures here. Breakouts failed more often when NIFTY was above a rising 50-day average (63%) than when it was not (56%) in this period, a reminder that no single filter removes false breakouts.
Common Mistakes
- Holding a failed breakout and hoping it recovers.
- Moving the stop lower after price closes back inside.
- Re-buying immediately after a failure.
- Trading the failure in a strong trend in the breakout's direction.
- Taking every breakout without filters, guaranteeing many failures.
Professional Insight
Experienced breakout traders often say their edge is less about finding breakouts that work and more about getting out of the ones that don't. A trader who exits failures quickly and lets successful breakouts run can profit with a modest win rate; a trader who holds failures hoping they recover usually can't.
Risk Considerations
- Repeated failures in choppy markets.
- Fast reversals after traps.
- Failure trades carry their own false signals.
Important Terminology
| Term | Meaning |
|---|---|
| False breakout | A breakout that closes back inside the range. |
| Bull trap | A failed upside breakout. |
| Bear trap | A failed downside breakdown. |
| Stop run | A move that triggers clustered stops, then reverses. |
| Breakout failure setup | A trade in the opposite direction after a failed breakout. |
What is a false breakout?
A move beyond a level that closes back inside the range, trapping traders who acted on the break.
What is a bull trap?
A failed upside breakout that traps buyers above resistance.
What is a bear trap?
A failed breakdown that traps sellers below support.
How do I avoid false breakouts?
You can't avoid them all. Filters such as volume, a strong close and trend direction reduce them, and quick exits limit the damage.
Can I trade false breakouts?
Some traders trade in the opposite direction after a close back inside, with a stop beyond the failed breakout's extreme.
What percentage of breakouts are false?
In our test of 419 closes above the prior 20-day high on 17 NSE stocks, 60% closed back below the level within five trading days. That is why exits and position sizing matter more than finding perfect breakouts.
Should I exit when price closes back inside the range?
It cuts the size of each loss: in our NSE test, the average loss fell from −1.09R to −0.93R. But some of those trades would have recovered, so the overall result barely changed. It helps most in large failures that keep falling.
Practical Exercise
Study failures.
Your task
Step 1: Find 15 failed breakouts
On daily or intraday charts.
Step 2: Note the warning signs
Candle, volume, follow-through and trend.
Step 3: Measure the damage
Exit on close back inside vs full stop.
Step 4: Test the failure trade
How often did price reach the range midpoint or opposite side?
Check Your Understanding
A bull trap is:
Related Lessons
Previous module: Chart Pattern Breakouts. Next: Breakout Stop-Loss and Target Placement. See also the Candle Range Theory course.