
Momentum Breakouts
JustWolves is an educational platform and is not a SEBI-registered investment advisor. Trading financial instruments involves significant risk of loss and may not be suitable for all investors. Past performance is not indicative of future results. Read our full disclaimer →
What you'll learn
- Momentum breakouts focus on stocks that are already outperforming: strength tends to attract more buying
- Relative strength compares a stock's performance with an index such as the Nifty 50
- Breakouts to new 52-week highs have no overhead supply from trapped buyers
- Sector leadership adds support; isolated breakouts struggle more often
- Momentum ends abruptly: tight risk control and trailing exits are essential
In this article · 15 sections
Momentum traders buy what's already going up, betting that strength continues for a while. Breakouts are a natural fit: a strong stock breaking out of a tight base to new highs combines momentum with a defined level for the stop. This lesson covers how momentum breakout traders choose stocks, why new highs matter, India-specific features such as price bands, and the warning signs that momentum is fading.
What You Will Learn
- What momentum breakouts are
- How to measure relative strength
- Why new highs matter
- Gap-and-go breakouts and price bands
Before You Start
What Is a Momentum Breakout?
A momentum breakout is a breakout in a stock that is already strong: trading near its highs, outperforming the market, often in a leading sector. The idea is that strength tends to persist over weeks to months, a tendency known in academic research as the momentum effect, which has been documented across many markets, though its strength varies over time and it can reverse sharply.
For a breakout trader, momentum is a filter. Instead of trading every breakout, they focus on breakouts in stocks that the market is already favouring.
Relative Strength
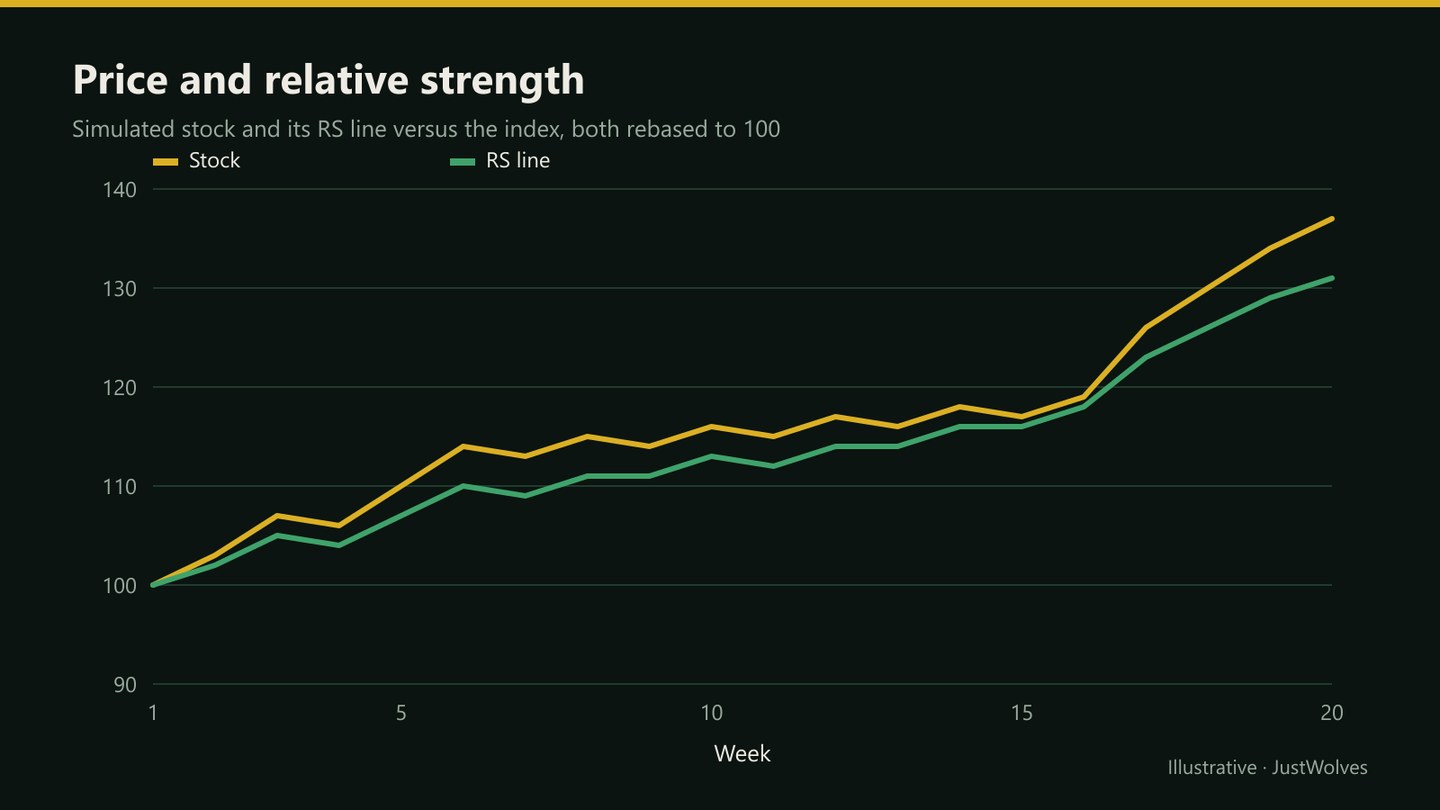
Relative strength (RS) compares a stock's performance with a benchmark. A simple version: divide the stock's percentage change over, say, three or six months by the Nifty 50's change over the same period, or plot the stock price divided by the index price as a line.
A rising RS line means the stock is outperforming. Many momentum traders want the RS line at or near new highs when the stock breaks out, sometimes even before price does. This is different from the RSI indicator, despite the similar name.
Why New Highs Matter
When a stock breaks out to a new 52-week or all-time high, there is no one above who bought higher and is waiting to sell at breakeven. Breakouts below old highs, by contrast, run into traders trapped at those highs who may sell as price returns to their entry.
That's why many momentum traders prefer breakouts at or near new highs, even though buying at the high feels uncomfortable. NSE publishes daily lists of stocks making new 52-week highs, which is a common starting point for scans.
Sector Leadership
Momentum tends to cluster in sectors. When several stocks in one sector break out together, institutional money is often rotating into that theme. A breakout in a stock whose sector index is also near highs has more support than a stock breaking out alone while its peers lag. Checking the relevant sector index, such as Nifty Bank, Nifty IT or Nifty Pharma, takes a minute.
Gap-and-Go and Price Bands
Strong momentum stocks sometimes gap above resistance on news or results and keep going. Traders often wait for the opening range to hold before buying, entering above the first 15 to 30-minute high with a stop below its low.
Many Indian stocks have daily price bands (commonly 2%, 5%, 10% or 20%), and stocks in the F&O segment have dynamic bands rather than fixed ones. A stock that hits its upper band may have few sellers, making entries difficult and exits uncertain the next day. Check a stock's band before planning an intraday momentum trade in it.
Real Prices: A Momentum Run and Its End
Ritu's example in this lesson is hypothetical. The chart below follows the same plan, a breakout at a new high, a partial sale at 2R and a trailing exit under the 20-day average, on real State Bank of India prices from January to March 2026. It shows both sides of momentum: the run, and how quickly it ended.
Real prices: a momentum leader at 52-week highs, and how it ended, State Bank of India, January–March 2026
Step 1 of 4
A leader breaks out
In early January 2026, State Bank of India has outperformed NIFTY 50 by about 14 percentage points over three months. On 13 January it closes at ₹1,028.4, a new 52-week high, on 1.6 times average volume. Like Ritu in this lesson, a trader buys with a stop below the short base, about ₹987: ₹41 of risk.
- What to observe
- Relative strength, a new high and a defined stop.
- Condition
- Plan: sell a third at 2R (about ₹1,111), trail the rest under the 20-day average.
Practical Example
Hypothetically, a capital goods stock has risen 42% in six months while the Nifty 50 rose 8%. Its RS line is at a new high, and its sector index is also near highs. The stock has based for five weeks just below its all-time high of ₹2,180, with volume drying up.
It breaks out with a close at ₹2,214 on 2.4 times average volume. Ritu buys at ₹2,218 with a stop at ₹2,138, below the tight area at the base's right side, risking ₹80. She plans to sell a third at 2R (₹2,378) and trail the rest under the 20-day average.
Did Momentum Filters Help? Our Test
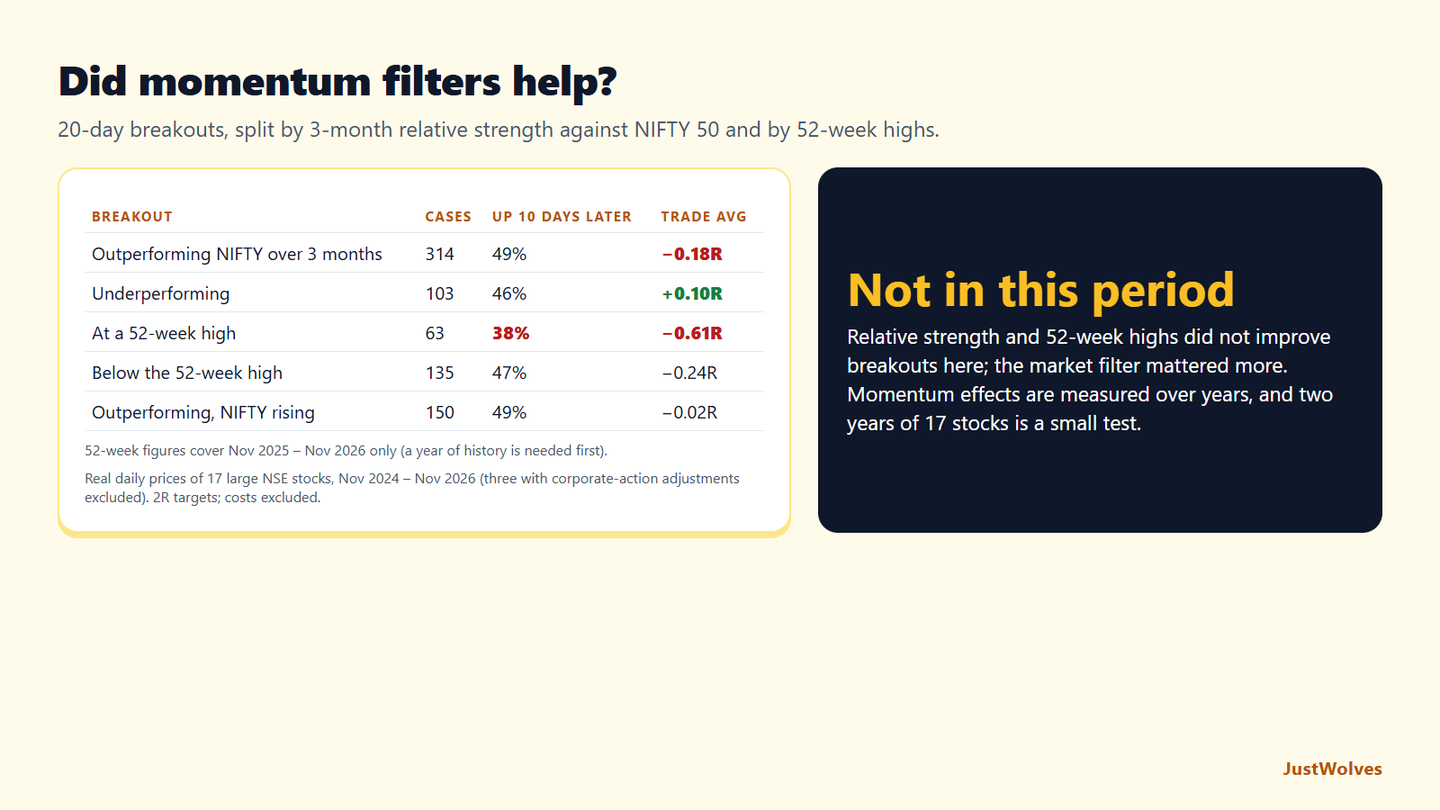
JustWolves tested this lesson's momentum filters on about two years of daily prices for 17 large NSE stocks (November 2024 to November 2026), using the same 419 closes above the prior 20-day high as our other breakout tests. Relative strength: the stock's 3-month return minus NIFTY 50's. 52-week high: a close at or above the highest high of the previous 250 trading days, which needs a year of history, so this filter covers only November 2025 to November 2026. Trades used a stop half an ATR below the level and a 2R target.
| Breakout | Cases | Up 10 days later | Average 10-day move | Trade average |
|---|---|---|---|---|
| Outperforming NIFTY over 3 months | 314 | 49% | −0.20% | −0.18R |
| Underperforming NIFTY | 103 | 46% | −0.74% | +0.10R |
| Top third by relative strength | 139 | 47% | −0.10% | −0.17R |
| At a 52-week high (Nov 2025 – Nov 2026) | 63 | 38% | −0.94% | −0.61R |
| Below the 52-week high (same period) | 135 | 47% | −0.79% | −0.24R |
| Outperforming, with NIFTY above a rising 50-day average | 150 | 49% | +0.15% | −0.02R |
In this period, the momentum filters did not help. Breakouts in stocks outperforming NIFTY did slightly worse per trade than those in laggards, and breakouts to 52-week highs did clearly worse than breakouts below them. That runs against this lesson's reasoning about overhead supply, and against the long-run research on momentum.
Why the gap? The momentum effect is measured over many years and hundreds of stocks; this is two years of 17 large stocks, and the 52-week sample covers a single year that included sharp market falls in which recent leaders, like State Bank of India in March 2026, fell hard. Breakouts at new highs were often late in a move. Our test is too small to overturn the broader evidence, but it is a warning against treating relative strength or new highs as enough on their own.
The market filter did more work. Outperforming stocks breaking out while NIFTY was above a rising 50-day average came close to breakeven, the best of these groups, which supports this lesson's professional insight: the selection and the market filter matter, and leaders stop working when the market turns. The SBI chart shows the other lesson from this section: momentum ended abruptly, and the trailing exit was what kept the gain.
Common Mistakes
- Buying laggards because they look 'cheap'.
- Confusing RS with RSI.
- Ignoring sector weakness.
- Chasing gaps at the open.
- Holding momentum stocks through clear breakdowns.
Professional Insight
Many experienced momentum traders spend most of their time building and pruning a list of leaders, not looking for entries. When the broad market is healthy, the leaders tend to break out one after another; when the market turns, they stop buying entirely. The selection and the market filter do more work than the entry itself.
Risk Considerations
- Momentum crashes can be sudden and deep.
- Price bands can trap positions.
- Crowded trades reverse sharply.
Important Terminology
| Term | Meaning |
|---|---|
| Momentum | The tendency of strong performers to keep performing for a while. |
| Relative strength (RS) | A stock's performance relative to a benchmark. |
| 52-week high | The highest price in the past year. |
| Overhead supply | Sellers waiting at prices where they bought before. |
| Price band | A limit on how far a stock can move in one session. |
What is a momentum breakout?
A breakout in a stock that is already outperforming the market, usually to or near new highs.
What is relative strength?
A comparison of a stock's performance with a benchmark such as the Nifty 50. It's different from the RSI indicator.
Why buy breakouts at new highs?
There are no trapped buyers above waiting to sell at breakeven, so there's less overhead supply.
Where can I find stocks at 52-week highs?
NSE publishes daily lists of stocks making new 52-week highs, and most screeners can filter for them.
What are price bands?
Limits on how far many Indian stocks can move in a session, which can affect entries and exits.
Do breakouts at 52-week highs work better?
Not in our recent NSE data. Between November 2025 and November 2026, breakouts at 52-week highs on 17 large stocks averaged −0.61R per trade, against −0.24R for breakouts below the 52-week high. Longer-run research on momentum is more positive; one year of data is a small test.
Does relative strength improve breakout results?
On its own, not in our two-year test: outperforming stocks averaged −0.18R per breakout trade. Combined with a rising market (NIFTY above a rising 50-day average), outperformers came close to breakeven, the best of the momentum groups we tested.
Practical Exercise
Build a leaders list.
Your task
Step 1: Screen for strength
Stocks within 10% of their 52-week high.
Step 2: Add RS
Keep those outperforming the Nifty 50 over six months.
Step 3: Check sectors
Group them by sector and note which sectors dominate.
Step 4: Watch for bases
Mark any forming tight bases near highs.
Check Your Understanding
Relative strength compares a stock with:
Related Lessons
Previous module: Pullback and Momentum Entries After a Breakout. Next: Opening Range Breakout (ORB). See also Market Selection, Scanning and Watchlists.