
Trendline Breakouts
JustWolves is an educational platform and is not a SEBI-registered investment advisor. Trading financial instruments involves significant risk of loss and may not be suitable for all investors. Past performance is not indicative of future results. Read our full disclaimer →
What you'll learn
- A trendline connects at least two, preferably three, swing points; the more touches, the more it's watched
- Trendlines are subjective: different anchor points give different lines
- A trendline break shows the trend has slowed; it doesn't prove a reversal
- Trendline breaks are stronger when they coincide with a break of horizontal structure
- Stops go beyond the last swing before the break, not just the other side of the line
In this article · 15 sections
Trendlines are among the first tools new traders learn, and trendline breaks are among the most over-traded signals. A falling trendline that breaks can mark the start of a new uptrend, but it can just as easily mark a pause before the decline continues. This lesson covers how to draw trendlines consistently, what a break actually tells you, and how to combine trendline breaks with horizontal structure so you trade the meaningful ones.
What You Will Learn
- How to draw valid trendlines
- What a trendline break does and doesn't mean
- How to confirm trendline breaks
- Entries and stops for trendline trades
Before You Start
Drawing Valid Trendlines
- Downtrend line: connect two or more lower highs, drawn above price.
- Uptrend line: connect two or more higher lows, drawn below price.
- Use significant swings, the ones you'd mark on a structure chart.
- A third touch validates the line; until then it's a hypothesis.
- Don't cut through bodies to make a line fit; if it needs forcing, it isn't there.
Trendlines are subjective. Two traders can draw different lines on the same chart, especially on log versus linear scales. Steeper lines break sooner and more often; shallower lines are more significant when they break.
What a Break Means
When price closes above a falling trendline, it shows that the decline has lost its pace: sellers can no longer push price down along that slope. That's useful information, but it's not the same as a trend reversal.
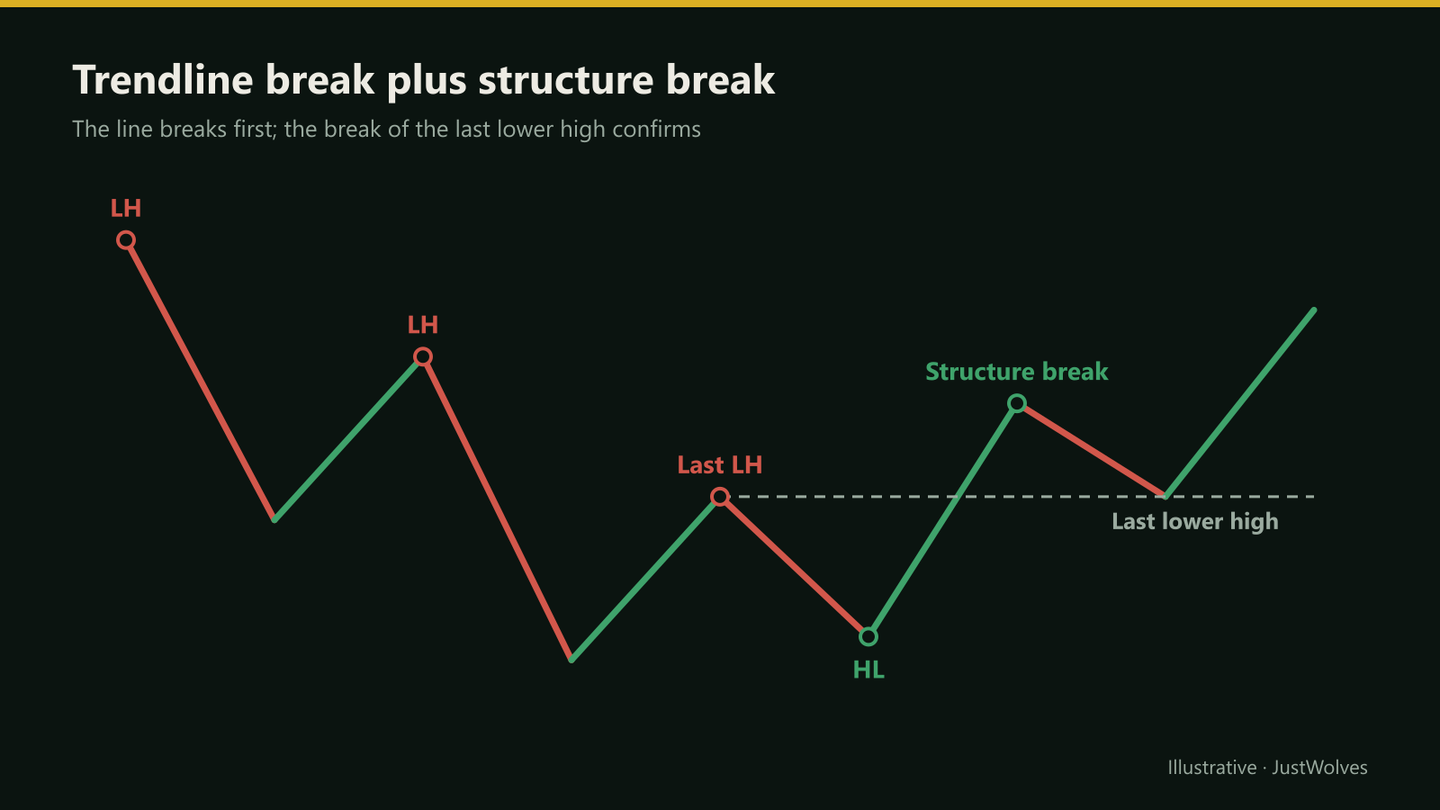
Price often breaks a downtrend line by moving sideways, not up. The downtrend's structure of lower highs and lower lows can remain intact even after the line breaks. A reversal is confirmed only when structure changes: a higher low, then a break above the last lower high.
Confirming Trendline Breaks
| Evidence | Strength |
|---|---|
| Intraday poke through the line | Weak |
| Daily close beyond the line | Moderate |
| Close beyond the line with higher volume | Moderate to strong |
| Break of the line and a horizontal level together | Strong |
| Higher low, then break of the last lower high | Strongest |
Uptrend Line Breaks
The same logic applies in reverse. A close below a rising trendline shows the advance has slowed, but the uptrend remains until price closes below the last higher low. For swing traders holding long positions, an uptrend line break is often a reason to tighten stops or take partial profit, rather than to reverse to short immediately.
Entries and Stops
Conservative traders enter only after the structure break, or on the first pullback after it, with a stop below the higher low. Aggressive traders enter on the trendline break itself, with a stop below the most recent swing low, accepting more failures in return for earlier entries.
Placing a stop just the other side of the trendline is a common error. The line slopes, so its value changes every day, and price often re-tests it. Stops belong beyond a swing point.
Real Prices: The Line Break and the Structure Break
Sameer's example in this lesson waits for the structure break. The chart below shows both entries on real Infosys prices from September and October 2026: the close above the falling trendline, and the later close above the last lower high.
Real prices: a falling trendline break and the later structure break, Infosys, September–October 2026
Step 1 of 4
A downtrend with a line
In September 2026 Infosys falls in a series of lower highs: ₹1,156 on 1 September and ₹1,097.7 on 15 September. A falling trendline through those highs marks the pace of the decline.
- What to observe
- Two significant swing highs: a valid line, as this lesson describes.
- Condition
- A third touch would validate it further.
Practical Example
Hypothetically, a stock has fallen for four months along a trendline touching lower highs at ₹520, ₹486 and ₹455. It makes a low at ₹402, bounces to ₹438 (the last lower high), and dips to a higher low at ₹415. Price then closes above the trendline at ₹432.
Sameer doesn't buy yet. Two days later, price closes at ₹444, above the last lower high of ₹438. He buys at ₹445 with a stop at ₹411, below the higher low, risking ₹34. His first target is the next horizontal resistance at ₹486, about 1.2R; he decides that's too little, and waits for a pullback toward ₹438 to improve the entry.
Line Break or Structure Break? Our Test
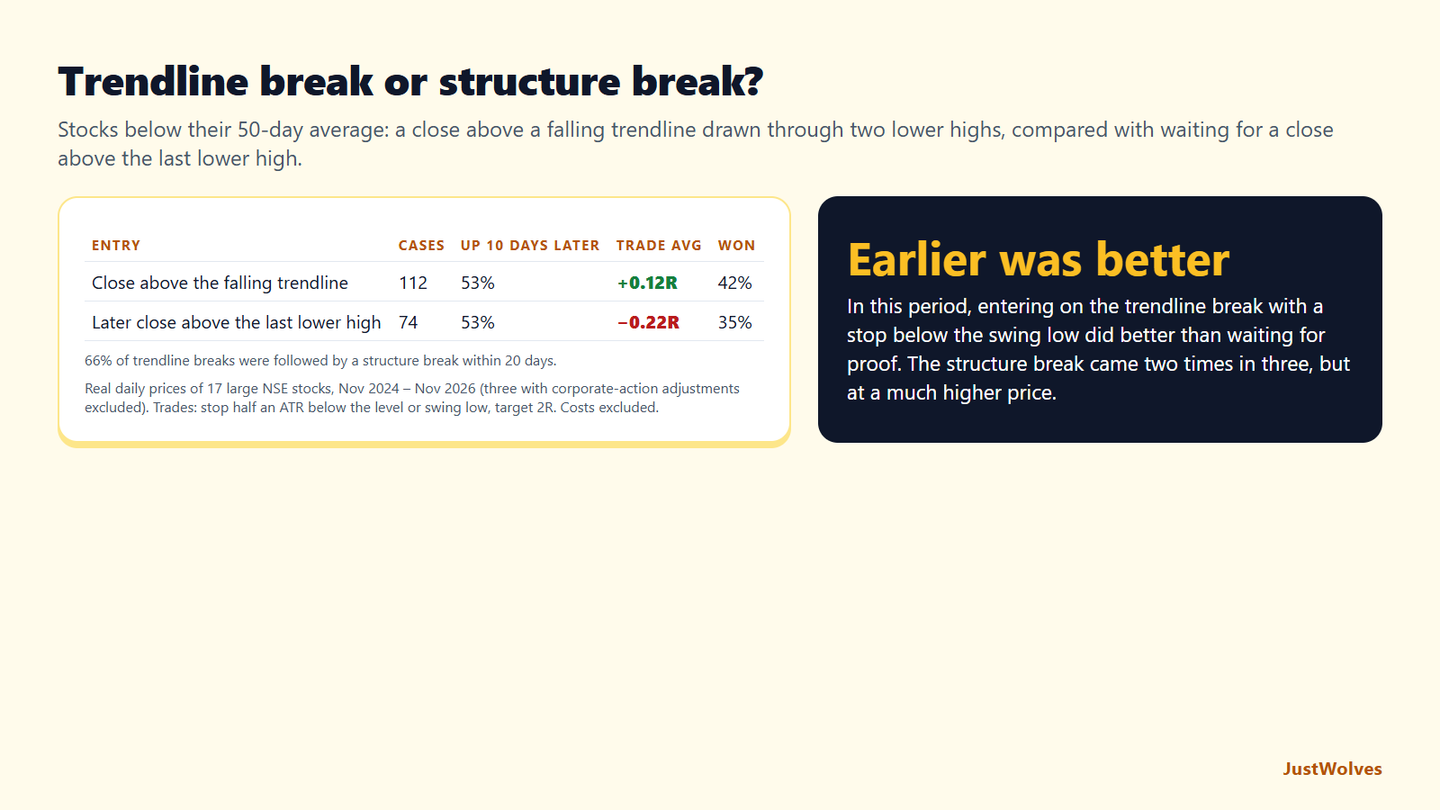
JustWolves tested this lesson's confirmation ladder on about two years of daily prices for 17 large NSE stocks (November 2024 to November 2026). In stocks below their 50-day average, we drew a falling line through each pair of significant lower highs and recorded the first close above it: 112 trendline breaks. For each, we also recorded whether price later closed above the last lower high within 20 days, the structure break. Both entries used a stop half an ATR below the lowest low since the second high, and a 2R target.
| Entry | Cases | Up 10 days later | Trade average | Won |
|---|---|---|---|---|
| Close above the falling trendline | 112 | 53% | +0.12R | 42% |
| Later close above the last lower high | 74 | 53% | −0.22R | 35% |
The result ran against the usual advice. This lesson's ladder treats the structure break as the stronger signal, and in terms of evidence it is. But in this period, entering on the trendline break with a stop below the swing low did better on average, +0.12R per trade against −0.22R for waiting. The reason is price: by the time the last lower high was cleared, much of the move had happened and the stop was further away, as in the Infosys chart above, where the structure entry came about ₹75 higher.
Most line breaks did lead somewhere. Two in three were followed by a structure break within 20 days, so the trendline break was a useful early warning, as this lesson says. And the stop placement in this lesson, beyond the swing low rather than just beyond the line, is what made the early entry workable: the line itself was retested often.
This does not overturn the lesson's caution. A trendline break is still not a trend reversal, and on its own it fails often: 58% of these trades lost. What the data suggests is that a smaller position on the line break, with a structural stop, can be a reasonable alternative to waiting for full confirmation, provided you accept more frequent losses.
Common Mistakes
- Treating any trendline break as a reversal.
- Redrawing lines after price breaks them.
- Lines through only two minor points.
- Stops just beyond the line.
- Ignoring horizontal levels near the break.
Professional Insight
Experienced traders often treat trendlines as a way to see the pace of a trend rather than as hard levels. A trendline break tells them to start watching for a structural change; the structural change, not the line, triggers their trade. That ordering avoids most of the false signals trendlines produce.
Risk Considerations
- Subjectivity in drawing lines.
- Sideways breaks that don't lead to reversals.
- Retests of the line that shake out tight stops.
Important Terminology
| Term | Meaning |
|---|---|
| Trendline | A line connecting swing highs or swing lows. |
| Trendline break | A close beyond the trendline. |
| Structure break | Price breaking the last swing that defined the trend. |
| Higher low | A swing low above the previous one. |
| Confluence | Several independent reasons at the same price. |
Does a trendline break mean the trend has reversed?
Not by itself. It shows the trend has slowed; a reversal is confirmed when structure changes.
How many touches does a trendline need?
Two points define it; a third touch makes it more significant.
Where should I put my stop on a trendline breakout?
Beyond the most recent swing point, not just the other side of the line.
What is the best trendline breakout?
One that coincides with a break of horizontal resistance or of the last lower high.
Should I use log or linear charts?
Either, consistently. Over long periods with large price changes, log scale often gives more consistent lines.
Should I buy the trendline break or wait for the structure break?
Both have trade-offs. In our test on 17 NSE stocks, entering on the trendline break with a stop below the swing low averaged +0.12R per trade, while waiting for a close above the last lower high averaged −0.22R, because the confirmed entry came much higher.
How often does a trendline break lead to a trend change?
Often, but not always. In our NSE data, about two-thirds of closes above a falling trendline were followed by a close above the last lower high within 20 trading days; the other third did not change the structure.
Practical Exercise
Test trendline breaks.
Your task
Step 1: Find ten downtrends
With at least three touches on the trendline.
Step 2: Mark the break
The first close above the line.
Step 3: Mark the structure break
If and when price broke the last lower high.
Step 4: Compare
Which signal led to sustained moves more often?
Check Your Understanding
A downtrend line connects:
Related Lessons
Previous: Support and Resistance Breakouts. Next: Range and Consolidation Breakouts. See also Trendlines and Price Channels.